Nanotechnology Statistics By Market (Size, Share, Analysis), Publications, Key Players, Trends and Facts (2026)
Updated · Mar 14, 2026


Table of Contents
- Introduction
- Editor’s Choice
- Nanotechnology Market Size
- AI In The Nanotechnology Market Size
- Market Share By Type
- Market Share By Technology Analysis
- Nanotechnology Statistics By Publications
- Sectoral Distribution Of Nanotechnology-Enabled Products
- Key Market Players and Patent Leaders
- Regulatory and Commercialization Roadblocks
- Investment and VC Funding Trends
- Conclusion
Introduction
Nanotechnology Statistics: The field of nanotechnology enables scientists to study material properties through atomic and molecular structure manipulation. Nanotechnology is heavily utilized across various sectors, including healthcare, electronics, energy production, manufacturing, defense, and environmental protection. The field of nanotechnology develops medical treatments that deliver precise tumor destruction through targeted cancer cell treatment, and it creates lightweight yet powerful materials that enhance aircraft performance and enable future quantum computing development.
The article presents nanotechnology statistics 2025 market data together with market predictions, research findings, and industry knowledge, which demonstrate rapid growth in the sector.
Editor’s Choice
- The global nanotechnology market is valued at USD 8.78 billion in 2025 and is projected to reach USD 115.41 billion by 2034, expanding at a 33.14% CAGR.
- The AI-powered nanotechnology segment is expected to surge from USD 859.7 million in 2025 to USD 25.7 billion by 2034, recording a 45.9% CAGR.
- North America held 39.4% market share in 2024, generating USD 245.2 million in AI-integrated nano revenue.
- Nanosensors increased their dominance from 60.7% in 2020 to 62.8% in 2024, driven by diagnostics and smart monitoring demand.
- Biosensors expanded their share from 50.4% to 52.7%, reflecting strong growth in medical detection applications.
- Nanodevices retained 37.2% market share in 2024, despite slight diversification trends.
- Infrared spectrometers grew from 31.1% to 33.1%, indicating rising adoption in industrial analytics.
- Machine Learning penetration in nano-tech stacks increased to 81.2% in 2024, reinforcing AI-led materials modeling.
- China led global nano-publications in 2024 with a 31% share, overtaking traditional research leaders.
- The EU27+UK accounted for 15%, while India captured 12% of global nano research output.
- The United States held 6% of nano-publications, showing intensified global research competition.
- Healthcare and pharmaceuticals represent 30% of nanotechnology-enabled products, the largest sectoral share.
- Chemicals and advanced materials contribute 29%, followed by ICT at 21% of total applications.
- Samsung secured 10,709 U.S. patents in 2025, maintaining global IP leadership in nanoelectronics.
- The nanorobotics market is projected to grow from USD 9.36 billion in 2025 to USD 22.16 billion by 2033, at an 11.37% CAGR.
Nanotechnology Market Size
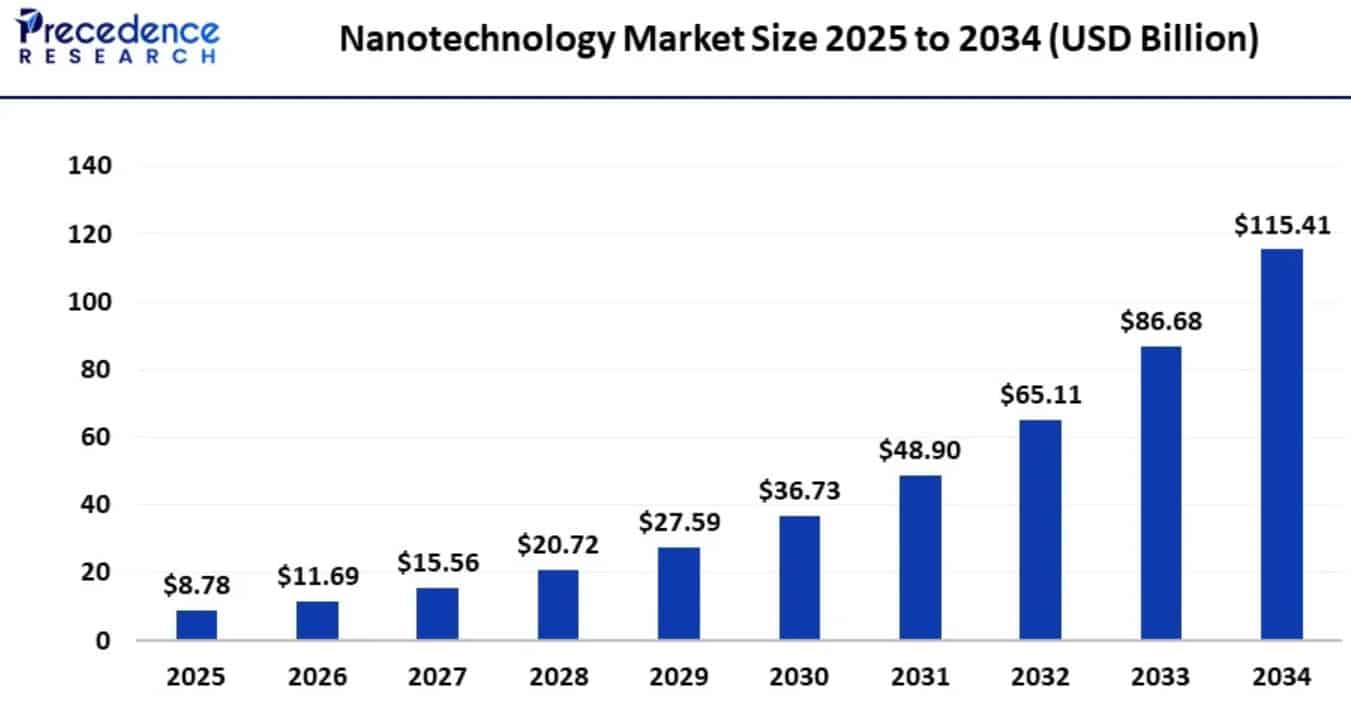
(Source: precedenceresearch.com)
- The latest Nanotechnology statistics signal a decade of aggressive expansion and consolidation.
- The global nanotechnology market was valued at USD 8.78 billion in 2025 and is projected to reach about USD 115.41 billion by 2034, with a compound annual growth rate of 33.14%.
- The fast growth of this sector shows that there is an increasing need for healthcare solutions, electronic devices, energy storage systems, and advanced material technologies.
- The process of mergers and acquisitions during strategic inorganic growth is changing how companies compete because industry leaders are building their research and development resources and increasing their patent collections.
- The Nanotechnology statistics show that the market has shifted from its research period to its active worldwide commercial operation stage.
AI In The Nanotechnology Market Size
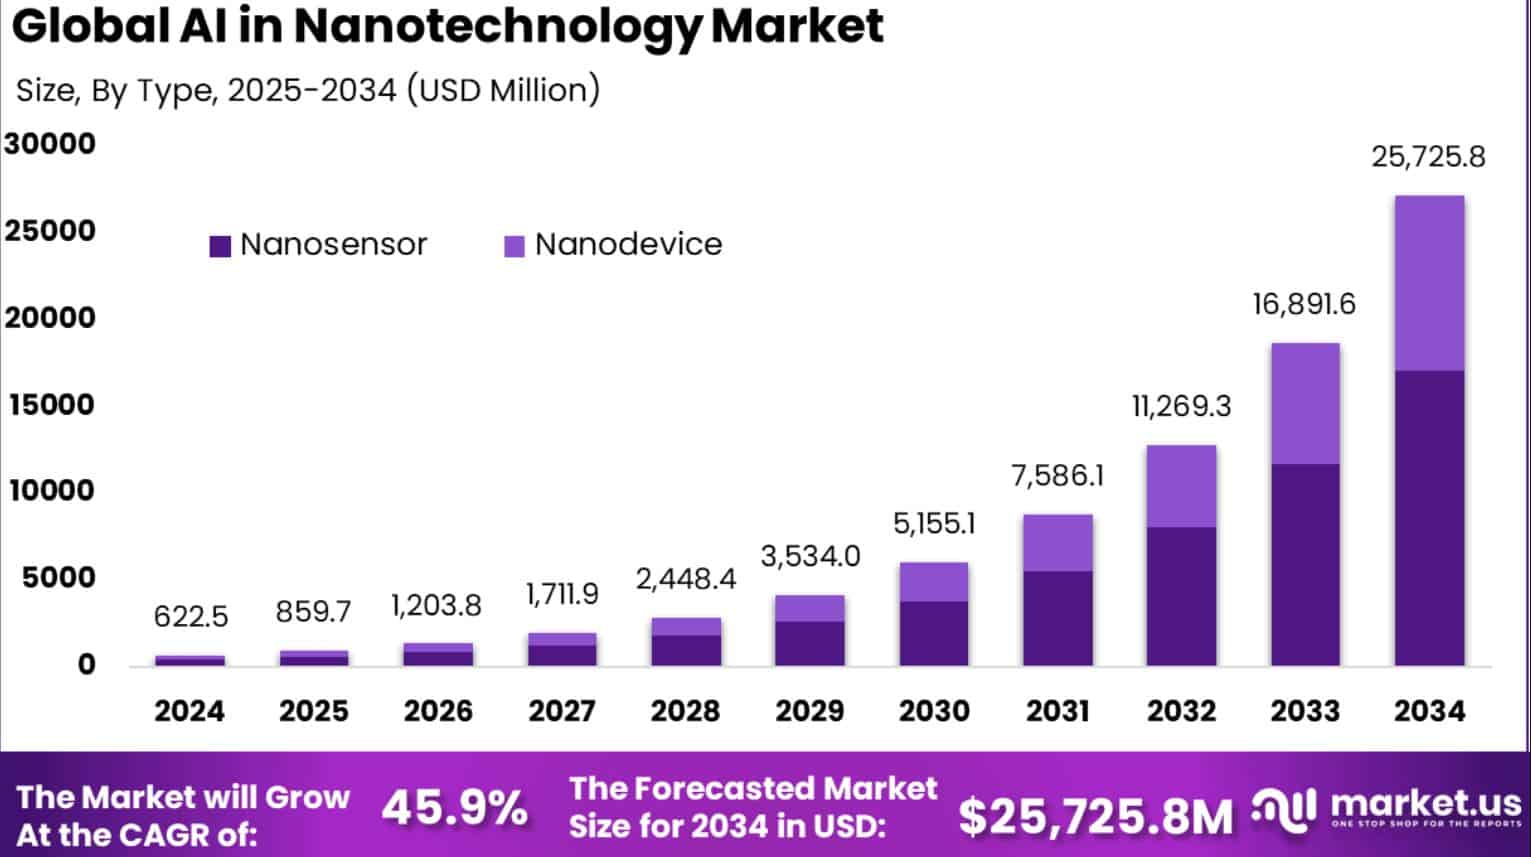
(Source: market.us)
- According to market.us, the AI-powered nanotechnology market is entering a high-acceleration phase.
- The market reached USD 859.7 million in 2025 and is projected to scale to an extraordinary USD 25,725.8 million by 2034, which brings a market value of USD 622.5 million in 2024. The market shows an exceptional compound annual growth rate of 45.9%.
- The market experiences rapid growth because artificial intelligence is now being used in drug discovery, precision materials engineering, and nano-scale manufacturing.
- North America maintained a dominant market position in 2024 because it held 39.4% of the market share, resulting in USD 245.2 million in revenue, because of its advanced nanoscience technology and research and development capabilities.
| By Type | 2020 | 2021 | 2022 | 2023 | 2024 |
| Nanosensor | 60.7% | 61.2% | 61.8% | 62.3% | 62.8% |
| – Optical Nanosensor | 13.4% | 13.4% | 13.3% | 13.3% | 13.3% |
| – Chemical Nanosensor | 23.7% | 23.6% | 23.4% | 23.2% | 23.0% |
| – Physical Nanosensor | 7.6% | 7.4% | 7.2% | 7.0% | 6.8% |
| – Biosensors | 50.4% | 50.9% | 51.5% | 52.1% | 52.7% |
| – Others | 4.9% | 4.7% | 4.6% | 4.4% | 4.2% |
| Nanodevice | 39.3% | 38.8% | 38.2% | 37.7% | 37.2% |
| – Nanomanipulator | 18.2% | 18.3% | 18.4% | 18.5% | 18.5% |
| – Test Instruments | 23.2% | 23.0% | 22.9% | 22.8% | 22.7% |
| – Infrared Spectrometers | 31.1% | 31.6% | 32.1% | 32.6% | 33.1% |
| – Others | 27.5% | 27.1% | 26.6% | 26.1% | 25.7% |
(Source: market.us)
- The latest Nanotechnology statistics show that nanosensors have maintained their market leadership position throughout the market research period.
- The share of nanosensors increased from 60.7% in 2020 to 62.8% in 2024 because healthcare diagnostics, environmental monitoring and smart electronics demand for their use had risen.
- The biosensors in this segment showed growth from 50.4% to 52.7% because medical and biochemical detection applications had expanded their use.
- The rate of decline for chemical and physical nanosensors reached its peak for physical nanosensors, which dropped to 6.8% by 2024.
- The market for Nanodevices shows stable diversification despite experiencing a slight decrease from 39.3% to 37.2% for their total market share.
- The adoption of infrared spectrometers by industrial and research institutions increased, which drove their market share from 31.1% to 33.1% during this period.
- The Nanotechnology statistics demonstrate that the market currently focuses on developing sensing technologies and accurate analytical equipment, which drives technological progress.
| By Technology | 2020 | 2021 | 2022 | 2023 | 2024 |
| Machine Learning | 79.8% | 80.1% | 80.5% | 80.8% | 81.2% |
| Natural Language Processing | 9.1% | 9.0% | 8.8% | 8.6% | 8.4% |
| Robotics | 6.5% | 6.4% | 6.3% | 6.3% | 6.2% |
| Others | 4.6% | 4.5% | 4.4% | 4.3% | 4.3% |
(Source: market.us)
- The most recent Nanotechnology statistics show that technological development produces a specific innovation outcome pattern, which researchers measure through their findings.
- The technology stack currently consists of Machine Learning, which increased its usage from 79.8% in 2020 to 81.2% for the year 2024.
- The technology shows continuous growth because it serves essential functions in three areas, which include predictive modeling and nano-material simulations, as well as precision diagnostics.
- Natural Language Processing experienced a minor decline, which brought its usage down from 9.1% to 8.4%, while the technology maintained its applicable research areas for both documentation and data analysis.
- Robotics experienced a minor decline, which brought its usage down from 6.5% to 6.2%, while the technology showed gradual adoption patterns for its use in nano-fabrication.
- The “Others” category experienced a slight decrease, which brought its total down to 4.3%, while the data showed that organizations maintained their focus on core AI technologies.
Nanotechnology Statistics By Publications
(Reference: nationalacademies.org)
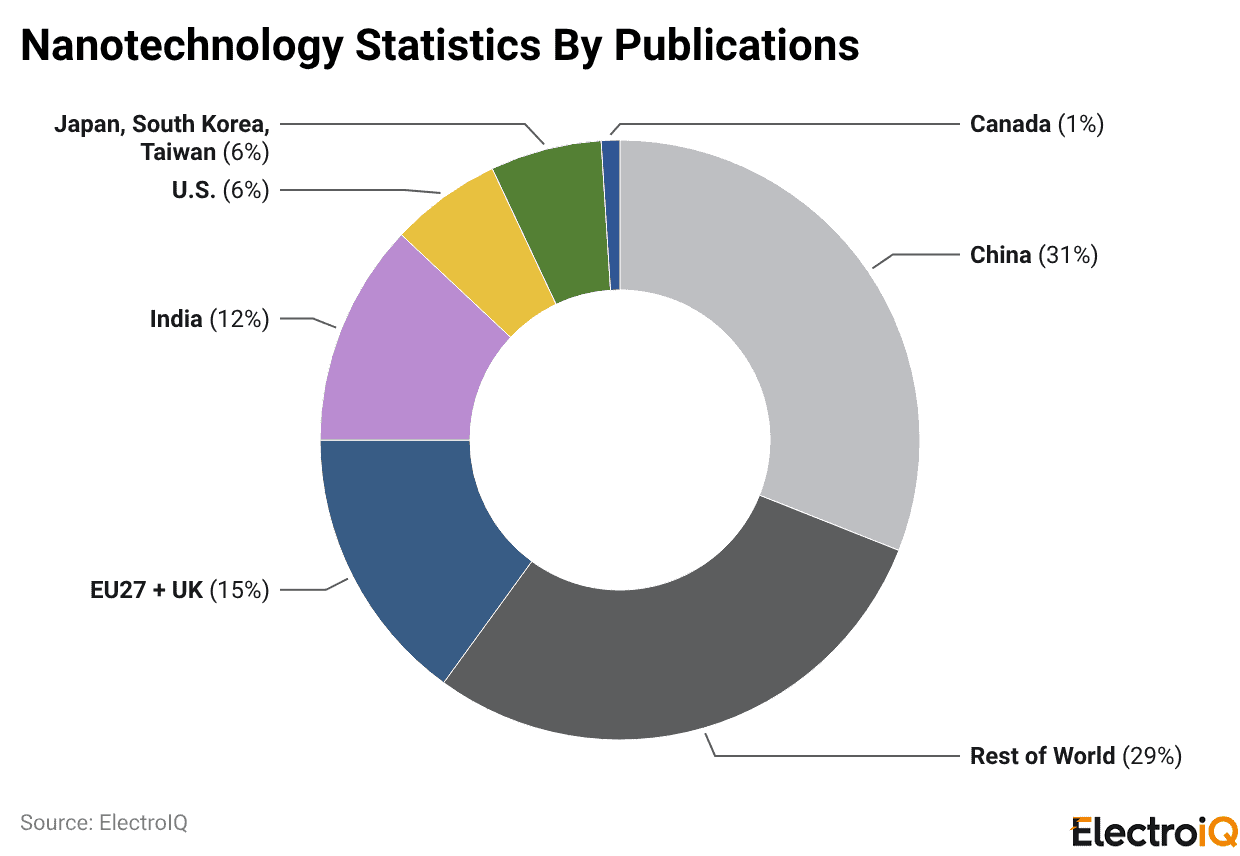
- The latest Nanotechnology statistics show that global research leadership has shifted to a new country.
- In 2024, China dominated nano-publications with a commanding 31% share, reinforcing its sustained investment in advanced materials and semiconductor innovation.
- The Rest of the World collectively contributes 29%, which indicates that countries outside traditional powerhouses have joined the research efforts.
- The EU27+UK accounts for 15%, while India shows strong academic growth at 12%, which demonstrates its expanding research base.
- Japan, South Korea, and Taiwan share a combined market share of 6%, while the United States holds 6% market share.
- Canada produces 1%, which establishes its presence as a specialized yet minor research nation.
- The Nanotechnology statistics demonstrate that global competition has increased because Asia now conducts the most nanoscience research.
Sectoral Distribution Of Nanotechnology-Enabled Products
(Source: electroiq.com)
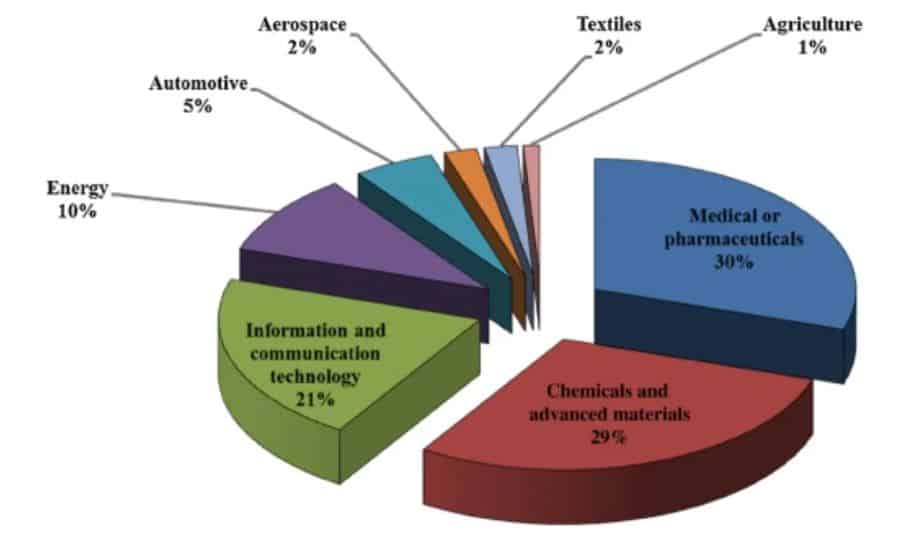
- The latest Nanotechnology statistics show that healthcare serves as the primary market segment for commercial development.
- Medical and pharmaceuticals account for 30% of nanotechnology-based products, reflecting strong adoption in drug delivery systems, diagnostics, and precision therapeutics.
- The following industries use 29% of their resources to chemicals and advanced materials, which demonstrates how essential nanotechnology is in creating lightweight composites and producing high-performance coatings.
- Information and communication technology represents 21%, showing growing integration into semiconductors, sensors, and miniaturized electronic components.
- Energy applications contribute 10% to the total, which stems from battery innovation and solar efficiency improvements, while automotive uses 5% for nanomaterials to enhance durability and fuel efficiency.
- The aerospace and textile sectors each account for 2% of market share, while agriculture represents 1% to show that these fields currently develop niche markets.
- The existing Nanotechnology data shows that market development for healthcare and advanced materials research has created a foundation that drives innovation across multiple industries.
Key Market Players and Patent Leaders
- The latest statistical data about Nanotechnology research shows that worldwide innovative research activities operate without specific geographic boundaries, while different research institutions keep their business operations running in distinct locations.
- According to WIPO’s 2024 data, patent filings in semiconductors, nanoelectronics, and advanced materials reached record highs, with China, the United States, the Republic of Korea, and Japan collectively accounting for the majority of applications.
- The geographical distribution of research activities demonstrates that multiple organizations compete to achieve superior control over nanoscale fabrication processes and transistor design techniques.
- The corporate sector controls the nanoelectronics value chain through major companies, which include Intel, IBM, Samsung Electronics, TSMC, ASML, Thermo Fisher Scientific, STMicroelectronics and Infineon Technologies.
- Patent analytics on FinFET and GAAFET transistor technologies indicate that TSMC, Samsung, and IBM together control roughly 50% of U.S. patents in these advanced nodes—demonstrating deep intellectual property control at sub-5-nanometer scales.
- IFI CLAIMS’ 2024 ranking places Samsung at the top of U.S. patent grants for multiple consecutive years, while TSMC has climbed to second position, surpassing Qualcomm, Apple, and Huawei.
- Parola Analytics’ FY2025 data further confirms Samsung’s dominance with 10,709 U.S. patents granted, followed by LG (5,194), TSMC (4,460), and IBM (2,515).
- Samsung has established itself as the leading company in EPO filings for 2024, according to European Patent Office data, which demonstrates its ability to protect intellectual property across different legal systems.
Regulatory and Commercialization Roadblocks
| Indicator / Policy lever | 2023–2024 baseline | 2024–2025 policy shift | Documented macro effect by 2025 |
| Global GDP growth (UNCTAD) | Above 2.5% pre‑pandemic average, but already sluggish | Projected to slow to 2.3% in 2025 | Growth falls below the 2.5% “recessionary” threshold often used as a benchmark for global downturn risk. |
| Global GDP growth (OECD) | 3.3% in 2024 | Projected 2.9% in 2025 and 2026 | Slowdown concentrated in the U.S., Canada, Mexico, and China, with especially weak U.S. output growth of about 1.1% through 2025. |
| U.S. trade policy (IEEPA tariffs) | No new universal tariff; legacy Section 232/301 measures in place | New 10% across‑the‑board tariff plus higher reciprocal duties on large‑deficit partners | Higher trade costs, weaker business confidence, and downside risks to global trade volumes are highlighted by OECD. |
| U.S. energy policy | Standard regulatory processes, no energy emergency | January 2025 National Energy Emergency declaration broadening “energy” and expediting projects | Reallocation of capital toward domestic energy and infrastructure under emergency powers, adding to policy uncertainty and sectoral imbalances. |
| UK Skilled Worker general salary threshold | £26,200 pre‑April 2024 | Raised to £38,700 from 4 April 2024 | Designed to reduce net migration and raise average earnings, but effectively excludes many lower‑paid roles. |
| UK Skilled Worker threshold (new applicants, mid‑2025) | £38,700 in 2024 | Increased to £41,700 by July 2025 | Further tightens skilled migration, intensifies labour shortages, and increases wage and cost pressures for employers. |
| ODA flows to developing countries | Nearly 175 billion dollars in 2020 | Fell to about 160 billion dollars in 2023, with an 18% drop from major donors expected by 2025 | Reduces external financing buffers for developing economies amid trade and financial headwinds. |
Investment and VC Funding Trends
- The current Nanotechnology statistics show a commercial gap that prevents full market development, even though experts predict that international sales will reach more than USD 400 billion by the middle of the 2030s (Technavio; Metatech Insights).
- The main challenge arises from the combined effects of “regulatory drag plus capex drag.” Nanoscale production needs cleanrooms and EUV lithography and advanced microscopy and precision metrology, which require facility investments that reach hundreds of millions for carbon nanotube or conductive nanoparticle production.
- The high embedded research and development expenses make even small yield declines result in margin declines.
- The U.S. FDA and EPA, together with other regulatory bodies, require companies to perform product-specific toxicology studies and lifecycle environmental assessments and complete nanomaterial characterization under TSCA and REACH regulations.
- The time required for drug development in nanomedicine research increases because of extended clinical and biodistribution testing (NCI; FDA guidance).
- The current Nanotechnology statistics show that capital requirements, along with compliance challenges, are the main obstacles preventing companies from achieving profitable growth.
Conclusion
Nanotechnology Statistics: The 2025 nanotechnology landscape demonstrates that nanoscale science has significant effects on technological development. The global nanotechnology market is valued at USD 8.78 billion. The technology has become a basic requirement for all fields. North America and the Asia-Pacific regions lead in research and patent development, while nanotechnology is emerging as a key technology for 21st-century innovation.
The present situation shows upward progress across multiple fields, including healthcare advancements, advanced electronics, clean energy, intelligent manufacturing methods, and other areas. Nanotechnology extends beyond its smallest components because its fundamental research creates substantial changes. The 2025 data show that the technology already produces measurable effects on both global economic development and scientific research.
Sources
FAQ.
The global nanotechnology market will experience a market value of USD 8.78 billion in 2025, which will increase to USD 115.41 billion by 2034 through a strong 33.14% annual growth rate.
The AI-powered nanotechnology market will grow from USD 859.7 million in 2025 to USD 25.7 billion by 2034 because drug discovery and precision materials engineering drive the market.
In 2024, China leads with 31% of global nano-publications, followed by the EU27+UK (15%) and India (12%), reflecting Asia’s dominance in nanoscience research output.
Healthcare leads with 30% share, followed by chemicals and advanced materials (29%) and ICT (21%), showing strong adoption in medicine, coatings, semiconductors, and smart electronics.
High capital investment requirements, strict regulatory approvals (FDA, EPA, REACH), and global economic slowdowns create primary obstacles that limit business growth potential and operational success.

Pramod Pawar brings over a decade of SEO expertise to his role as the co-founder of 11Press and Prudour Market Research firm. A B.E. IT graduate from Shivaji University, Pramod has honed his skills in analyzing and writing about statistics pertinent to technology and science. His deep understanding of digital strategies enhances the impactful insights he provides through his work. Outside of his professional endeavors, Pramod enjoys playing cricket and delving into books across various genres, enriching his knowledge and staying inspired. His diverse experiences and interests fuel his innovative approach to statistical research and content creation.