Checkout.com Statistics By Payment Method, Customers and Security (2025)
Updated · Nov 04, 2025


Table of Contents
- Introduction
- Editor’s Choice
- Checkout.com Payment Method Statistics
- Technological Innovations And AI Generation
- Checkout.com Customers Statistics By Products And Services
- Checkout.com Statistics By Country
- Fraud Prevention And Security Enhancements At Checkout.com
- Checkout.com Global Expansion And Regional Growth
- Checkout.com Has Competitors And Alternatives
- Economic Impact Study On Checkout.com
- Checkout.com Trends
- Marketing Channels
- Checkout.com Social Traffic
- Conclusion
Introduction
Checkout.com Statistics: Checkout.com is a large payments company that backs online payments for large-scale digital brands. Performance (higher acceptance rates, lower latency), product enhancements, and geographic expansion were all major drivers in 2024.
The company claims to have closed 2024 in profitability, with rapid net revenue growth, adding many hundreds of enterprise merchants, and pushing strongly into the U.S., Japan, Saudi Arabia, and wider MENA (Middle East & North Africa) region. This article will discuss the key Checkout.com statistics.
Editor’s Choice
- New revenue grew 40% in 2024, with Commerce and Fintech accounting for 45% of growth, with a U.S. business increase of over 80%.
- The firm further added over 300 enterprise merchants, including Ticketmaster, Bumble, Trip.com, and Heineken.
- 40+ companies are processing over US$1 billion per year on the platform; 67 merchants processed US$10 million within a single Day on Black Friday.
- Merchant NPS has risen to 63, signifying increased customer satisfaction.
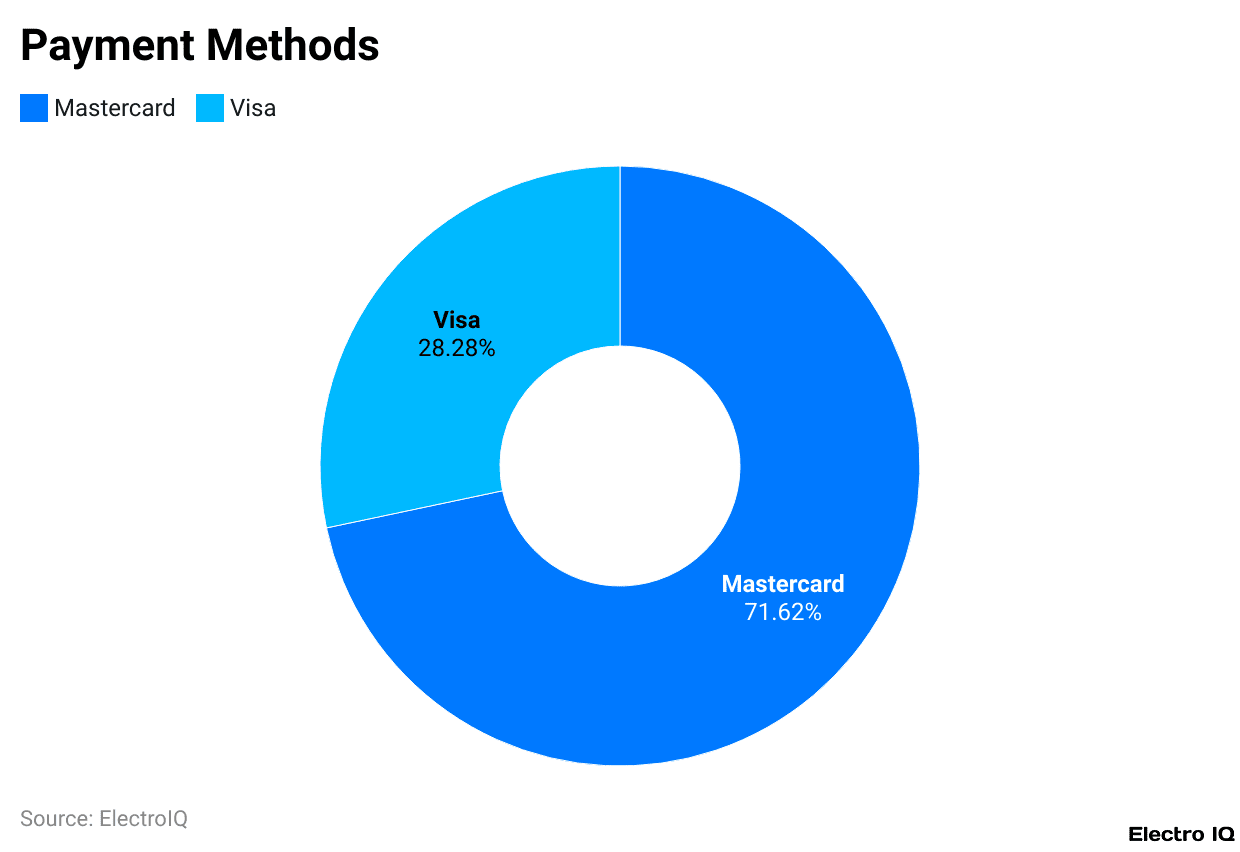
- Checkout.com payment data shows Mastercard 71.62% and Visa 28.38%, with credit cards 76.42%, debit 16.19%, prepaid 7.29%, and deferred debit 0.1%.
- AI-powered optimisation tools increased the approval rate of transactions by 10%, blocked fraudulent transactions of 2 billion dollars, and reduced customer support response time by 40%.
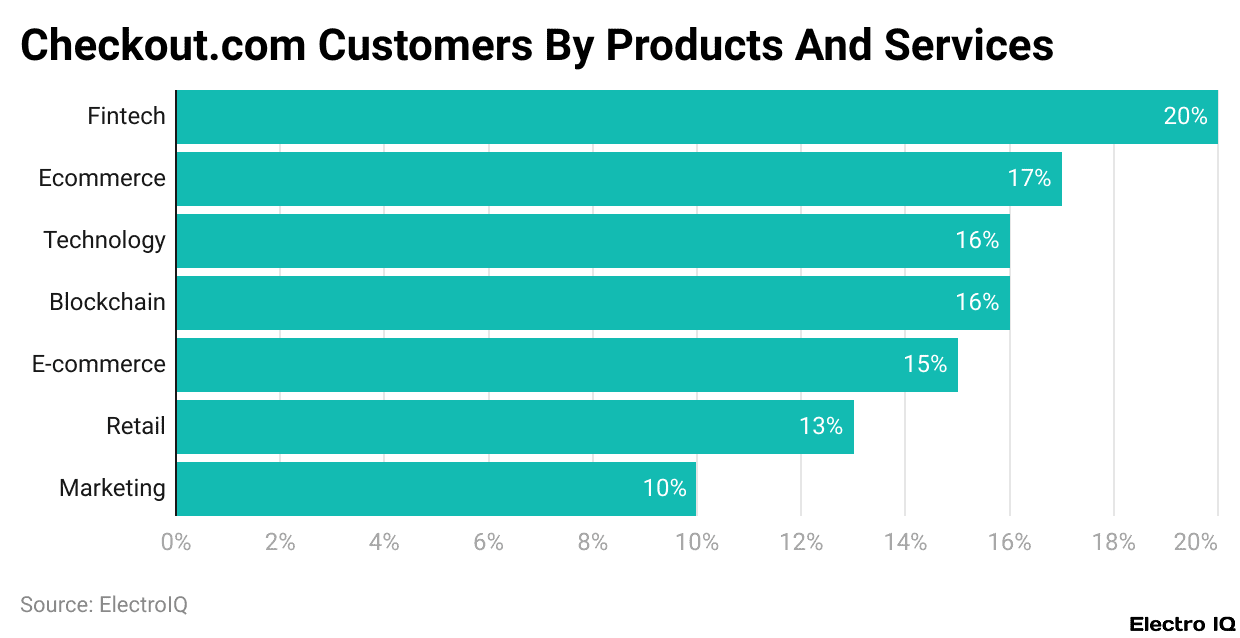
- Customer base leader is fintech at 20%, and then are 17% for e-commerce, 16% for technology, 16% for blockchain, using all other products, 13% for retail, and 10% for marketing.
- Checkout.com operates 179 sites stateside, 129 in Canada, 101 in Australia, and 96 in Italy, with an additional 335 out in the world, with a bounce rate of 39.26%.
- Checkout.com Fraud prevented 35% fraud, 25% false positives, US$800 million potential fraud, and detects better with 3D Secure 2.0 (+20%).
- Checkout.com likes to compare itself to the competition with 3% higher approval rate than Square and AI-driven fraud detection.
Checkout.com Payment Method Statistics
(Reference: coolest-gadgets.com)
- According to Checkout.com’s payments data, virtually every transaction goes through either one of two major card networks.
- Mastercard leads with a share of 71.62%, while Visa comes in second with a share of 28.38%.
- These two networks are the ones basically handling close to all card payments from Checkout.com, representing their dominance on the platform.
- Breaking payments down by card type, credit cards comprise the biggest portion, at 76.42%, followed by debit cards at 16.19%.
- Prepaids constitute 7.29%, whereas deferred debits are very rarely used, at only 0.1%.
- This indicates that Checkout.com’s processing activities tilt heavily toward Mastercard credit cards, with debit and prepaid cards making only minor contributions.
Technological Innovations And AI Generation
| Metric | Value |
| Transaction approval rate increase | 10% |
| Investment in machine learning | $150 million |
| Fraudulent transactions prevented | $2 billion |
| AI-assisted customer support efficiency |
40% reduction in response time
|
| Peak transaction forecasting |
Predictive analytics used
|
(Source: coinlaw.io)
- As per Coinlaw, Checkout.com statistics show that since it incentivises the integration of cutting-edge technology and artificial intelligence into its payment platform, Checkout.com claims to enhance both performance and security.
- Its AI-optimisation tools have increased approval rates for transactions by 10% throughout all markets, meaning more successful payments for merchants and fewer failed attempts for clients.
- Throughout 2023, the company made a US$150 million investment in machine learning projects for strengthening fraud detection and risk management.
- The results are significant: more than US$2 billion in fraudulent transaction attempts in real-time have been stopped from being handled by merchants worldwide, which saves them money and their reputations.
- Simultaneously, AI-based customer support has helped reduction between 40% in response times, offering businesses a faster and more streamlined support experience.
- Together with these innovations, Checkout.com is describing the use of AI and new technologies not merely for efficiency but also for instilling trust and reliability in merchants and their customers.
Checkout.com Customers Statistics By Products And Services
(Reference: coolest-gadgets.com)
- Checkout.com’s client base spans several key sectors, with fintech companies claiming the biggest share at about 20%, followed by e-commerce businesses at 17% and technology companies at 16%.
- This highlights that Checkout.com is more apt in industries where digital payments, security, and scaling are paramount.
- Extending to the broader list of products and services provided by Checkout.com, 16% of companies relate to blockchain, 15% to e-commerce, 13% to retail, and 10% to marketing.
- This shows that Checkout.com solutions are provided to industries, apart from payments, that require flexibility when handling large, fast, and secure transactions.
Checkout.com Statistics By Country
| Country | Websites |
| United States | 179 |
| Canada | 129 |
| Australia | 101 |
| Italy | 96 |
| United Kingdom | 88 |
| United Arab Emirates | 53 |
| Spain | 35 |
| Saudi Arabia | 33 |
| South Africa | 33 |
| France | 31 |
| Rest of The World | 335 |
(Source: sci-tech-today.com)
- Checkout.com operates a wide network of websites globally to facilitate its payment services.
- The U.S. has approximately 179 programs, Canada about 129, Australia nearly 101, while Italy offers 96 of its own.
- The United Kingdom is home to 88 sites, followed by the UAE at 53 and Spain with somewhere near 35.
- Both Saudi Arabia and South Africa count around 33 each, with France chipping in 31 sites.
- Aside from these show-up outfits, another 335 sites scattered across other countries acknowledge heavier international exposure for the platform.
- Viewing from a user engagement point, the platform sports a bounce rate of 39.26%, indicating that slightly under four in ten visitors leave the site after seeing only a single page.
- Changed by traffic, the platform witnessed some 9.5 million visitors in October 2022, slightly down by about 2.3% compared to 9.7 million in September 2022.
- Going against this negative figure, the platform experienced positive traction from August 2022, wherein 7.8 million visits were logged.
- This means that overall, though with minor ups and downs, user and merchant interest on Checkout.com was trending upwards.
Fraud Prevention And Security Enhancements At Checkout.com
- Checkout.com has augmented its fraud prevention and security systems to provide better merchant protection and reliability.
- In 2023, its multi-layered fraud system was able to reduce fraud by 35%, a compelling decrease in risky transactions for businesses using the platform.
- The company has also used machine learning models that adjust in real time to identify suspicious behaviour, which improves the accuracy of fraud detection and also reduces false positives by 25%, the number of legitimate transactions unwarrantedly flagged.
- All combined, these high-tech security instruments have stopped more than US$800 million worth of potentially fraudulent transactions.
- Tokenisation was always at the centre of Checkout.com’s philosophy, as it would obfuscate sensitive payment information and be a 100% compliant way of storing customer data in the transaction.
- 3D Secure 2.0 introduction has further helped in providing a 20% improvement in fraud detection to this set of merchants.
- Enhanced end-to-end encryption keeps data safe throughout the payment process.
- To give merchants more oversight and control over suspicious activities, Checkout.com released the Fraud Detection Dashboard in 2023, which enables merchants to monitor, analyse, and react swiftly to suspicious activities.
- Together, these initiatives amplify how much safety and trust in payments continue to be emphasised by Checkout.com for the global clientele.
Checkout.com Global Expansion And Regional Growth
| Region |
Growth/Market Penetration
|
| Southeast Asia |
40% increase in transaction volumes
|
| Europe |
35% of cross-border transactions
|
| Latin America |
50% growth in merchant adoption
|
| North America |
15% of e-commerce payments (up from 10%)
|
| Middle East and North Africa |
$10 billion in payments processed
|
| South Africa |
60% increase in merchants
|
| UAE |
100% market penetration
|
(Source: coinlaw.io)
- Checkout.com continued to reinforce its global presence, showing huge growth in different regions.
- With an enormous 40% volume increase in Southeast Asia in 2023, it shows how deeply the company is entrenched in that region’s digital economy.
- In the European markets, having built a reputation as a leading payment provider, Checkout.com accounted for 35% of cross-border transactions, highlighting further the key significance of international trade.
- Latin America led with the fastest growth, with merchant adoption surging by 50%, showing how the platform is gaining ground in emerging markets.
- In North America, Checkout.com increased its share of e-commerce payments from 10% the year before to 15%, marking a significant jump in that highly competitive market.
- With payments worth US$10 billion up for processing in 2023, the Middle East and North Africa strengthened as a hub.
- On the other hand, Africa also exhibited good signs of growth, with Great South Africa showing the highest levels of growth, i.e., an increase of 60% in merchants using Checkout.com.
- However, one of the most striking feats would have to be the United Arab Emirates, where 100% of the market penetration was achieved by Checkout.com, making it the preferred provider of the largest merchants.
- These global footprints show Checkout.com’s capacity to tailor itself quickly to local peculiarities while growing faster in continental presence.
Checkout.com Has Competitors And Alternatives
- Checkout.com stands in a landscape of lucrative payment institutions, each possessing strengths on its own.
- Stripe is by far the strongest competitor to Checkout.com, but while both are competing across countries, Checkout.com puts more weight on cross-border transactions.
- Adyen is another crucial player, famous for its more extensive point-of-sale solutions, while Checkout.com focuses on smoother online payment integrations.
- PayPal takes the consumer-front crown, while Checkout.com thrives in the enterprise B2B space.
- When compared to Square, which primarily caters to SMBs, Checkout.com offers 3% higher transaction approval rates, a fact that pleases the large merchants even more.
- At least incumbent providers can claim superiority in fraud prevention, but the reliance on AI-driven fraud detection almost certainly gives Checkout.com considerably more sophisticated protection.
- Braintree prioritises smaller businesses, while Checkout.com’s dimensions make it ideal for those enterprises with an astronomical number of transactions.
- One of the major differentiators for Checkout.com is the ability to facilitate multi-currency payments with little or no effort, a notion in which most competitors fail.
- From all these comparisons, it is quite evident that paying attention to enterprise and cross-border payments, as well as advanced fraud protection, will help distinguish Checkout.com in the global payments space.
Economic Impact Study On Checkout.com
- The study, carried out by Forrester at the behest of Checkout.com in 2024, brought out various figures regarding the economic impact of the company on its enterprise customers.
- Between 2008 and 2010, Checkout.com augmented revenue by an additional US$13.4 million owing to a 2.1% uplift in acceptance rates across three years.
- For commerce and fintech enterprises, the net present value (NPV) of working with Checkout.com has been stipulated at US$12.4 million over a period of three years.
- Customers also obtained full payback within six months, with an ROI of 182% in three years.
- When it comes to other benefits, there was a reduction of 7% in payment retries to the benefit of conversion rates, which saved nearly US$1 million in scheme and gateway fees.
- Checkout.com can reduce fraud without damage to performance, with effective machine learning fraud allowances and fewer chargebacks.
- Most importantly, the platform remained reliable with seasonal peaks during Black Friday and Cyber Monday, thus merchants could handle high volumes of transactions without any interruptions.
- These findings support Checkout.com as an advanced payment processor whose anti-fraud tools present measurable financial gains and increased reliability to big enterprises.
Checkout.com Trends
- In 2024, Checkout.com achieved 40% net revenue growth overall, alongside 45% growth in Commerce and Fintech services, which amount to around 95% of total volumes, while exiting profitably with full-year profitability projected for 2025.
- Alone, the U.S. business grew by well over 80%, and revenue concentration was reduced such that the top 10 accounts contributed to just 18% of total revenues.
- Onboarding more than 300 new merchants, some of which include global brands such as Ticketmaster, Bumble, and Heineken; there are now 40+ companies that process over US$1 billion annually via Checkout.com.
- On Black Friday, supported by 99.999% uptime, less than 442 ms latency, and near-flawless transaction processing, 67 merchants grossed more than US$10 million in a single day.
- Checkout.com’s Merchant NPS rose to 63, which is a mark of improved customer satisfaction.
- From a geographic perspective, Checkout.com became the first global player in Japan to possess direct Visa and Mastercard integration, driving 4.15% uplift in acceptance rates and opening a new office in Tokyo.
- Within Saudi Arabia, it expanded domestic processing via Mada and certified direct acquisitions for launch in Q1 2025 in Canada.
- Brazil is in preparation for direct acquisition with Visa, Mastercard, and PIX.
- The company further extended its card payout capability to the U.S., Singapore, and the U.A.E., where it supports instant payouts to Apple Pay wallets for leading merchants and fintechs.
Marketing Channels
(Reference: similarweb.com)
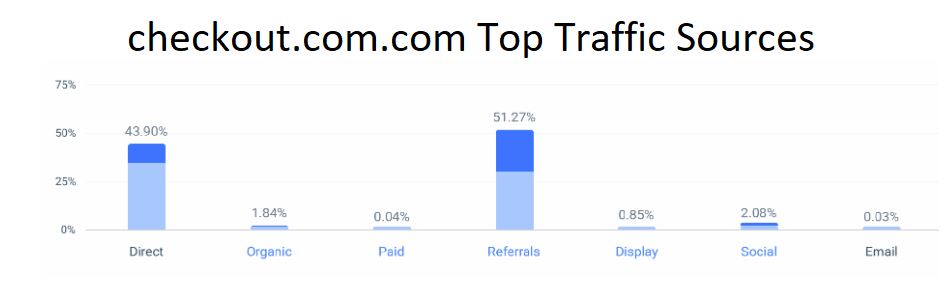
- As per Similarweb, Checkout.com’s statistics state that the company employs several marketing channels to connect with its audience, wherein most of the traffic is generated by referrals, amounting to 51.27%.
- Direct traffic is another large source, constituting 43.90%, which implies a good number of users visiting the platform by keying in the URL directly or using bookmarks.
- Other channels constitute much less, with social at 2.08%, organic search at 1.84%, and display advertising at 0.85%, whereas paid search and email marketing are almost negligible at 0.04% and 0.03%.
- This indicates that Checkout.com mainly thrives on referrals and direct engagement, letting the other channels play a supportive role.
Checkout.com Social Traffic
(Reference: similarweb.com)
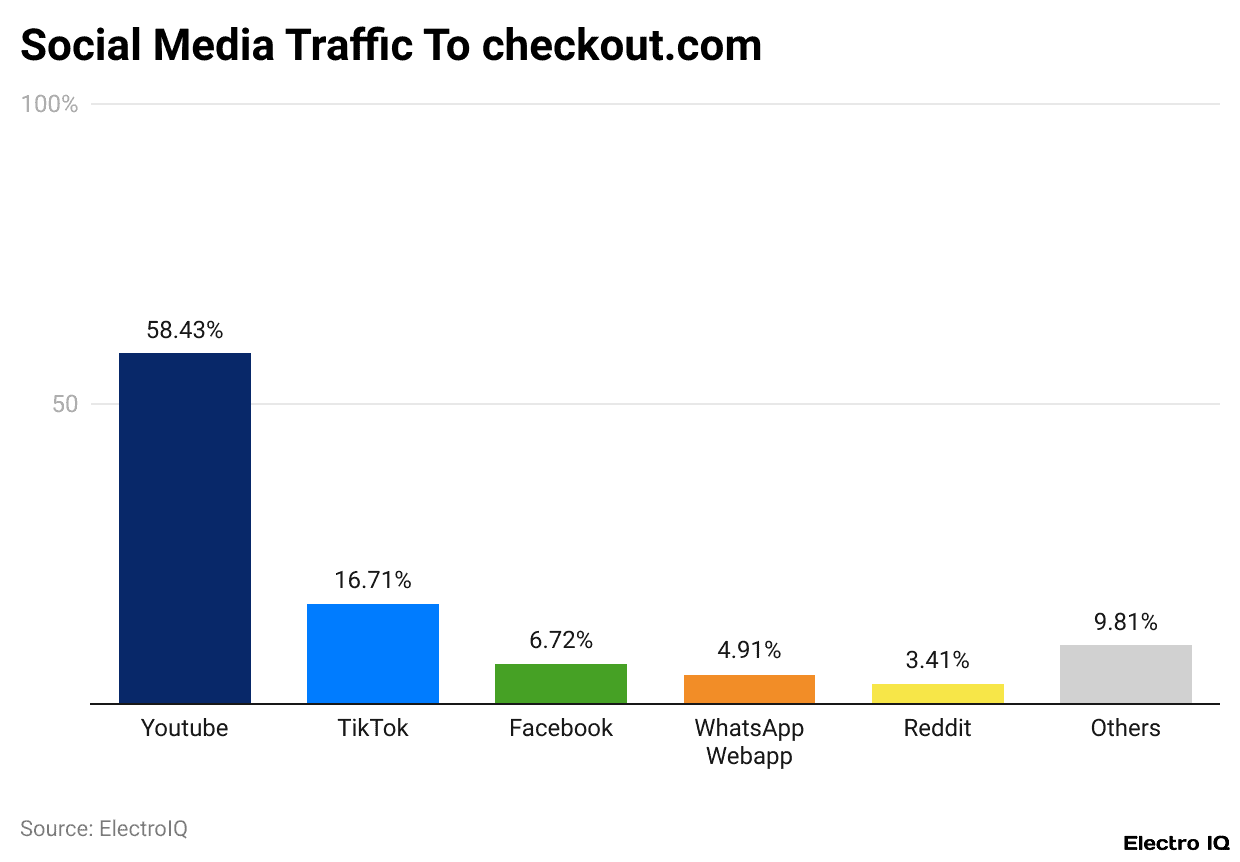
- When it comes to social traffic, YouTube carries the major chunk with 58% of visitors coming in from there.
- TikTok comes next with a share of 16.71%, showing high engagement levels with short videos. Facebook offers 6.72% of the social traffic, while WhatsApp chips in 4.91%, and Reddit shores up 3.41%.
- The remainder of 9.81% is shared by other social channels.
- This array effectively speaks that video-focused sites, particularly YouTube and TikTok, are the best social channels attracting visitors to Checkout.com.
Conclusion
What 2024 is telling us is that a payments platform is growing very fast, expanding coverage, and squeezing more approvals out of data-driven optimisation. The headline metrics—net revenue growth of 40-45%, profitable exit, over 80% volume growth in the U.S., 40+ billion merchants, and peak day availability of 99.999%—are not just vanity statistics.
Combined with measurable product ROI and real uplifts to acceptance, these translate into tangible dollar gains for large merchants in 2024 and position Checkout.com for continued performance-led growth into 2025.
Sources

I hold an MBA in Finance and Marketing, bringing a unique blend of business acumen and creative communication skills. With experience as a content in crafting statistical and research-backed content across multiple domains, including education, technology, product reviews, and company website analytics, I specialize in producing engaging, informative, and SEO-optimized content tailored to diverse audiences. My work bridges technical accuracy with compelling storytelling, helping brands educate, inform, and connect with their target markets.