Christmas Spending Statistics By Seasons, Holiday Shopping and Offline vs Online Retail Sales
Updated · Nov 10, 2025


Table of Contents
- Introduction
- Editor’s Choice
- Christmas Celebration Plan Among Customers
- Christmas Price Index Over The Years
- Average Shopping Duration in The Christmas Season
- Planning Times for Holiday Shopping
- Retail Value of The United States
- Offline vs Online Retail Sales
- Spending Amount During The Holiday Season
- Spending Intent in the Christmas Season
- The Total Amount Planned For The Christmas Holiday
- Parents’ Spending on Christmas Per Child
- Leading Items Customers Expecting Gifts
- Preferred Shopping Website For The Christmas Holiday
- Preferred Retail Consumer in Holiday Gift
- Most Popular Christmas Tree Decorations
- Conclusion
Introduction
Christmas Spending Statistics: The holiday season is a significant economic and cultural phenomenon in the United States, characterized by robust consumer spending, evolving shopping habits, and diverse gift-giving trends. As families and individuals prepare to celebrate Christmas, this comprehensive analysis delves into the intricate landscape of holiday expenditures, revealing fascinating insights into consumer behavior, retail dynamics, and spending patterns.
By reviewing Christmas Spending Statistics, we can understand how Americans approach the festive season. These statistics reflect broader economic trends and personal preferences that shape the annual holiday shopping experience.
Editor’s Choice
- 83% of consumers plan Christmas celebrations
- Christmas price index rose from 20,023.57 in 1984 to 49,263.47 in 2024
- Average holiday shopping duration reduced from 7.1 to 5.8 weeks
- November is the most popular month for holiday shopping planning
- Retail sales value increased from USD 588.18 billion to USD 972.92 billion
- Offline retail sales remain higher than online sales
- The second half of November accounts for 29% of holiday spending
- Consumer spending intentions remain relatively stable
- Average holiday spending increased from USD 1,018 to USD 1,638
- Most parents spend between USD 50-100 per child on gifts
- Money is the most desired gift (54% of respondents)
- Amazon dominates online holiday shopping
- Online-only retailers are most preferred
- Ornaments are the most popular Christmas tree decoration
- Gift cards are expected by 50% of respondents
Christmas Celebration Plan Among Customers
(Reference: statista.com)
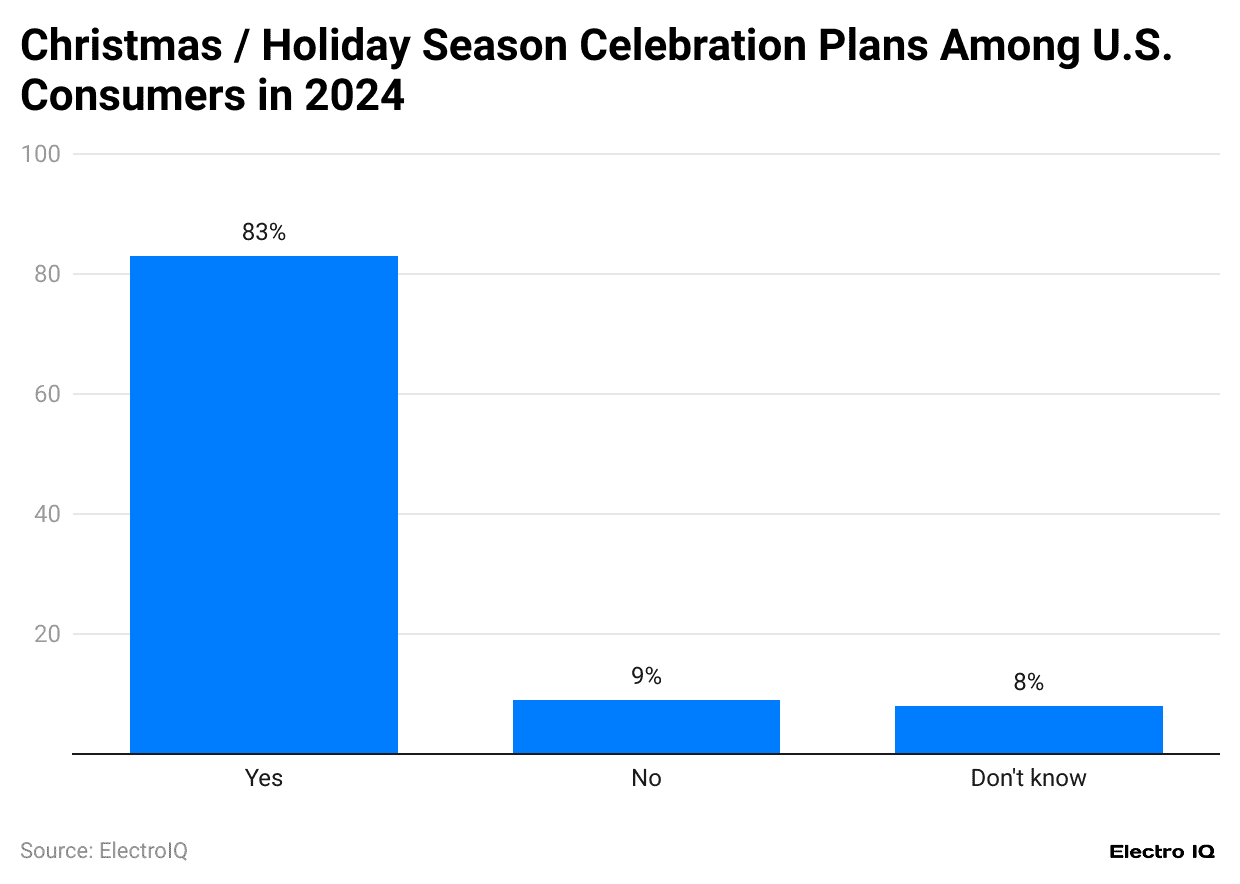
- Christmas Spending Statistics show that 83% of respondents have plans for the Christmas/holiday season.
- 9% of respondents still need plans for the Christmas/holiday season.
- 8% of respondents are undecided about plans for the Christmas/holiday season.
Christmas Price Index Over The Years
 (Reference: statista.com)
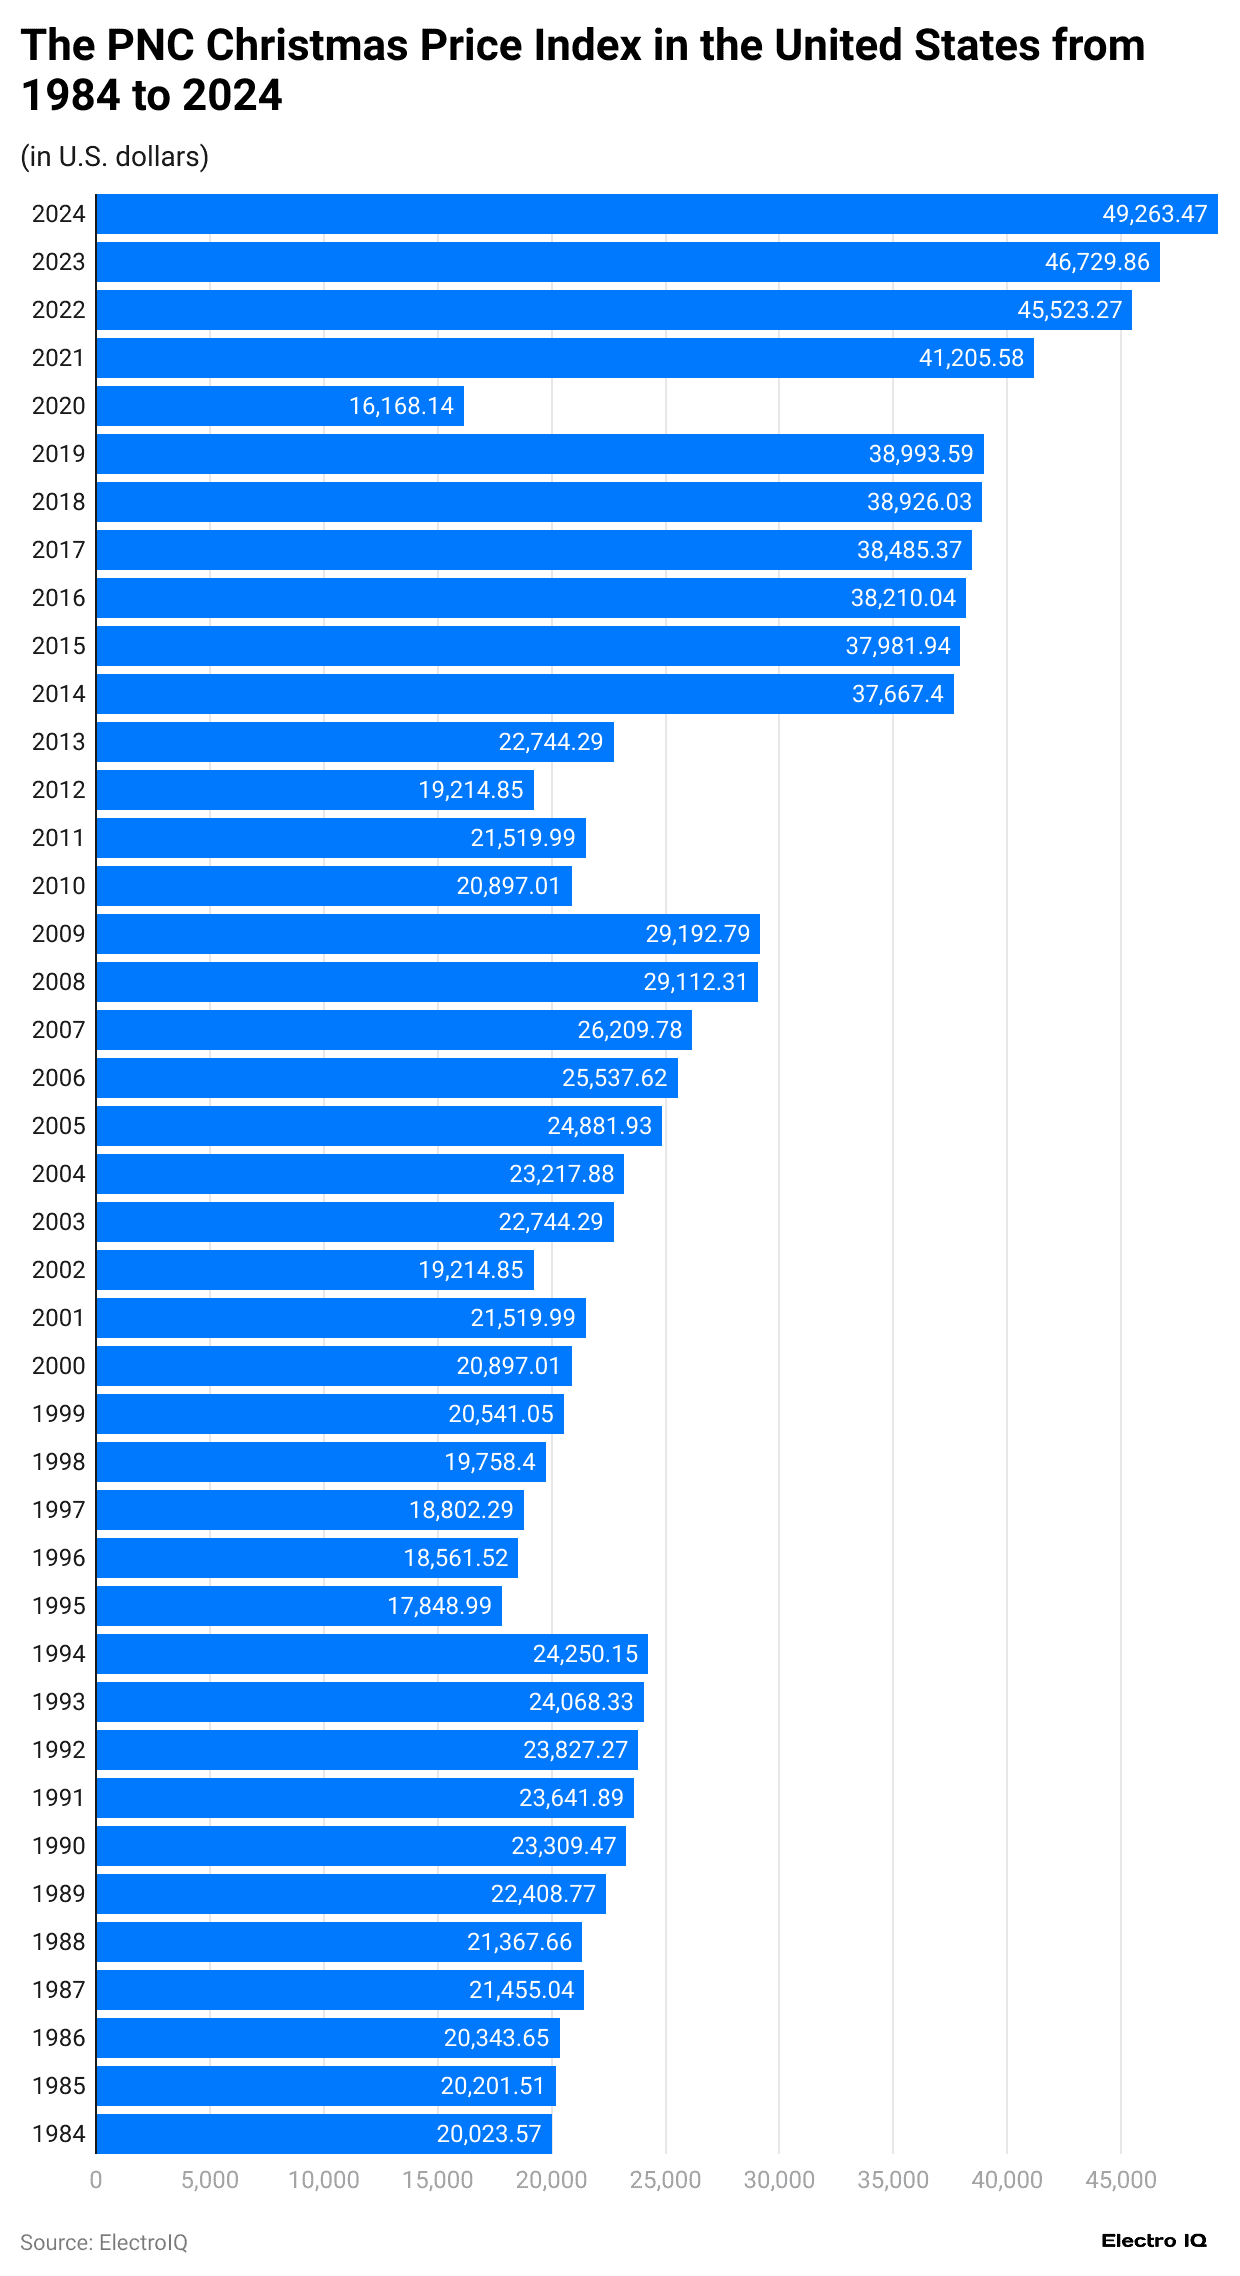
- Christmas Spending Statistics show that the Christmas price index has consistently increased over the past 40 years.
- In 1984, the Christmas price index was 20023.57.
- As of 2024, the Christmas price index became 49263.47.
Average Shopping Duration in The Christmas Season
(Reference: statista.com)
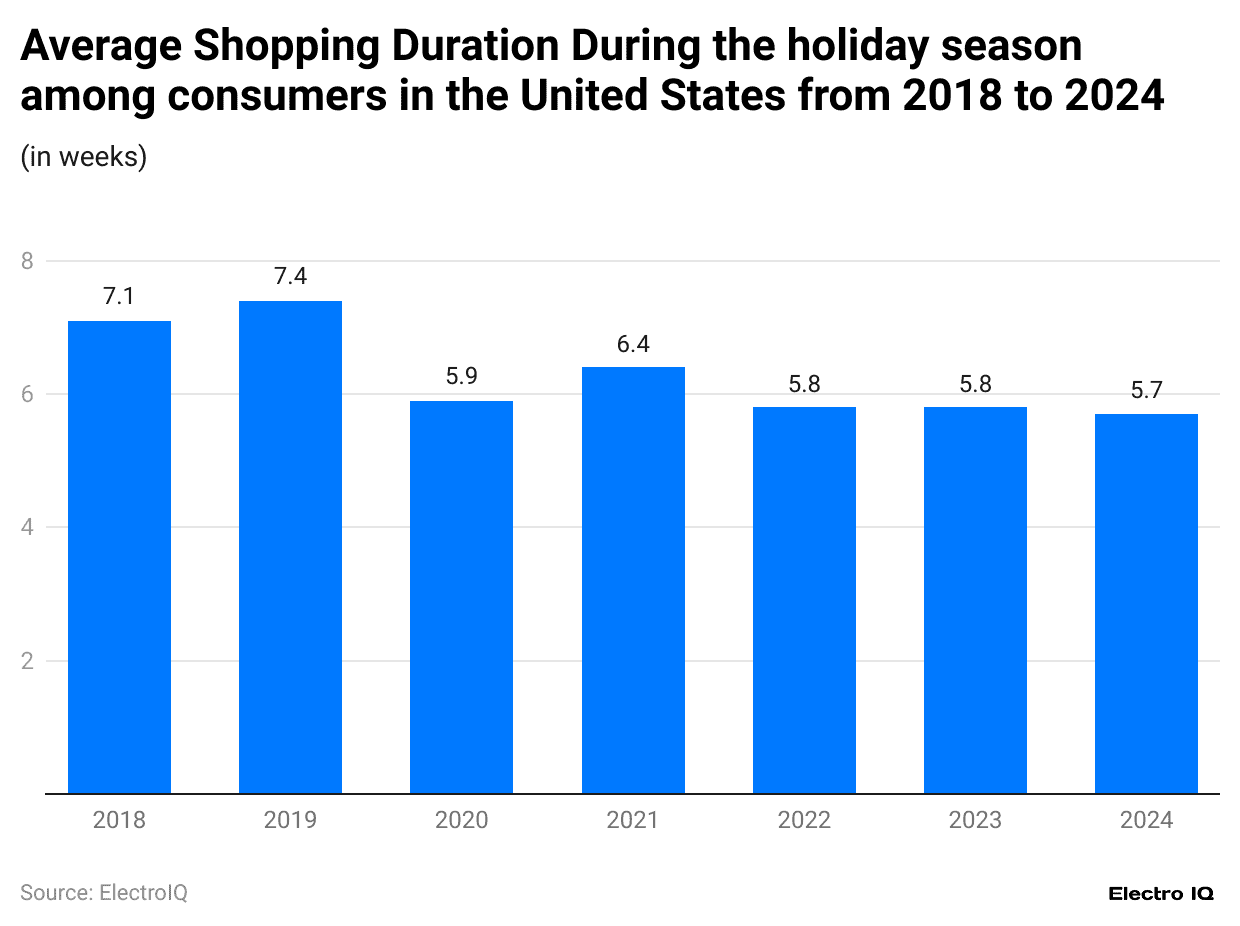
- Christmas Spending Statistics show that consumers’ average shopping duration during the holiday season has reduced over time.
- In 2018, the Christmas spending duration was 7.1 weeks,
- As of 2023, the duration of Christmas spending has become 5.8 weeks
Planning Times for Holiday Shopping
(Reference: statista.com)
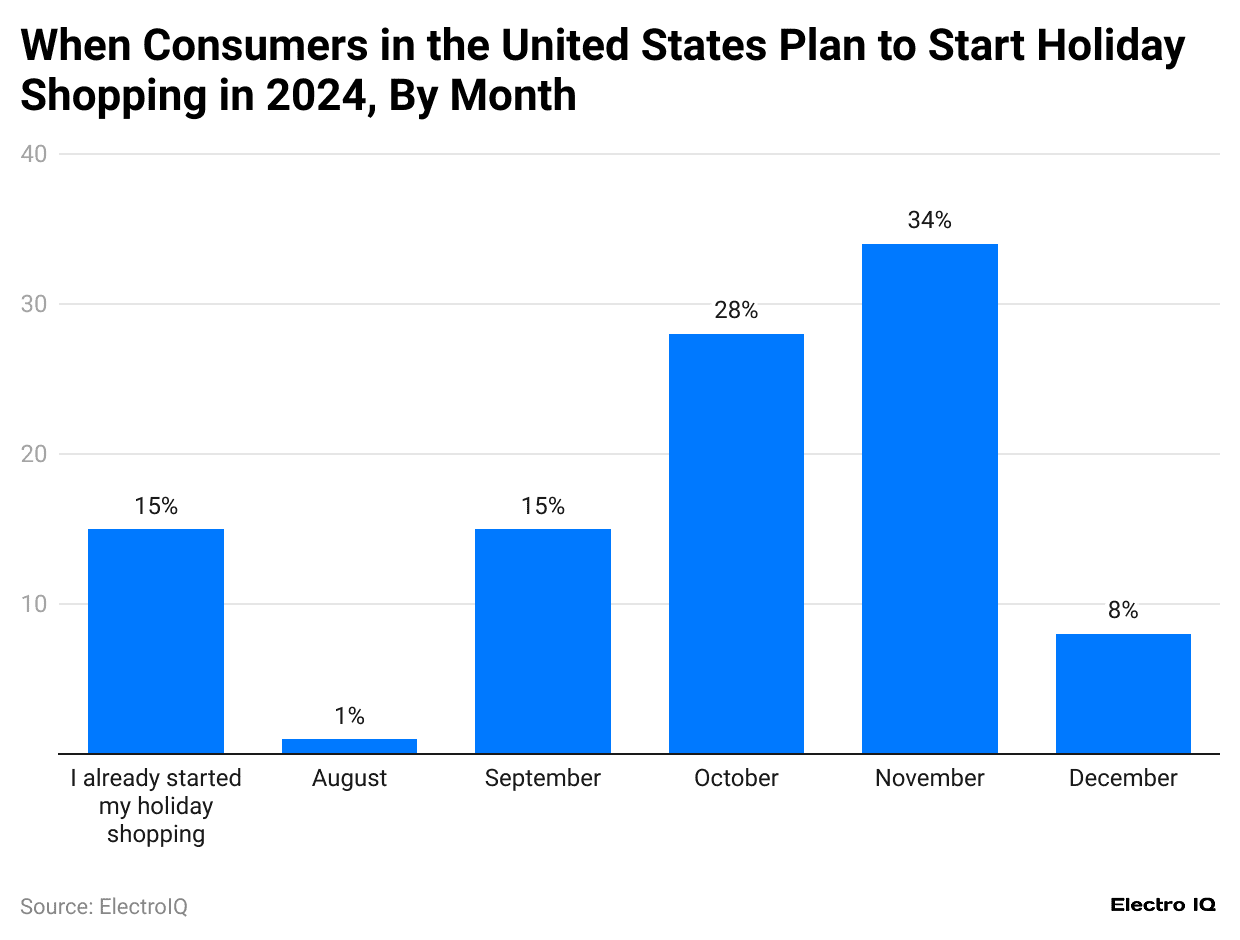
- Christmas Spending Statistics show that, according to 34% of respondents, November is the most frequent month for planning holiday shopping.
- October is the second most frequent month for planning holiday shopping, according to 28% of respondents.
- 15% of respondents had already started their holiday shopping.
- September is another common month for planning holiday shopping, according to 15% of respondents.
- December is less frequent, with 8% of respondents planning to start holiday shopping.
- August is the least frequent month, with only 1% of respondents planning to start holiday shopping.
Retail Value of The United States
(Reference: statista.com)
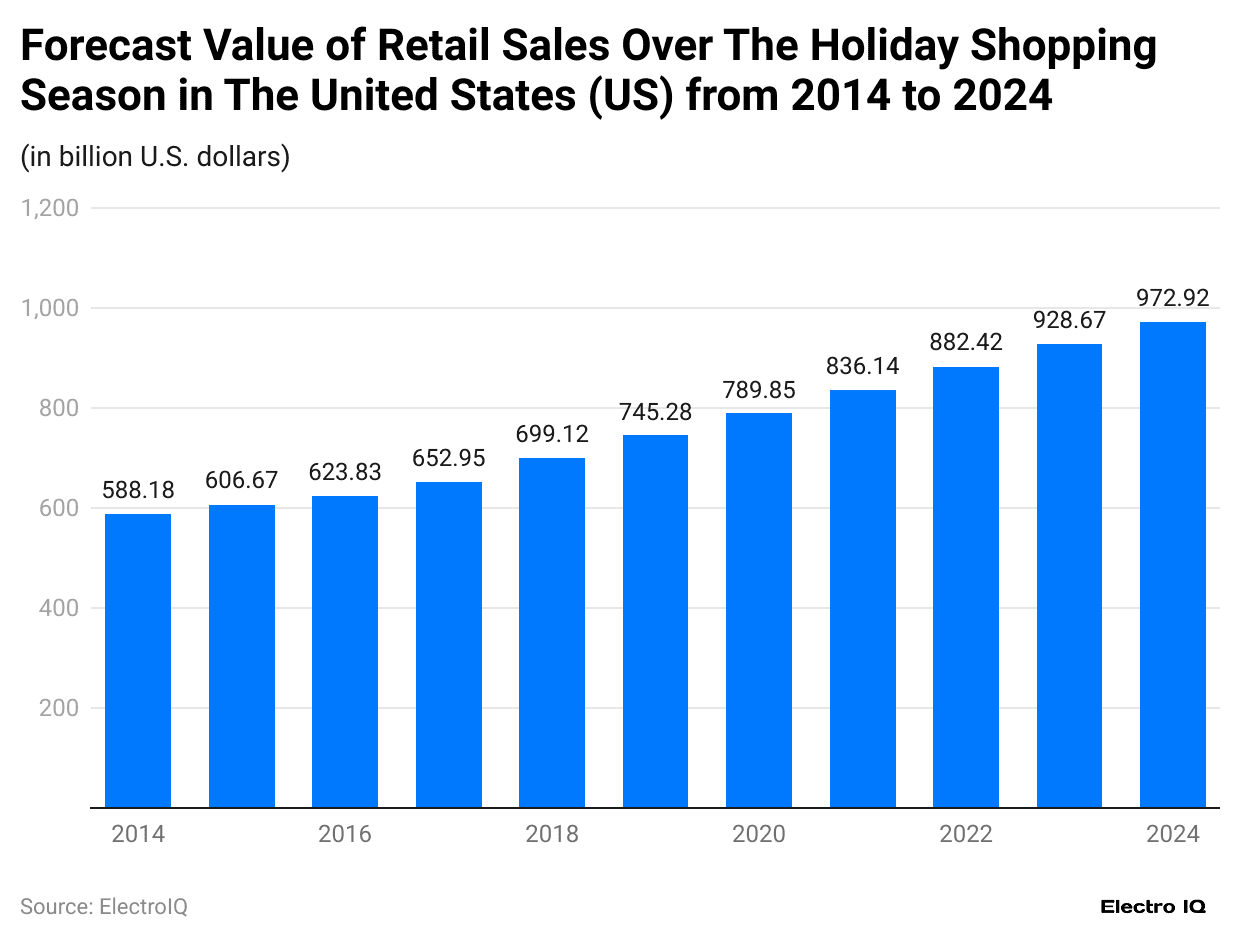
- Christmas Spending Statistics show that the value of retail sales has been increasing consistently over time.
- In 2014, the retail value in the United States was USD 588.18 billion.
- As of 2024, the retail value in the United States is 972.92 billion.
Offline vs Online Retail Sales
(Reference: statista.com)
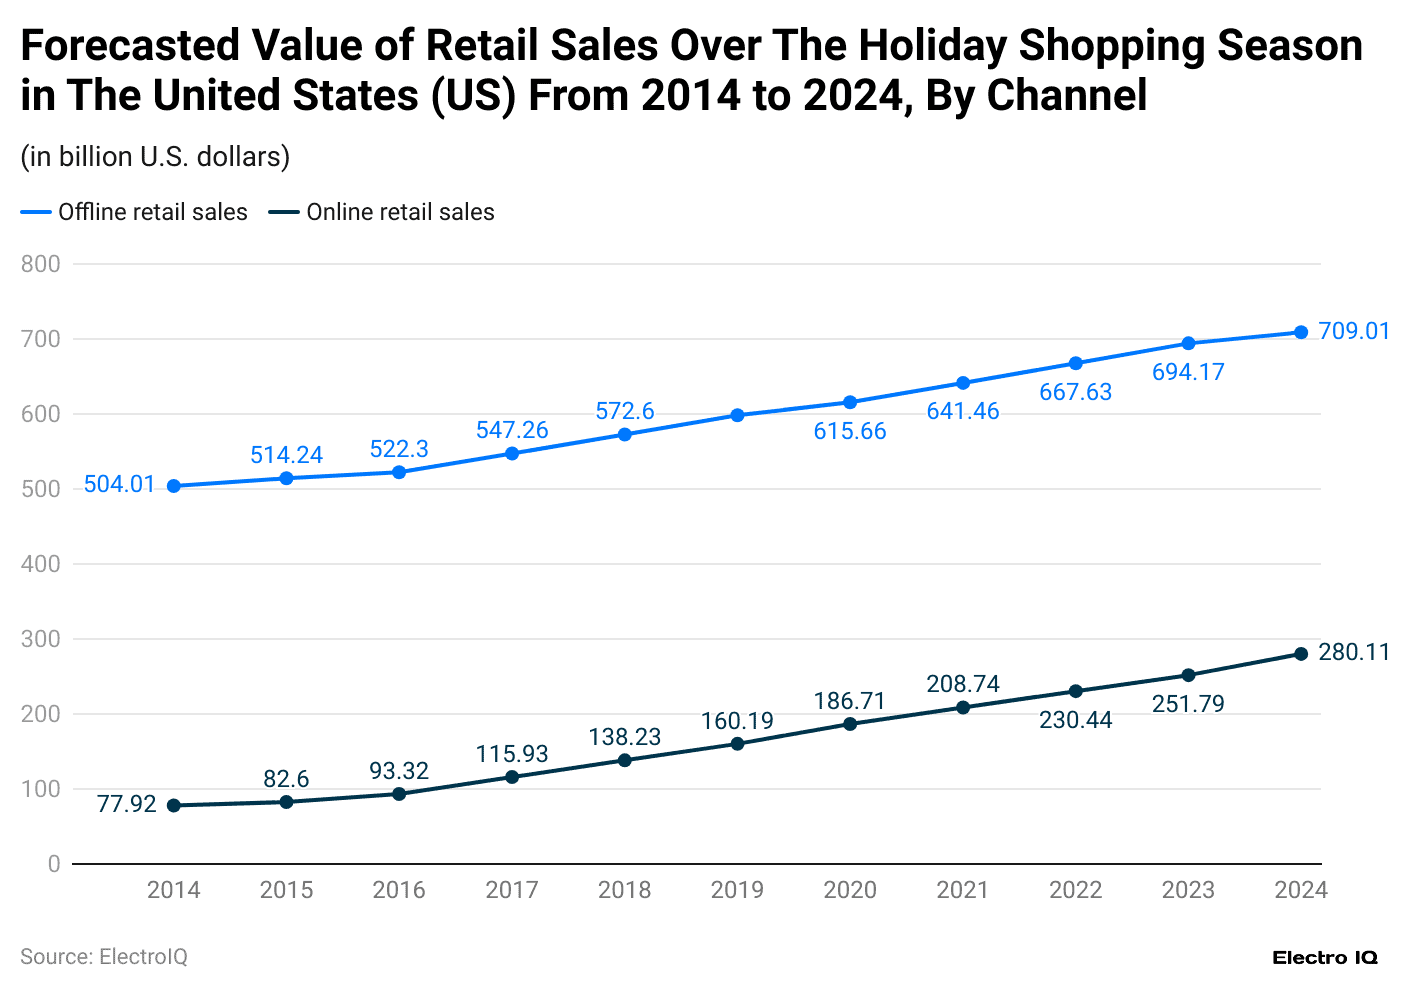
- In 2014, offline retail sales amounted to USD 504.01 billion, significantly surpassing online retail sales, which were USD 77.92 billion.
- By 2023, offline retail sales had increased to USD 694.17 billion, while online retail sales also grew, reaching USD 251.79 billion.
Spending Amount During The Holiday Season
(Reference: statista.com)
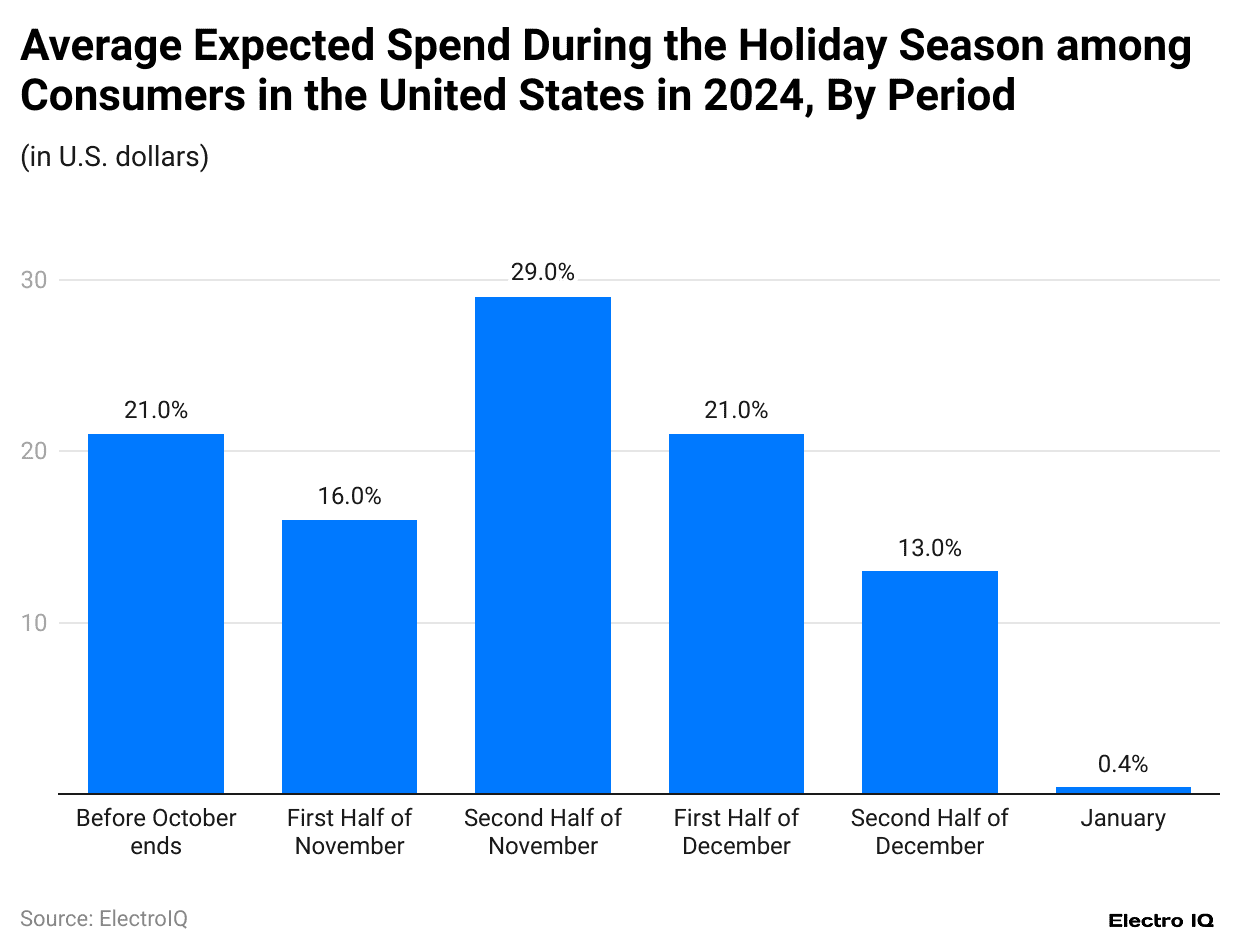
- Christmas Spending Statistics show that the highest spending share was in the second half of November, at 29%.
- The first half of December and before October ended accounted for 21% of spending.
- The first half of November accounted for 16% of spending.
- The second half of December accounted for 13% of spending.
- January accounted for the lowest spending share, at 0.4%.
Spending Intent in the Christmas Season
(Reference: statista.com)
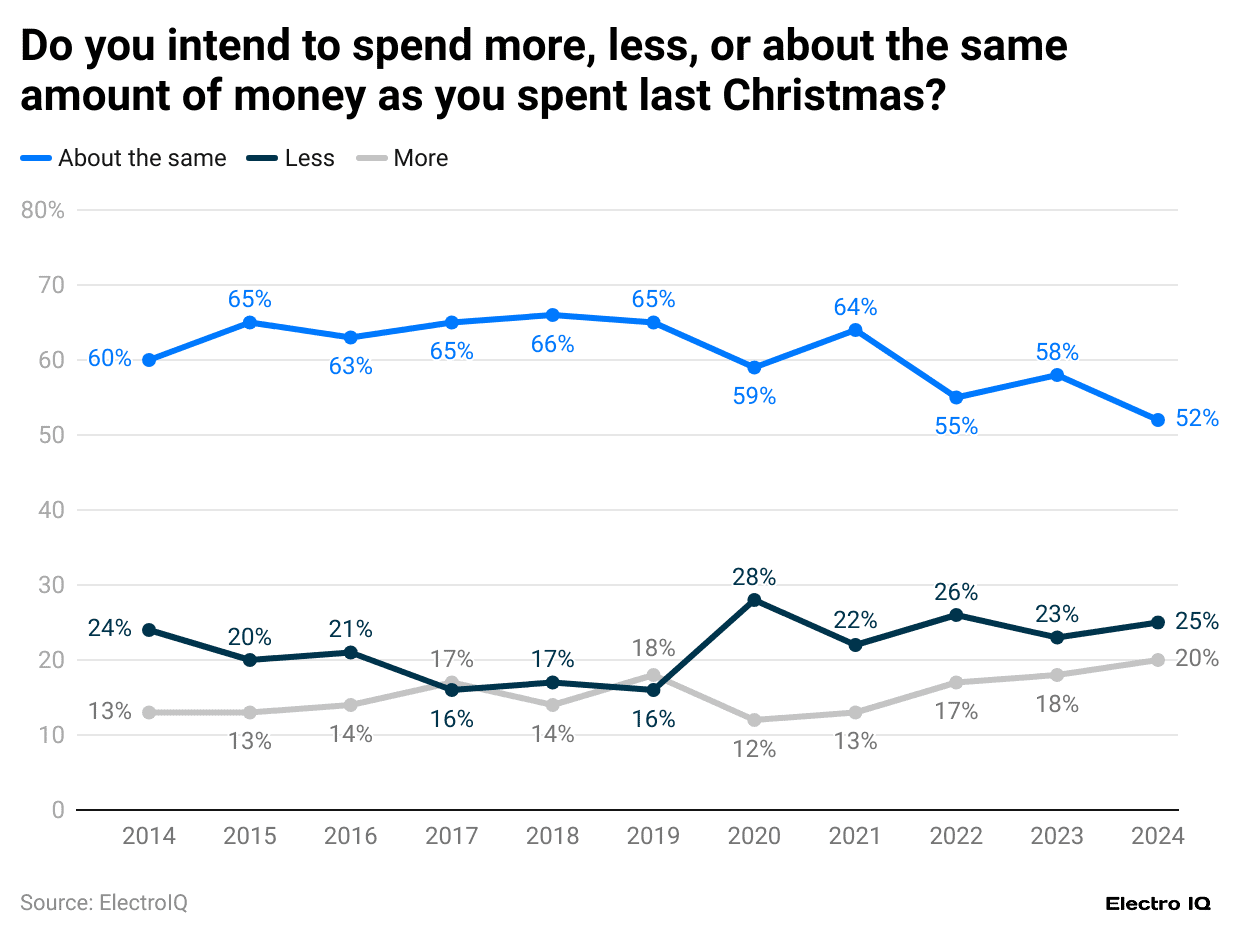
- Christmas Spending Statistics show that, in 2014, 60% of respondents had about the same Christmas spending, 24% of respondents had less spending intention compared to the previous year, and 13%.
- In 2023, 58% of respondents had about the same Christmas spending, 23% of respondents had less spending intention compared to the previous year, and 18% intended to spend more.
The Total Amount Planned For The Christmas Holiday
(Reference: statista.com)
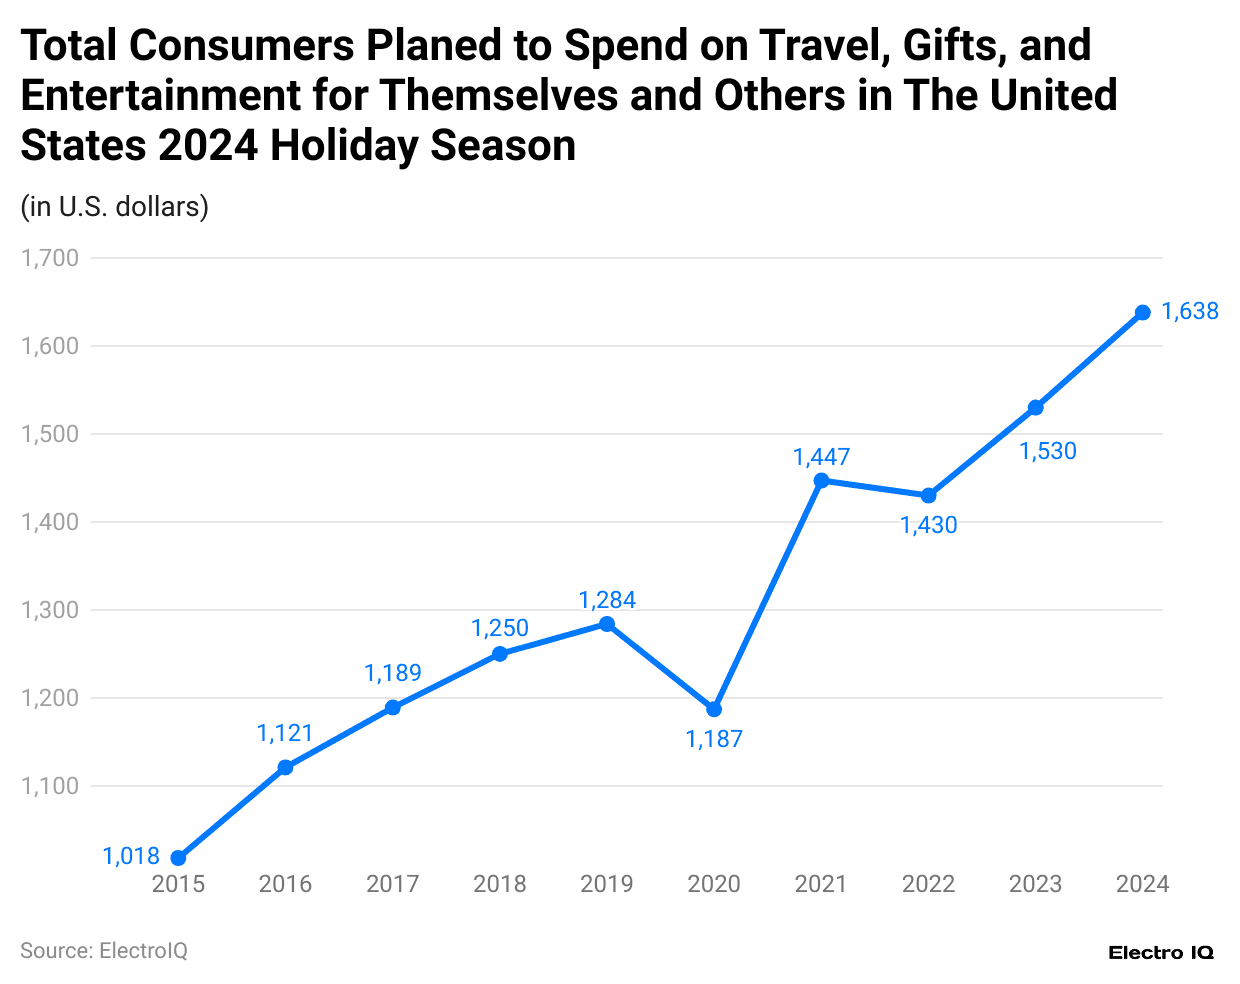
- Christmas Spending Statistics show that the total amount consumers plan to spend consistently increases over time.
- In 2015, the total customer spending planned for the holiday season was USD 1018.
- As of 2023, the customer spending for the holiday season is 1638 USD
Parents’ Spending on Christmas Per Child
(Reference: statista.com)
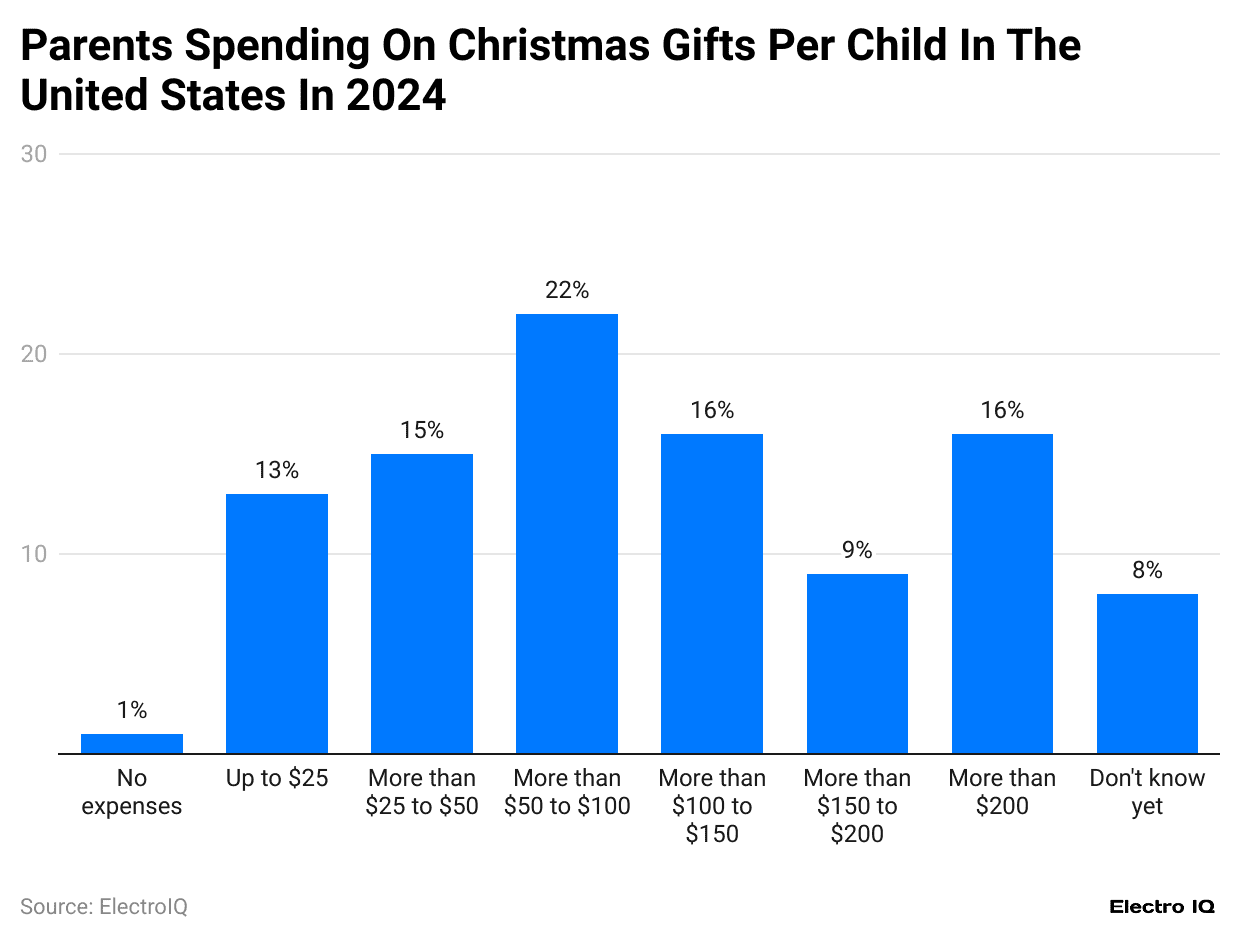
- The highest proportion of respondents, 22%, reported spending between USD 50 and USD 100 per child for Christmas.
- Both spending ranges of USD 100 to USD 150 and USD 150 to USD 200 are reported by 16% of respondents each.
- 15% of respondents spend between USD 25 and USD 50 on each child during Christmas.
- Spending up to USD 25 is reported by 13% of respondents.
- 9% of respondents spend over USD 200 per child for Christmas.
Leading Items Customers Expecting Gifts
(Reference: statista.com)
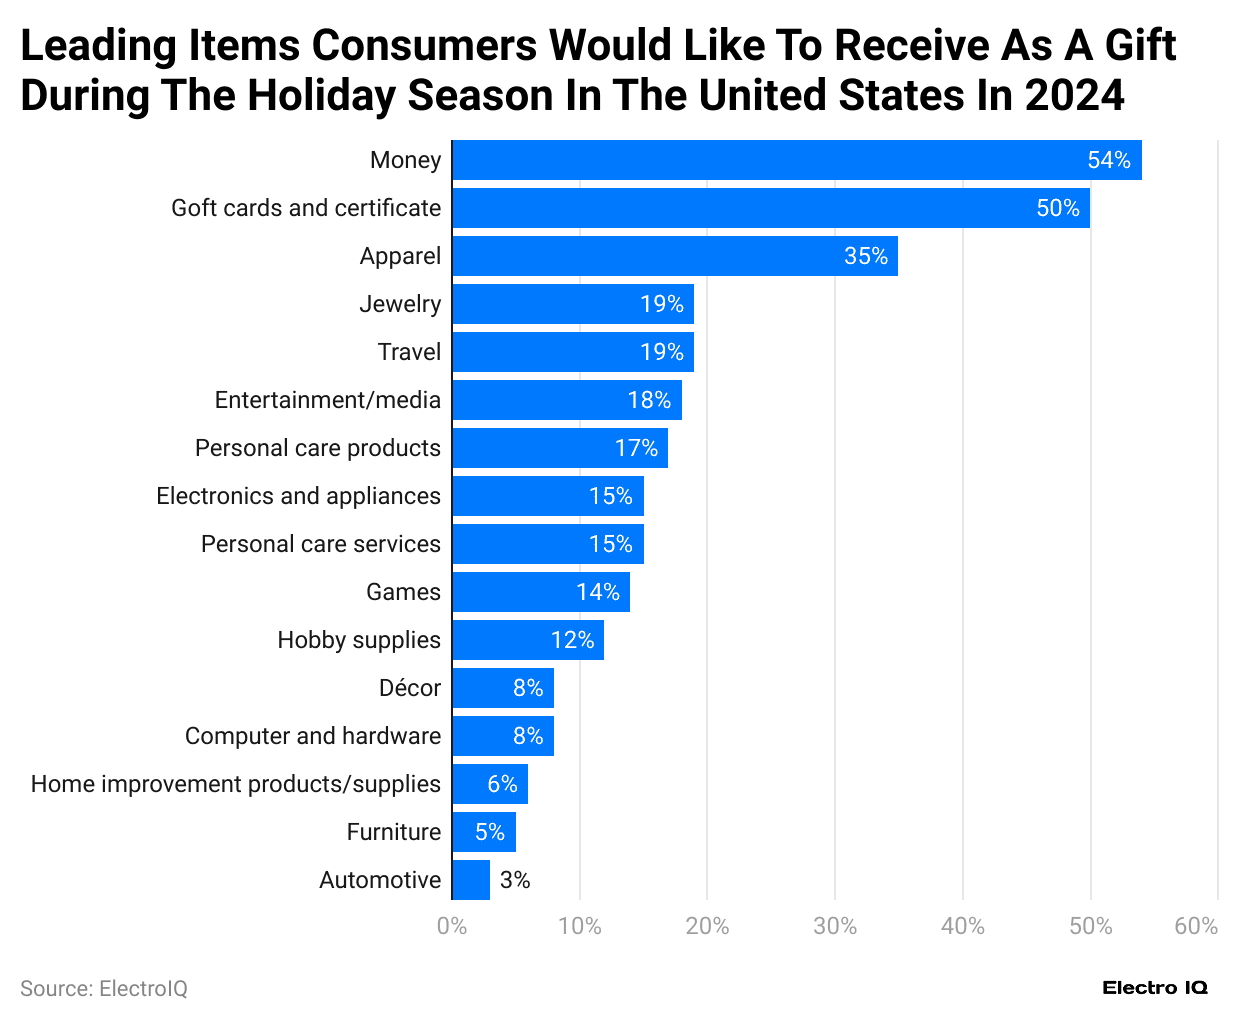
- Money is the leading item expected as a gift by 54% of respondents.
- Gift cards and certificates are anticipated by 50% of respondents.
- Apparel is expected as a gift by 35% of respondents.
- Both jewelry and travel are expected as gifts by 19% of respondents each.
- Entertainment/media is expected as a gift by 18% of respondents.
Preferred Shopping Website For The Christmas Holiday
(Reference: statista.com)
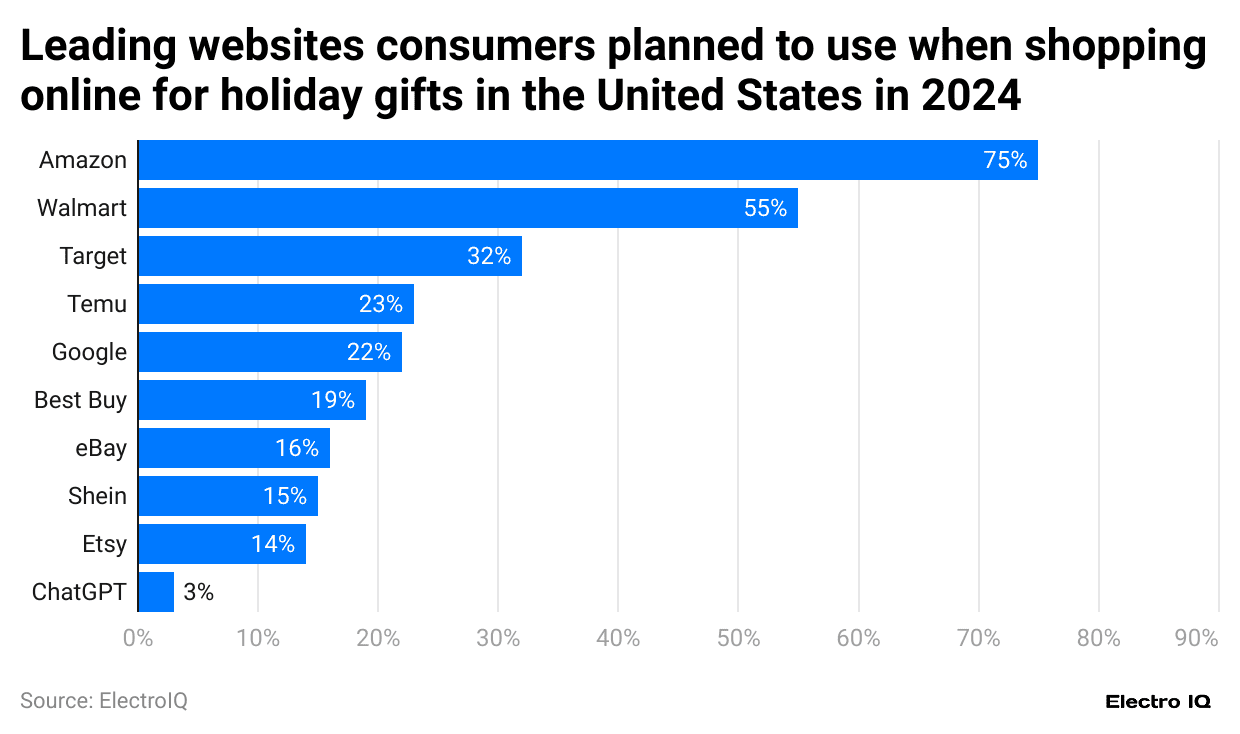
- Amazon is the top preferred online shopping website for the Christmas holiday, as indicated by 75% of respondents.
- Walmart ranks second with 55% of respondents preferring it.
- Target is chosen by 32% of respondents, placing it third.
- Temu is the fourth choice, preferred by 23% of respondents.
- Google follows as the fifth preferred site, with 22% of respondents selecting it.
- Best Buy is the sixth most preferred, with 19% of respondents favoring it for their Christmas shopping.
Preferred Retail Consumer in Holiday Gift
(Reference: statista.com)
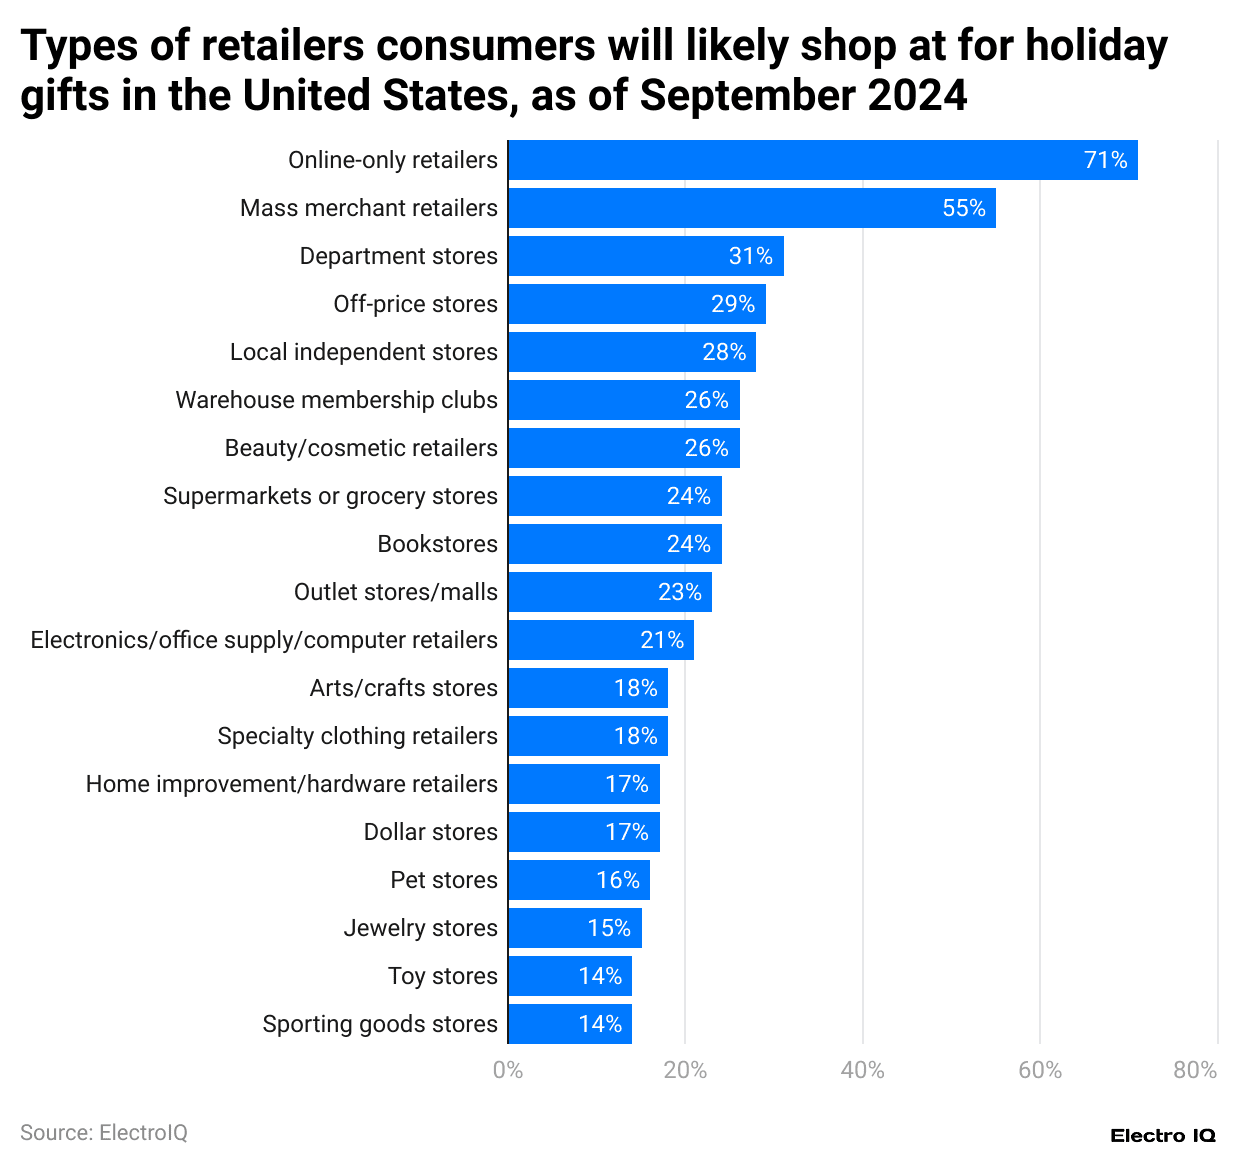
- Christmas Spending Statistics show that 71% of respondents prefer online-only retailers as their retail choice.
- Mass merchant retailers are the second most preferred, with 55% of respondents.
- Department stores are preferred by 31% of respondents.
- Off-price stores are preferred by 29% of respondents.
- Local independent stores are preferred by 28% of respondents.
- Warehouse membership clubs and beauty/cosmetic retailers are each preferred by 26% of respondents.
Most Popular Christmas Tree Decorations
(Reference: statista.com)
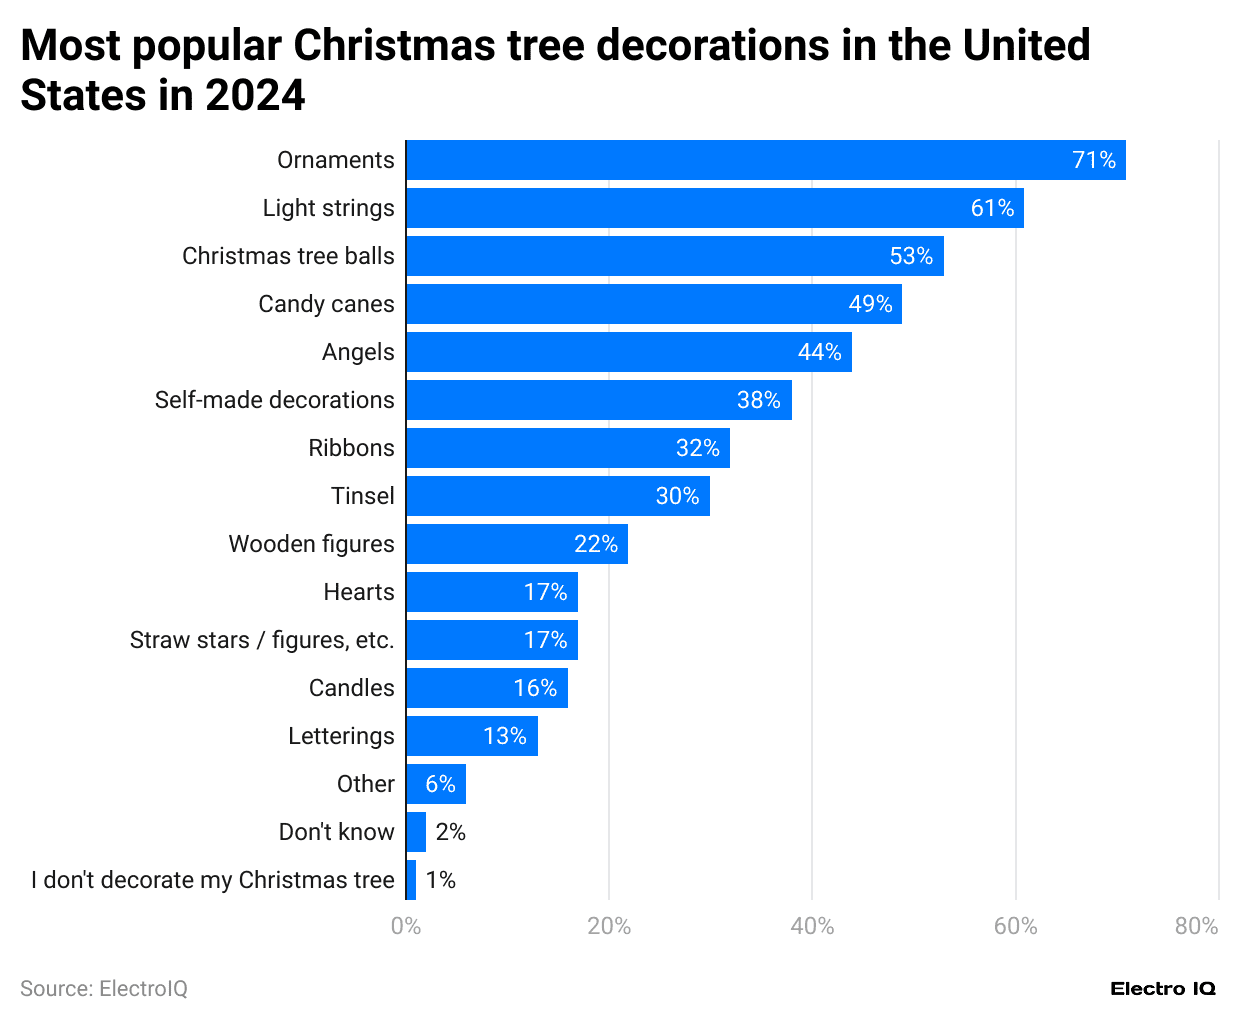
- Christmas Spending Statistics show that ornaments are the most preferred Christmas tree decoration, according to 71% of respondents.
- Light strings are the second most preferred Christmas tree decoration, according to 61% of respondents.
- Christmas tree balls are the third most preferred Christmas tree decoration, according to 53% of respondents.
- Candy canes are the fourth most preferred Christmas tree decoration, according to 49% of respondents.
- Angels are the fifth most preferred Christmas tree decoration, according to 44% of respondents.
- Self-made decorations are the sixth most preferred Christmas tree decoration, according to 38% of respondents.
Conclusion
The Christmas Spending Statistics reveal a dynamic and evolving landscape of consumer behavior during the holiday season. While core spending patterns remain relatively consistent, significant shifts are observable in shopping channels, duration, and preferences.
Online retail continues to gain ground, challenging traditional offline shopping models, yet brick-and-mortar stores maintain their prominence. Consumer spending has shown steady growth, reflecting economic resilience and the cultural significance of holiday gift-giving.
As technology, economic conditions, and cultural norms evolve, the holiday spending landscape will undoubtedly undergo further transformation, making continuous research and analysis crucial for understanding consumer dynamics.
Sources
FAQ.
Most people begin planning their holiday shopping in November.
Parents typically spend USD 50-100 per child on Christmas gifts.
Amazon, Walmart, and Target are the top preferred websites for holiday shopping.
Money is the most expected gift, closely followed by gift cards.
Retail sales have increased significantly, from USD 588.18 billion in 2014 to USD 972.92 billion in 2024.
While offline retail sales remain higher, online sales continue to grow rapidly.
The second half of November accounts for 29% of holiday spending.
The most popular decorations include ornaments, light strings, and Christmas tree balls.
Most consumers maintain consistent spending levels year-over-year.
Consumers favour online-only retailers and mass merchant retailers for holiday shopping.

Maitrayee Dey has a background in Electrical Engineering and has worked in various technical roles before transitioning to writing. Specializing in technology and Artificial Intelligence, she has served as an Academic Research Analyst and Freelance Writer, particularly focusing on education and healthcare in Australia. Maitrayee's lifelong passions for writing and painting led her to pursue a full-time writing career. She is also the creator of a cooking YouTube channel, where she shares her culinary adventures. At Smartphone Thoughts, Maitrayee brings her expertise in technology to provide in-depth smartphone reviews and app-related statistics, making complex topics easy to understand for all readers.


