Online Church Statistics By Virtual Worship Users, Websites, Virtual Services And Christian Group
Updated · Dec 02, 2024

Table of Contents
- Introduction
- Editor’s Choice
- Websites for Religious Sculpture Reading
- Satisfaction With Virtual Services
- Online vs Real Sermons
- Description of Ministry Online
- Preference for Religious Services
- Christian Group Using Online Church
- Religious Service Tendency
- Online Prayer Functions
- Adults Using Religious Technology
- Users Blocking Religious Content
- Virtual Worship Users
- Reasons for Avoiding in-Person Services
- Conclusion
Introduction
Online Church Statistics: The online church refers to different methods and other Christian cult groups mostly focus on using a convenient medium to spread religious teachings. Reviewing the Online Church Statistics and garnering essential information about the spiritual experience and its effectiveness would be interesting.
Furthermore, by going through such information, it would be possible to gain crucial aspects that have enabled such websites to become a hotspot for religious experience in a brand new fashion. Also, as religious followers are very diverse, one will be able to understand its intricacies.
Editor’s Choice
- 30% of respondents use online platforms for Christian information gathering.
- 74% of virtual viewers report high satisfaction with online sermons.
- 48% of Black adults regularly watch religious services online or on TV.
- 36% of respondents were from online campuses supporting virtual churches.
- 21% of users utilize mobile apps for scripture reading.
- 65% feel stronger connections in person versus 22% online.
- 60% of virtual viewers stay loyal to one congregation.
- 20% of respondents are light users of religious technology.
- 73% of Protestants report satisfaction with virtual services.
- 54% of respondents do not use religious technology at all.
- 15% regularly listen to religious podcasts.
- 20% cite COVID-19 concerns for avoiding in-person services.
- 77% of Evangelicals express satisfaction with virtual church services.
- 36% of Atheists have blocked religious content online.
- 57% don’t attend services either virtually or in person.
Websites for Religious Sculpture Reading
(Reference: pewresearch.org)
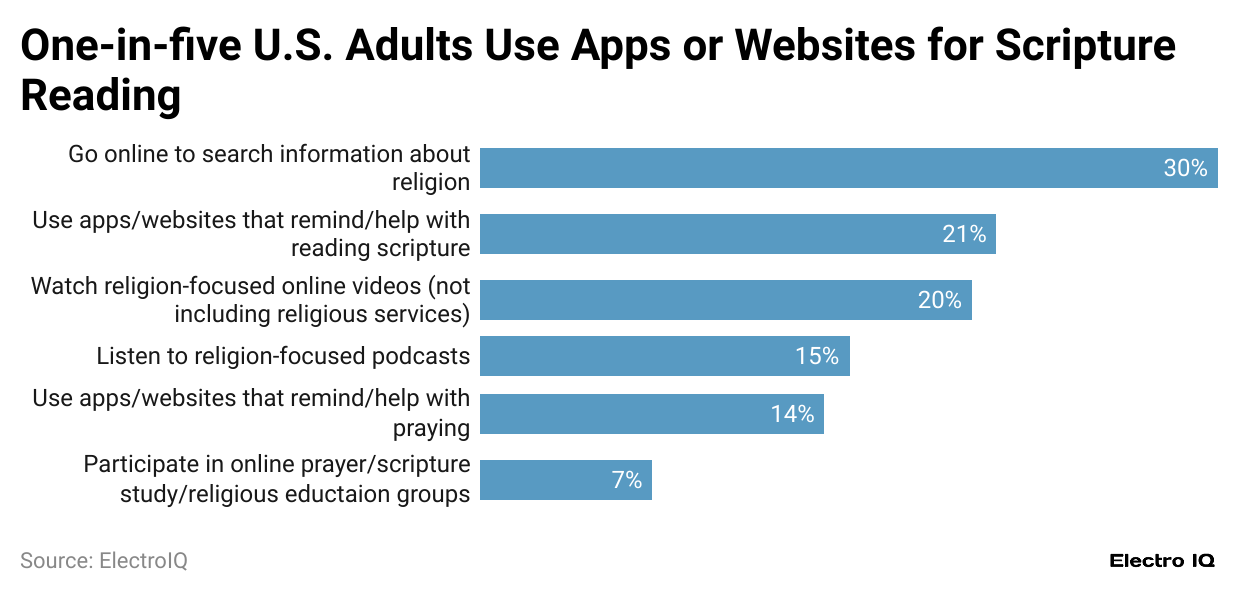
- Online Church Statistics: 30% of respondents go online to garner information about Christianity.
- Meanwhile, 21% of them use mobile apps that remind them to read scriptures.
- 20% of respondents’ main source uses religion-based online videos to garner information about their religion.
- 15% of respondents are regular listeners of religion-based podcasts.
- 7% of respondents are regular participants in online prayer and scripture reading groups.
Additional Points:
- 27% of Americans regularly watch religious services on screens, including 10% who exclusively watch virtually and 17% who both watch virtually and attend in person.
- 16% of U.S. adults attend religious services only in person, while 57% do not attend in-person or virtually.
- 76% of dual attendees (those who watch virtually and attend in person) prefer in-person services, while 11% prefer virtual services, and 14% have no preference.
Satisfaction With Virtual Services

(Reference: pewresearch.org)
- Online Church Statistics show that 68% of respondents are satisfied with the sermons at the services.
- 67% of respondents are happy with the services offered in general.
- 54% of the respondents enjoy the music used at the services.
Additional Information
- 43% of virtual viewers cite convenience as the top reason for watching religious services online or on TV.
- 74% of virtual viewers are either extremely or very satisfied with sermons during virtual services, while 69% of in-person attendees report satisfaction with in-person sermons.
- 65% of in-person attendees feel a strong connection with fellow attendees, compared to only 28% of virtual viewers.
Online vs Real Sermons
(Reference: pewresearch.org)
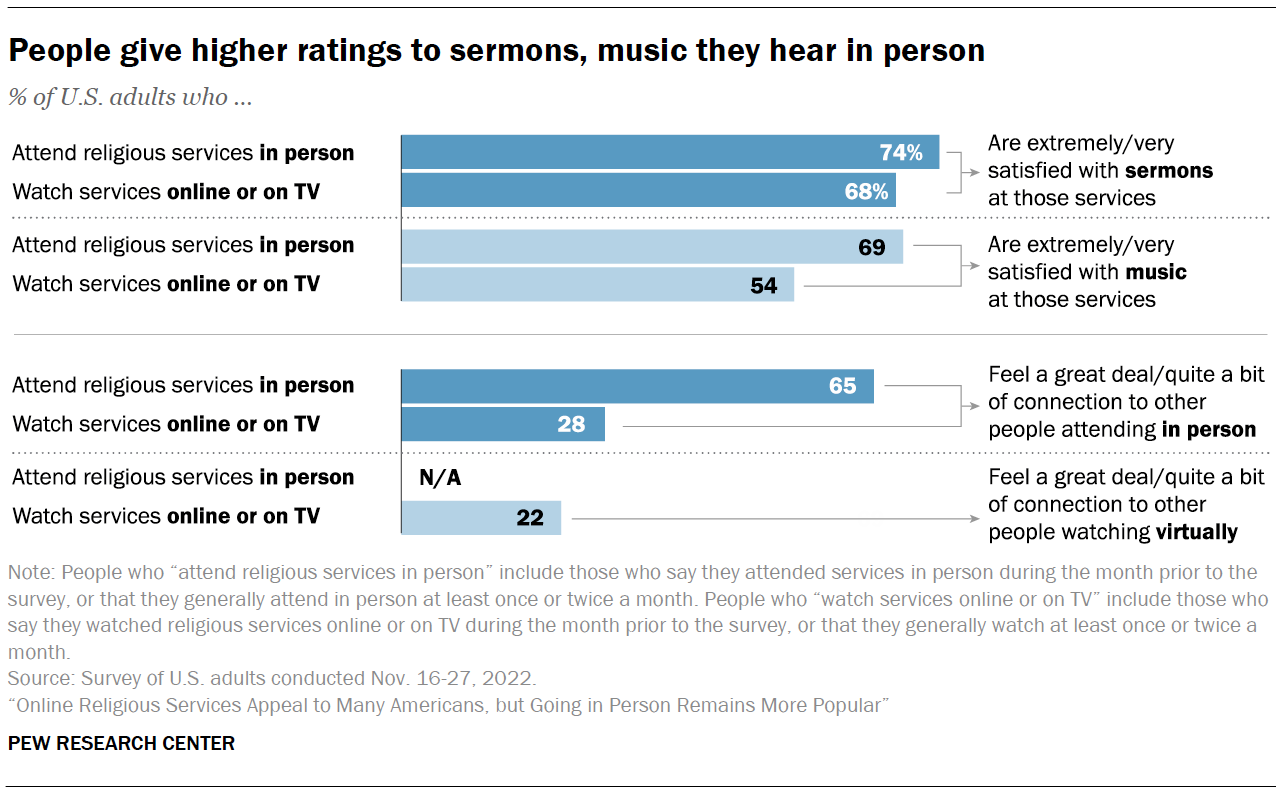
- Online Church Statistics show that 74% of respondents are satisfied with religious services in person.
- 68% of users watch religious services either online or on TV.
- 69% of users, in contrast, attend religious services in person.
- 54% of users tend to watch services either online or on TV.
- 65% of respondents who watch religious services in person find a great connection compared to others watching online.
- 22% of respondents prefer to watch online services and feel a great deal of connection among users who like to watch virtually.
Description of Ministry Online
(Source: hubspot.net)
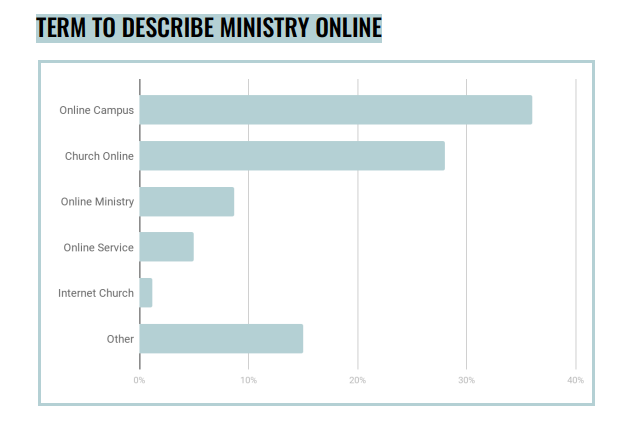
- Online Church Statistics show that 36% of respondents were from online campuses and were supporters of online churches.
- 28% of respondents who attend church online.
- 8% are from church online ministry.
- The remaining 15% of users have been supporting online church practices in some form or another.
Preference for Religious Services
(Source: pewresearch.org)
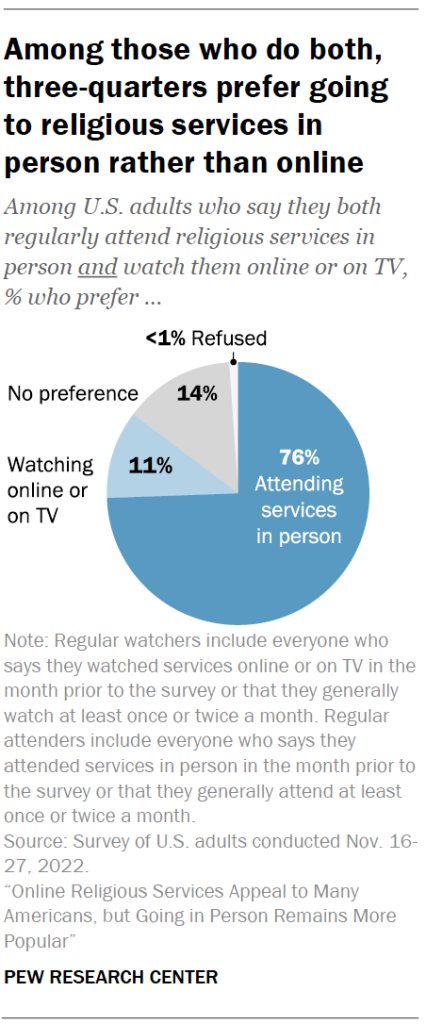
- Online Church Statistics show that 76% of respondents prefer to attend religious services in person.
- 14% of respondents have no preference for watching prayers.
- 11% of respondents have a preference for watching online sermons online or on television.
- As a minority, 1% of respondents refused to answer their preferences.
Christian Group Using Online Church
(Source: pewresearch.org)
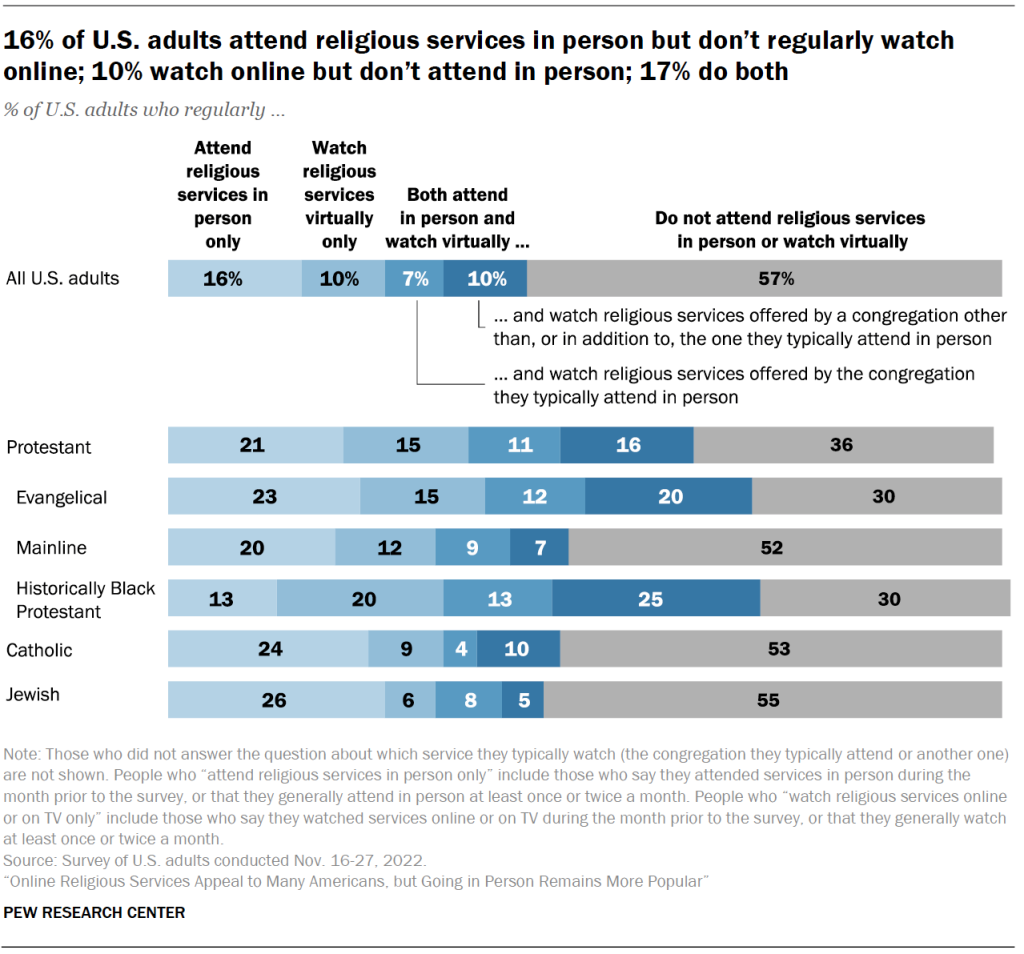
- Online Church Statistics show that among all US adults, 16% of respondents prefer to attend services in person only, and most users don’t attend services in person or virtually.
- 36% of protestant participants don’t attend religious services virtually, and 21% prefer to participate in person.
- 30% of Evangelical participants don’t attend religious services virtually, and 23% prefer to participate in person.
- 52% of Mainline participants don’t attend religious services virtually, and 20% prefer to participate in person.
- 30% of Historically Black Protestant participants don’t attend religious services virtually, and 13% prefer to participate in person.
- 53% of Catholic participants don’t attend religious services virtually, and 24% prefer to participate in person.
- 55% of Jewish participants don’t attend religious services virtually, and 26% prefer to participate in person.
Religious Service Tendency
(Source: pewresearch.org)
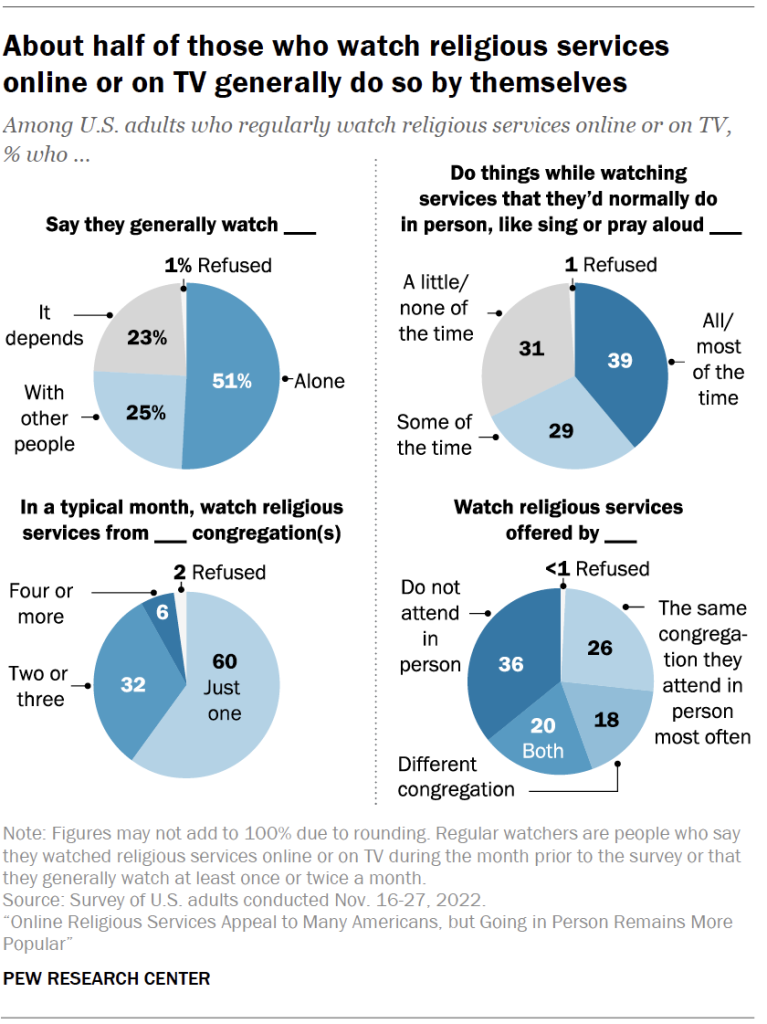
- Online Church Statistics show that 51% of respondents watch religious services alone.
- Preference for religious services from the congregation is 39% among users.
- 60% of respondents prefer to watch religious congregations just once.
- 26% of respondents watch religious services in person by the same congregation they attend.
Online Prayer Functions
(Reference: pewresearch.org)
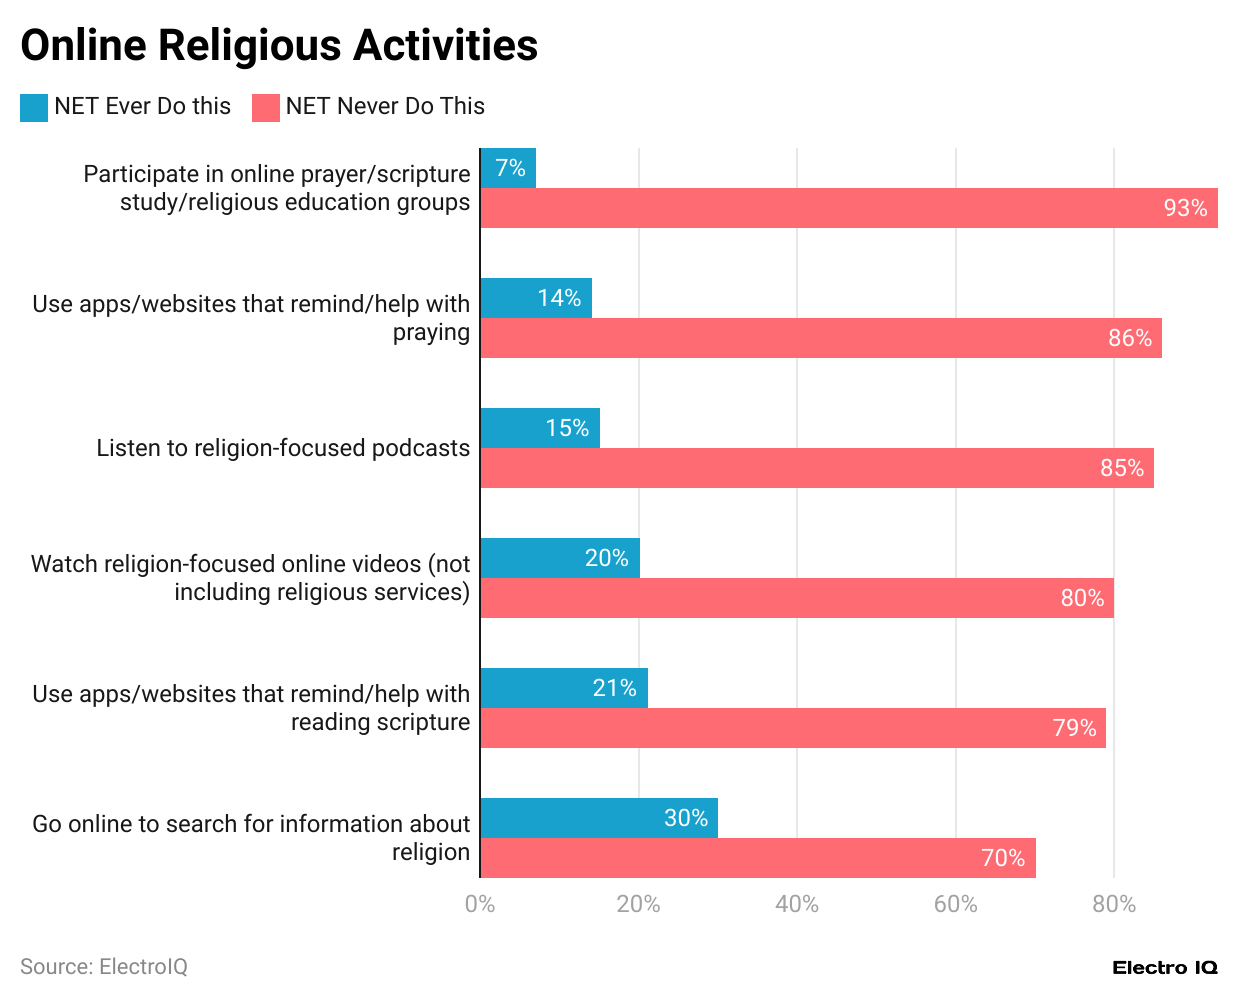
- Online Church Statistics show that 93% of respondents never participate in online prayer activities, but 7% do.
- 79% of respondents never use apps/websites to read scripture, but 21% do.
- 80% of respondents never watch religion-focused online videos, but 20% do.
- 85% of respondents never listen to religion-focused podcasts, but 15% do.
- 86% of respondents never use apps/websites to help with praying, but 14% do.
- 93% of respondents never participate in online prayer activities, but 7% do.
Adults Using Religious Technology

(Reference: pewresearch.org)
- Online Church Statistics show that 54% of respondents do not use religious technology.
- 20% of respondents are light users of religious technology.
- 16% of users have applied religious technology with high intensity.
- Only 10% of respondents are moderate users.
Additional information
- 60% of virtual viewers watch services from one house of worship, while 32% watch services from two to three congregations.
- 48% of Black adults regularly watch religious services online or on TV, compared to 30% of Hispanic adults and 22% of White adults.
- Among highly religious Americans, 54% of Black adults are heavy users of spiritual technology, compared to 38% of White adults.
Users Blocking Religious Content
(Reference: pewresearch.org)
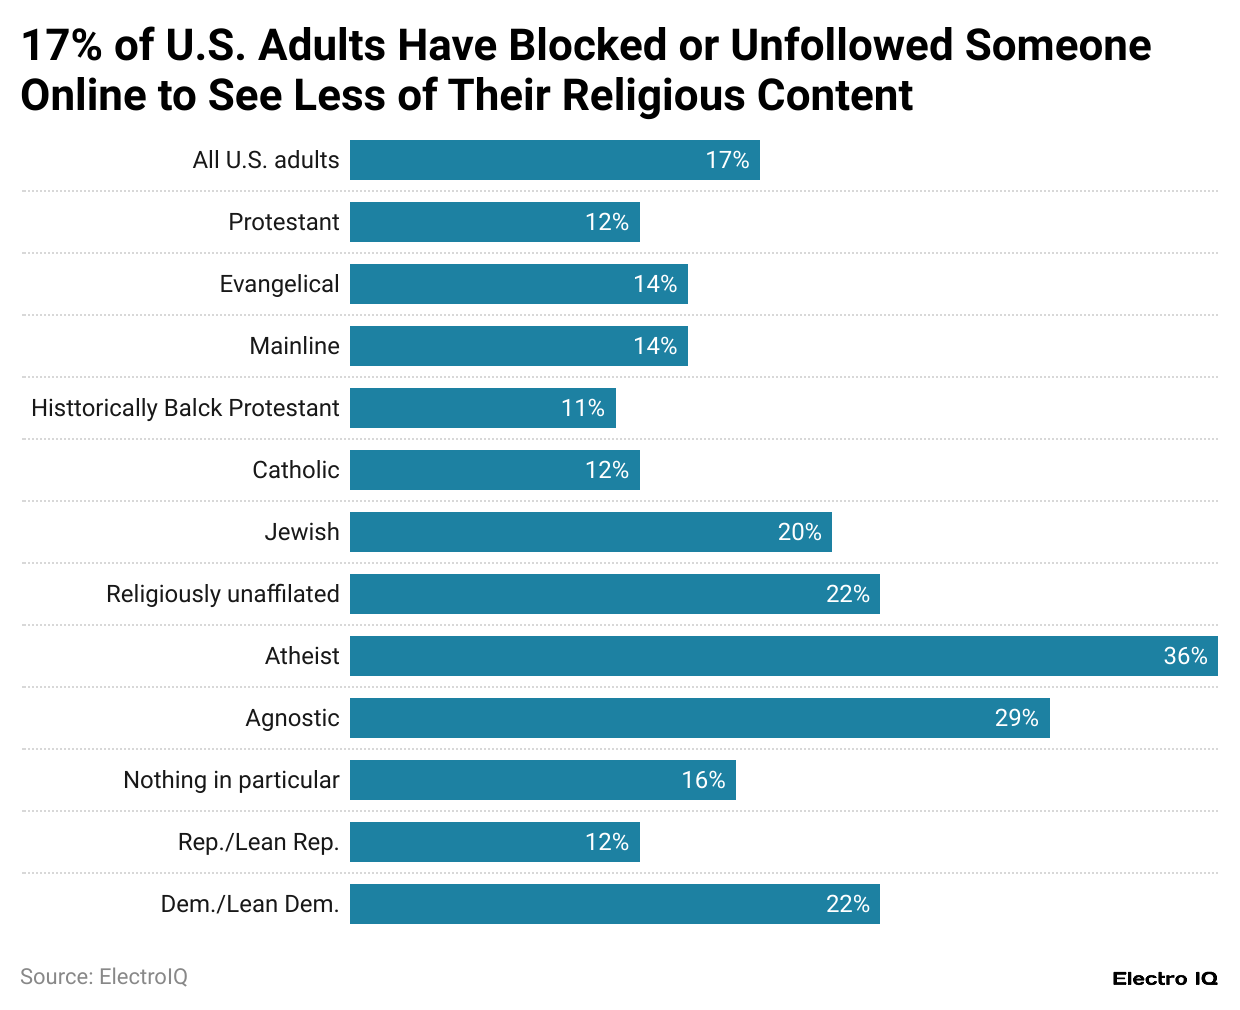
- Online Church Statistics show that 17% of respondents are all US citizens who have blocked posts to see religious content.
- 13% of Protestants have blocked posts that contain religious content.
- 36% of Atheists have blocked posts that contain religious content.
- 29% of Agnostics have blocked posts that contain religious content.
- 22% of Religiously unaffiliated individuals have blocked posts that contain religious content.
- 22% of Democrats/Lean Democrats have blocked posts that contain religious content.
- 20% of Jewish individuals have blocked posts that contain religious content.
- 16% of individuals with “Nothing in particular” beliefs have blocked posts that contain religious content.
- 14% of Evangelicals have blocked posts that contain religious content.
- 14% of Mainline Christians have blocked posts that contain religious content.
- 12% of Catholics have blocked posts that contain religious content.
- 12% of Republicans/Lean Republicans have blocked posts that contain religious content.
- 11% of Historically Black Protestants have blocked posts that contain religious content.
Virtual Worship Users
(Reference: pewresearch.org)
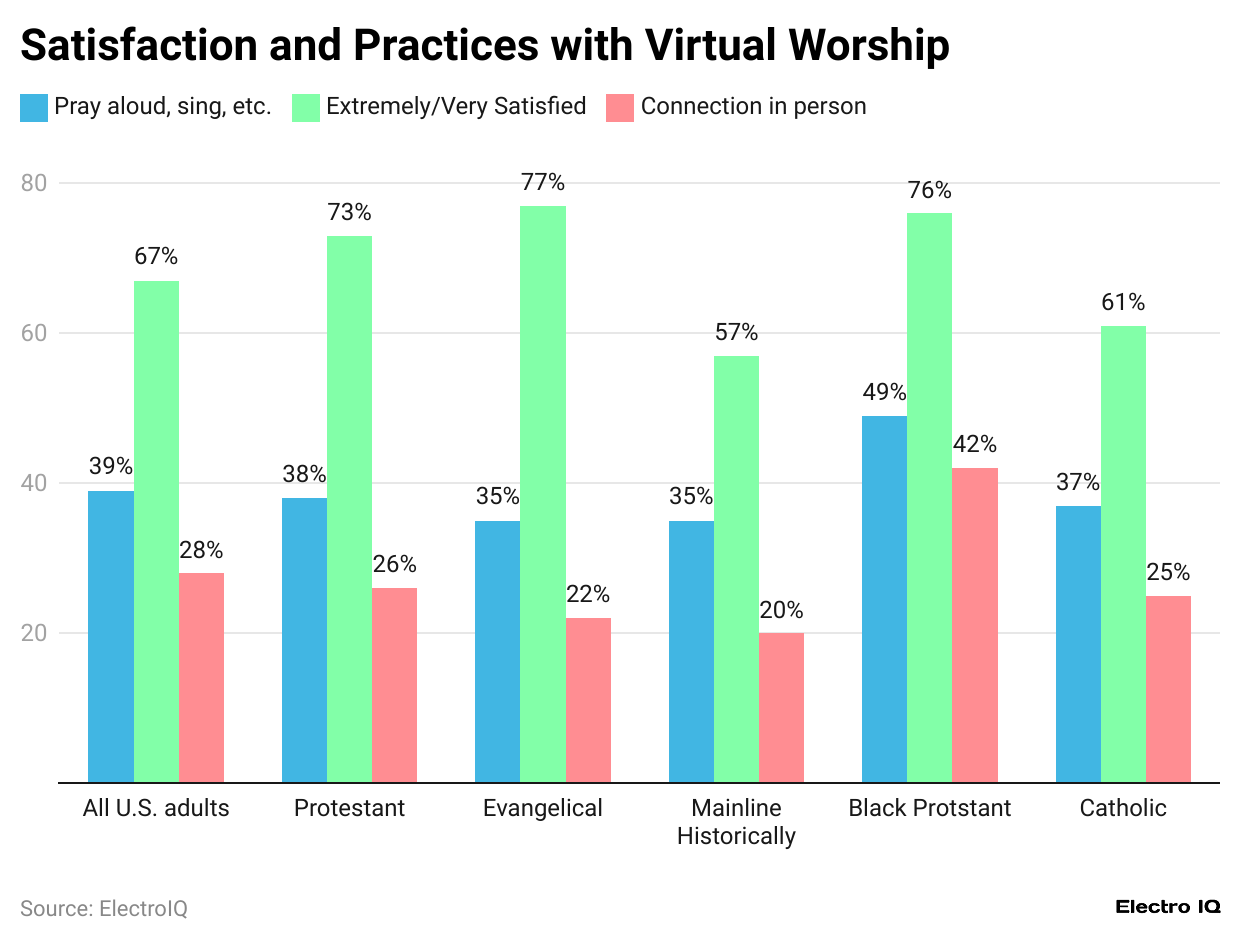
- Online Church Statistics show that 67% of respondents are completely satisfied with virtual services.
- Among the satisfied group, 73% are protestants.
- 77% of Evangelicals are satisfied with virtual church services.
- 61% of Catholics are satisfied with virtual services.
Reasons for Avoiding in-Person Services
(Reference: pewresearch.org)
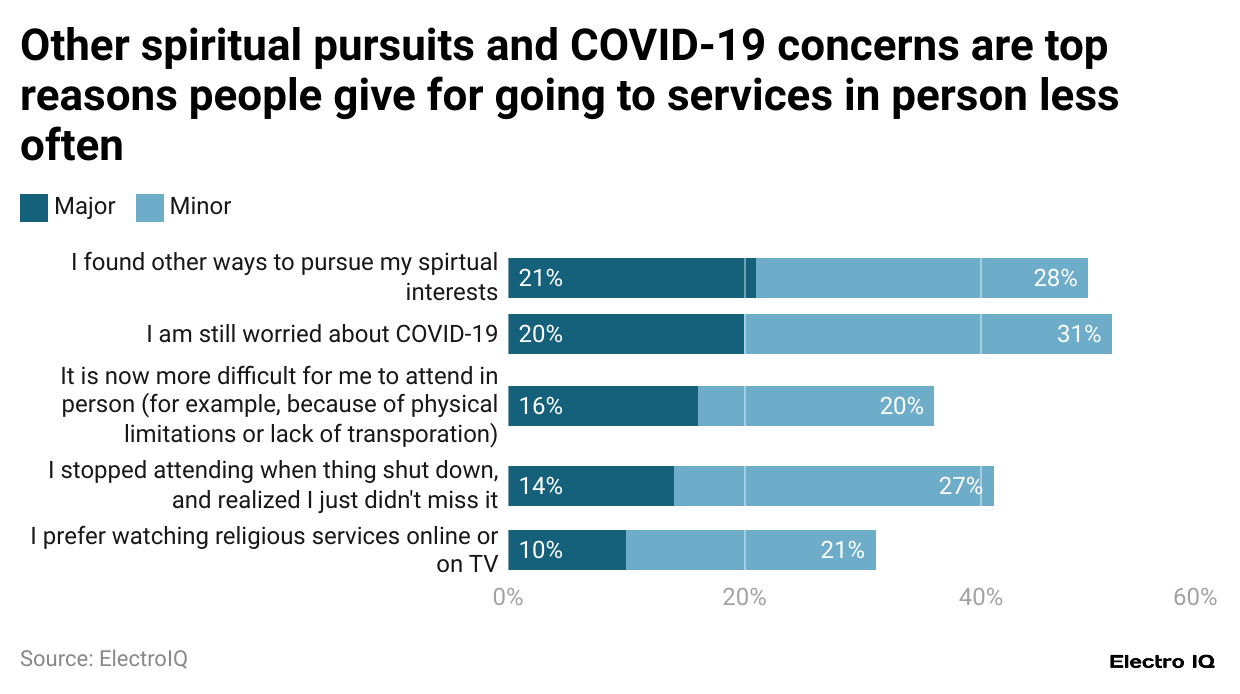
- Online Church Statistics show that 21% of respondents found other reasons to pursue spiritual interest rather than giving up in-person spiritual services.
- 20% of users are still worried about the symptoms associated with covid 19.
- 10% of respondents prefer to watch online services on TV rather than going in person.
Conclusion
Information about online churches reveals a complex landscape of religious engagement in the digital age, where traditional and virtual worship methods coexist and serve different needs within faith communities. According to Online Church Statistics, while in-person services remain the preferred method of worship for most attendees (76%), the emergence of digital platforms has created new opportunities for religious engagement, particularly for those seeking convenience or facing physical limitations.
As religious institutions adapt to changing times, the hybrid model of religious engagement is establishing itself as a permanent feature of modern spiritual life.
Sources
FAQ.
27% of Americans regularly watch religious services on screens, with 10% exclusively watching virtually.
76% of individuals attending in-person and virtual services prefer in-person services, while only 11% prefer virtual services.
21% of respondents report using mobile apps for scripture reading and other religious content.
67% of respondents are satisfied with virtual religious services, although satisfaction levels vary depending on religious denomination.
51% of respondents who watch religious services virtually do so alone.
17% of U.S. citizens have intentionally blocked posts containing religious content on social media or other online platforms.
Convenience is the primary reason for attending virtual religious services, cited by 43% of respondents.
7% of respondents regularly attend online prayer or scripture reading groups
32% of virtual attendees watch services from two to three different congregations, while 60% stick to one congregation.
65% of in-person attendees feel a strong connection during services, compared to only 28% attending virtually.

Maitrayee Dey has a background in Electrical Engineering and has worked in various technical roles before transitioning to writing. Specializing in technology and Artificial Intelligence, she has served as an Academic Research Analyst and Freelance Writer, particularly focusing on education and healthcare in Australia. Maitrayee's lifelong passions for writing and painting led her to pursue a full-time writing career. She is also the creator of a cooking YouTube channel, where she shares her culinary adventures. At Smartphone Thoughts, Maitrayee brings her expertise in technology to provide in-depth smartphone reviews and app-related statistics, making complex topics easy to understand for all readers.


