OTT Platform Statistics By User, Advertising, Streaming, Revenue, Subscribers and Facts (2025)
Updated · Feb 07, 2026


Table of Contents
- Introduction
- Editor’s Choice
- General OTT Platform Statistics
- OTT Device and Services Market Size
- OTT Platform User Statistics
- OTT Advertising Statistics
- Top OTT Streaming Services Statistics
- OTT Platform Revenue Statistics by Segments
- By Advertising Video-on-Demand (AVoD) and Free ad-supported TV (FAST)
- OTT Platform Statistics by Revenue Per User
- OTT Platform User and Penetration Rate Statistics
- OTT Platform Subscribers Statistics
- OTT Platform Brand Share Statistics
- Global Revenue Comparison by Country
- By Region, 2024
- Conclusion
Introduction
OTT Platform Statistics: OTT platforms have changed how people find, pay for, and watch movies and shows. This article explains 2025 using clear numbers. We cover subscribers and monthly active users, watch time and completion, ARPU and ad load, churn and reactivation, device share, and catalogue size.
Hybrid models like SVOD, AVOD, and FAST are rising fast. Price moves, password rules, and local originals now shape sign-ups and retention. Regions differ: North America is mature, Europe grows under tighter rules, Asia-Pacific scales on mobile, and emerging markets add users through telco bundles.
We share benchmarks for funnels, engagement cohorts, and content types, plus the effect of sports rights and release windows. Finally, we review economics, marketing efficiency, content ROI, and profit paths for publishers, advertisers, and investors.
Editor’s Choice
- According to the research conducted by Market.us, the Global OTT Devices and Services Market is estimated to reach a valuation of USD 306.1 billion by 2025.
- Worldwide OTT revenue is projected at USD 295.40 billion in 2024, with forecasts pointing to more than USD 476 billion by 2027.
- In the U.S., 98% of people subscribe to at least one OTT streaming service, and 75% hold two or more.
- According to DemandSage, Netflix had 301.6M subscribers in August 2025, and posted in the first quarter of 2025, the total revenue accounted for USD 10.54 billion.
- As of 2024, OTT Video Advertising is the biggest segment, and it is expected to reach a market size of USD 191.40 billion, with a growth rate of 10.3%.
- In the same year, revenue generated by AVoD and FAST will be approximately USD 48.32 billion and USD 9.62 billion, respectively.
- Per-user revenue accounted for by Advertising Video-on-Demand (AVoD) will be around USD 12.33.
- As mentioned in OTT Platform Statistics, in November 2024, Netflix had the highest number of subscribers, 201.7 million, followed by Amazon Prime Video (172.1 million) and Disney+ (134.4 million).
- OTT Platform Statistics also show that the OTT Video market in the United States will earn USD 133.70 billion in 2024, growing by 7.68% annually (CAGR) to reach USD 193.60 billion by 2029.
General OTT Platform Statistics
- According to VPlayed, the global OTT audience is set to climb from 3.50 billion to 3.71 billion in 2024.
- Worldwide OTT revenue is projected at USD 295.40 billion in 2024, with forecasts pointing to more than USD 476 billion by 2027.
- The OTT Video Advertising segment is expected to touch USD 176.60 billion at the start of 2024.
- Advertising video-on-demand (AVOD) revenue is also projected to top USD 318 billion by 2027.
- From 2023 to 2028, the market is modelled to grow at a 7.29% CAGR, reaching USD 419.90 billion in 2028.
- The United States leads by revenue, generating USD 126,500.00 million in 2023.
- By 2027, total OTT revenue is again expected to surpass USD 476 billion.
- Previously, the OTT video market was valued at USD 178 billion in 2021 and is forecast to expand at a 9.72% CAGR to USD 297.9 billion by 2026.
- Subscription video-on-demand (SVOD) income alone is predicted to exceed USD 139 billion by 2027.
- The user penetration of OTT is estimated at 45.7% in 2023 and could reach 54.7% by 2028.
- Besides, the global OTT content market will increase from USD 204 billion in 2022 to USD 1.94 trillion by 2032, supported by a 22.8% CAGR between 2023 and 2032.
OTT Device and Services Market Size
 (Source: market.us)
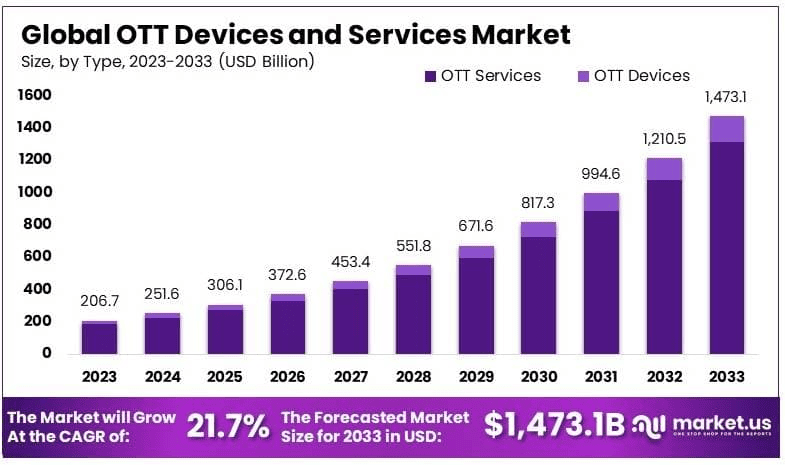
- According to the research conducted by Market.us, the global OTT devices and services market is estimated to reach a valuation of USD 306.1 billion by 2025, up from USD 251.6 billion in 2024.
- Furthermore, the OTT platforms‘ revenue is expected to reach around USD 372.6 billion by 2026, USD 453.4 billion by 2027, USD 551.8 billion by 2028, USD 671.6 billion by 2029, USD 817.3 billion by 2030, USD 994.6 billion by 2031, USD 1,210.5 billion by 2032, and USD 1,473.1 billion by 2033.
- The market will grow at a CAGR of 21.7% from 2025 to 2033.
OTT Platform User Statistics
- In the U.S., 98% of people subscribe to at least one OTT streaming service, and 75% hold two or more.
- On OTT platforms, viewers average 17 hours of online video each week and spend about 70 minutes per day engaging with services.
- Binge-watching is common, with more than 70% of users doing it regularly.
- Usage is frequent: 34.97% stream multiple times each day, and 74.89% access OTT at least three times per week.
- An OTT session lasts between 20 and 60 minutes.
- Around 86% of all OTT users say they plan to keep or expand their subscriptions.
- In contrast, 61% expect to maintain their current lineup for the foreseeable future, while another 25% are considering adding a new subscription.
- Only 14% are thinking about cutting back on the OTT services they are using currently..
OTT Advertising Statistics
 (Reference: vplayed.com)
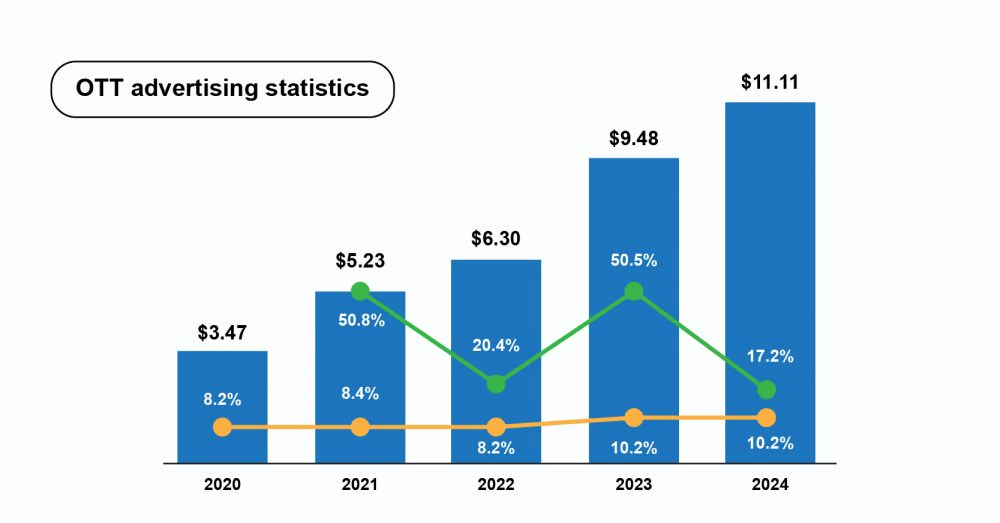
- As of 2024, OTT advertising climbed to USD 11.11, with the green-line rate at 17.2% and the orange-line metric at 10.2%.
- In 2023, spending reached USD 9.48, the green rate peaked at 50.5%, and the orange metric stayed at 10.2%.
- Moving back to 2022, investment totalled USD 6.30, alongside a 20.4% green rate and 8.2% on the orange line.
- In 2021, OTT ad spend was USD 5.23, the green rate was 50.8%, and the orange metric measured 8.4%.
- In 2020, spending stood at USD 3.47, while the orange line read 8.2%.
Top OTT Streaming Services Statistics
- According to DemandSage, Netflix had 301.6M subscribers in August 2025, and posted in the first quarter of 2025, the total revenue accounted for USD 10.54 billion.
- The Walt Disney Company report shows that Disney+ reached 128 million subscribers in Q3 FY2025, up from about 124.6 million in Q1 FY2025.
- The Q3 revenue rose 2% to USD 23.7 billion, up from USD 23.2 billion in Q3 of 2024.
- In the U.S. in 2025, Hulu counted 53.6M subscribers, earned about USD 3.2B in Q1-2025 revenue, and reported SVOD ARPU near USD 12.29 per month, as mentioned in Evoca reports.
- Warner Bros. Discovery’s report also stated that in Q1 2025, Max/WBD Streaming (Max + Discovery+) reported 122.3 million global subscribers and a global ARPU of USD 7.11 in Q1 2025.
- Paramount’s GAAP revenue was USD 7,192 million in 2025 versus USD 7,685 million in 2024, a 6% decline, while the subscriber count accounted for 79 million subscribers in Q1 2025.
- As reported by The Hollywood Reporter, Peacock reached 41M subscribers in Q2 2025, and its quarterly loss was USD 101M in the same period.
- In 2025, the U.S. likely has about 90.5 million Prime Video users, an estimate based on S&P Kagan’s 128 million U.S. Prime members, roughly 75% of whom watch Prime Video (via TV Tech).
- TV Tech also reports that Prime Video advertising is forecast to generate about USD 806 million in 2025.
- YouTube Premium (including Music) counted 125 million subscribers in 2025.
- Meanwhile, in Q4 2024, YouTube generated USD 10.47 billion in advertising revenue.
- According to 9to5Mac, Apple’s Eddy Cue signaled Apple TV+ has well over 45 million subscribers in 2025.
OTT Platform Revenue Statistics by Segments
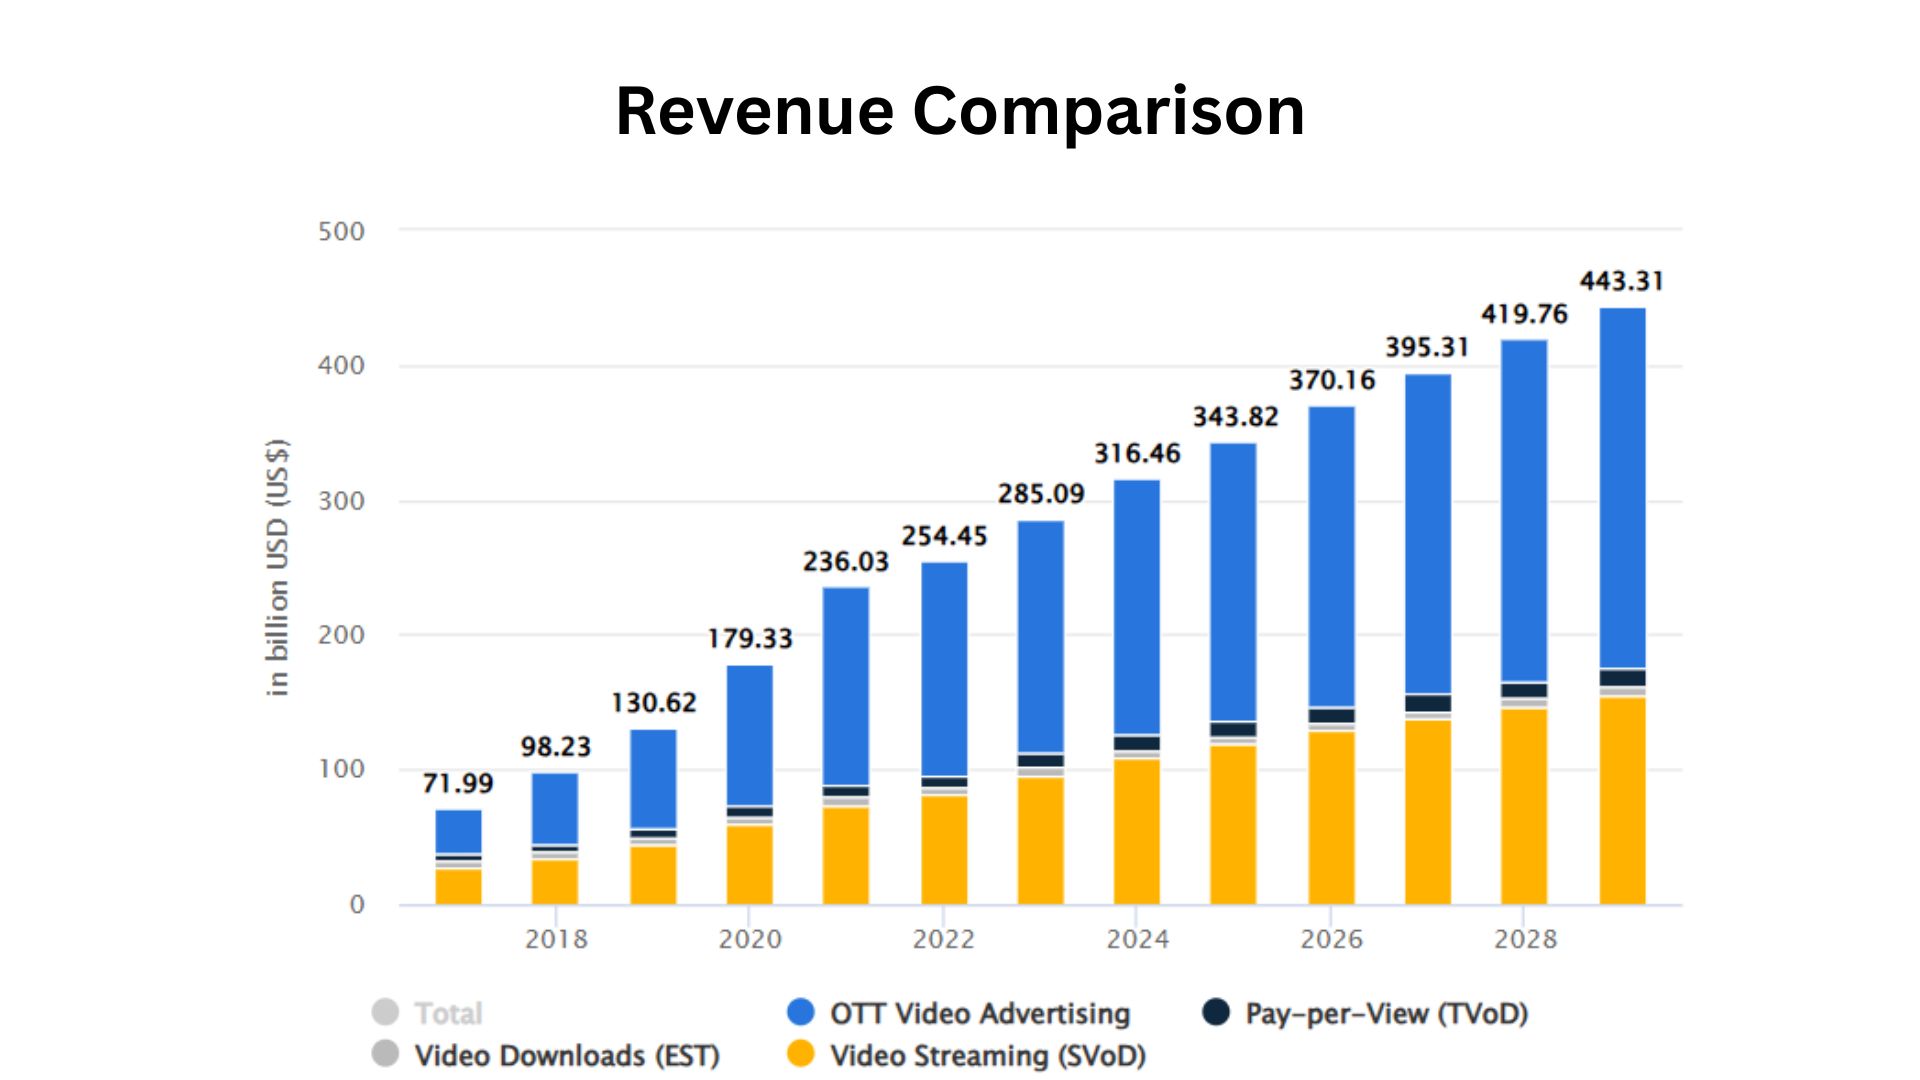
- As of 2024, OTT Video Advertising is the biggest segment, and it is expected to reach a market size of USD 191.40 billion, with a growth rate of 10.3%.
- Other segments’ revenue and change rate at the same time are followed by Pay-per-View (USD 10.93 billion) (7.2%), Video downloads (USD 5.63 billion) (2.2%), and Video Streaming (USD 108.50 billion) (13.2%).
Furthermore, OTT’s segmental revenue (USD Billion) and growth rate in the coming years are stated below:
| Years | OTT Video Advertising | Pay-per-View | Video Downloads | Video Streaming |
|
2025 |
207.50 (8.5%) | 11.51 (5.3%) | 5.71 (1.4%) | 119.10 (9.8%) |
| 2026 | 223.50 (7.7%) | 12.08 (5%) | 5.78 (1.3%) |
128.80 (8.2%) |
|
2027 |
239.10 (7%) | 12.66 (4.8%) | 5.85 (1.2%) | 137.70 (6.9%) |
| 2028 | 254.00 (6.25) | 13.24 (4.6%) | 5.92 (1.2%) |
146.60 (6.5%) |
|
2029 |
268.00 (5.5%) | 13.82 (4.4%) | 5.99 (1.1%) |
155.50 (6.1%) |
By Advertising Video-on-Demand (AVoD) and Free ad-supported TV (FAST)
 (Source: statista.com)
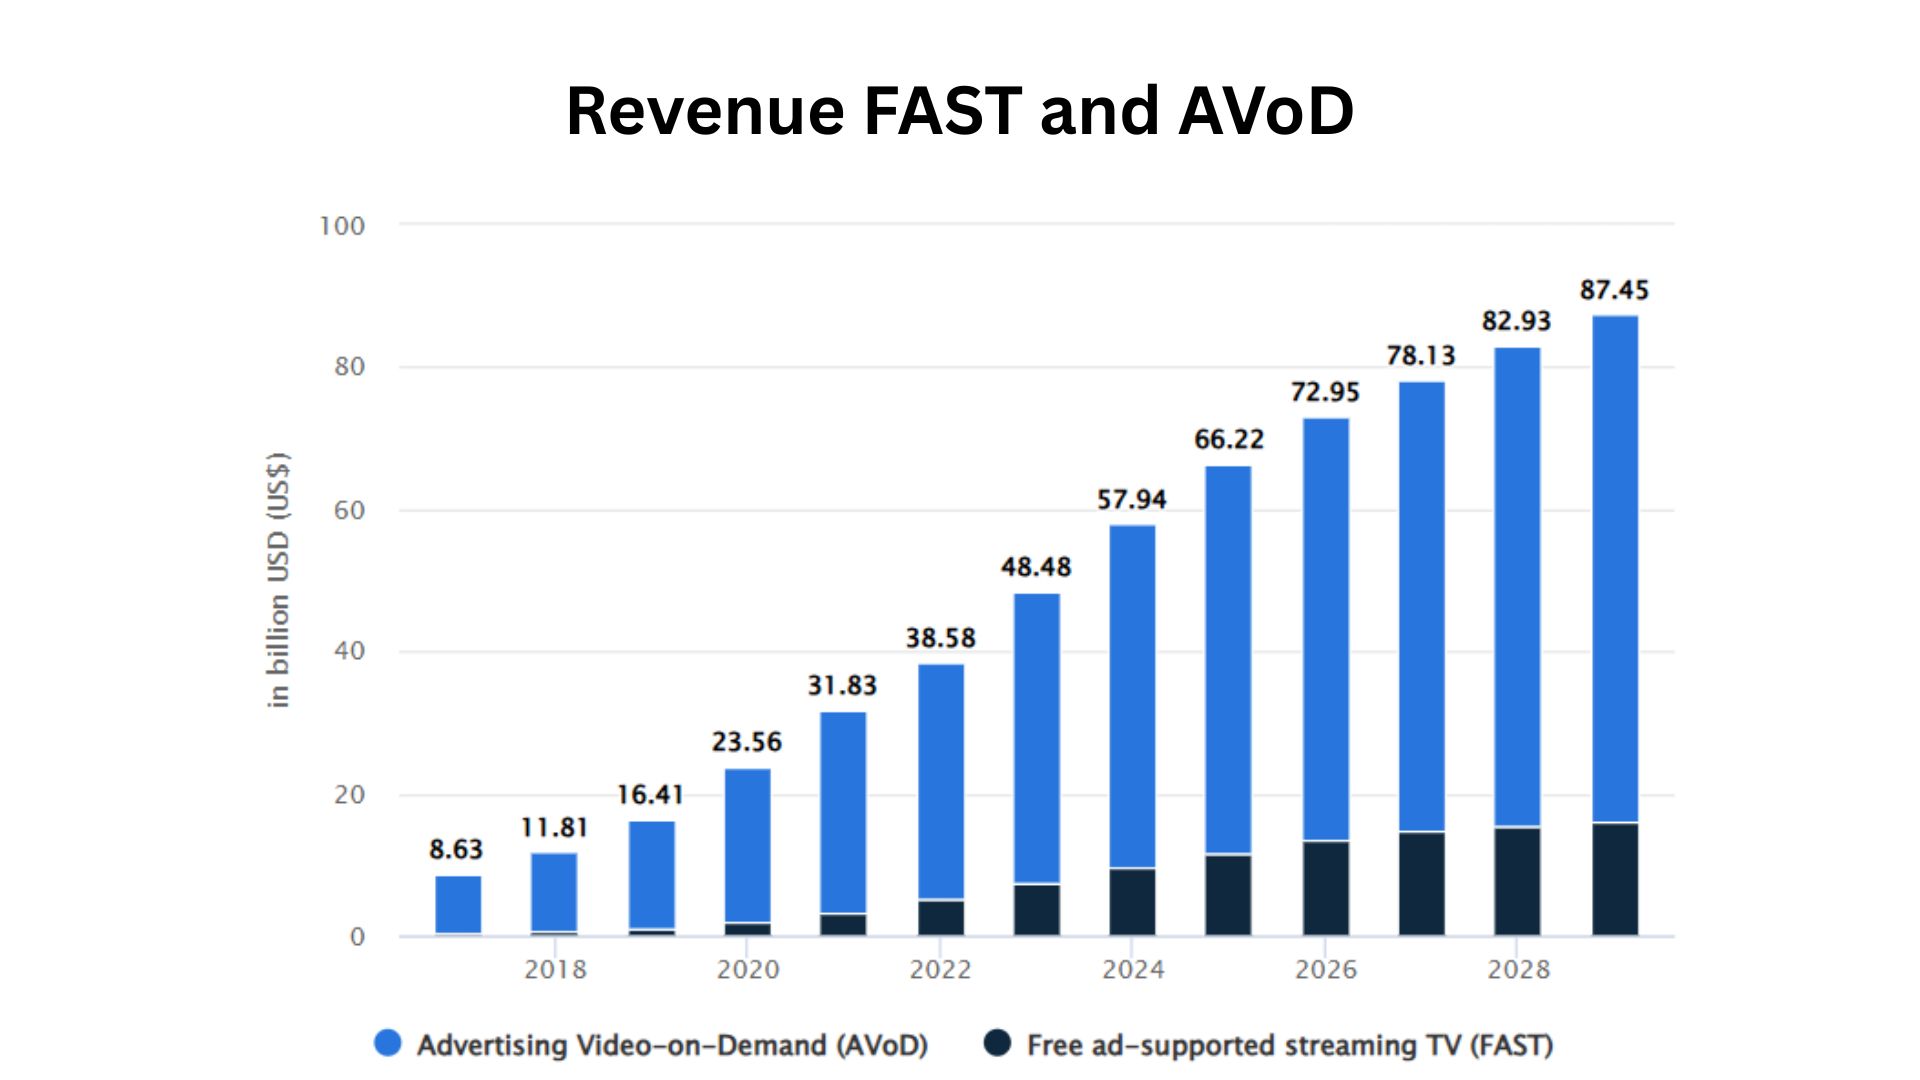
- OTT Platform Statistics show that in 2024, revenue generated by AVoD and FAST will be approximately USD 48.32 billion and USD 9.62 billion, respectively.
Furthermore, in the coming years, the estimated revenue is detailed in the table below:
| Year | AVoD (USD billion) | FAST (USD billion) |
| 2025 | 54.54 | 11.68 |
| 2026 | 59.59 | 13.36 |
| 2027 | 63.50 | 14.63 |
| 2028 | 67.40 | 15.53 |
| 2029 | 71.31 | 16.14 |
OTT Platform Statistics by Revenue Per User
 (Source: statista.com)
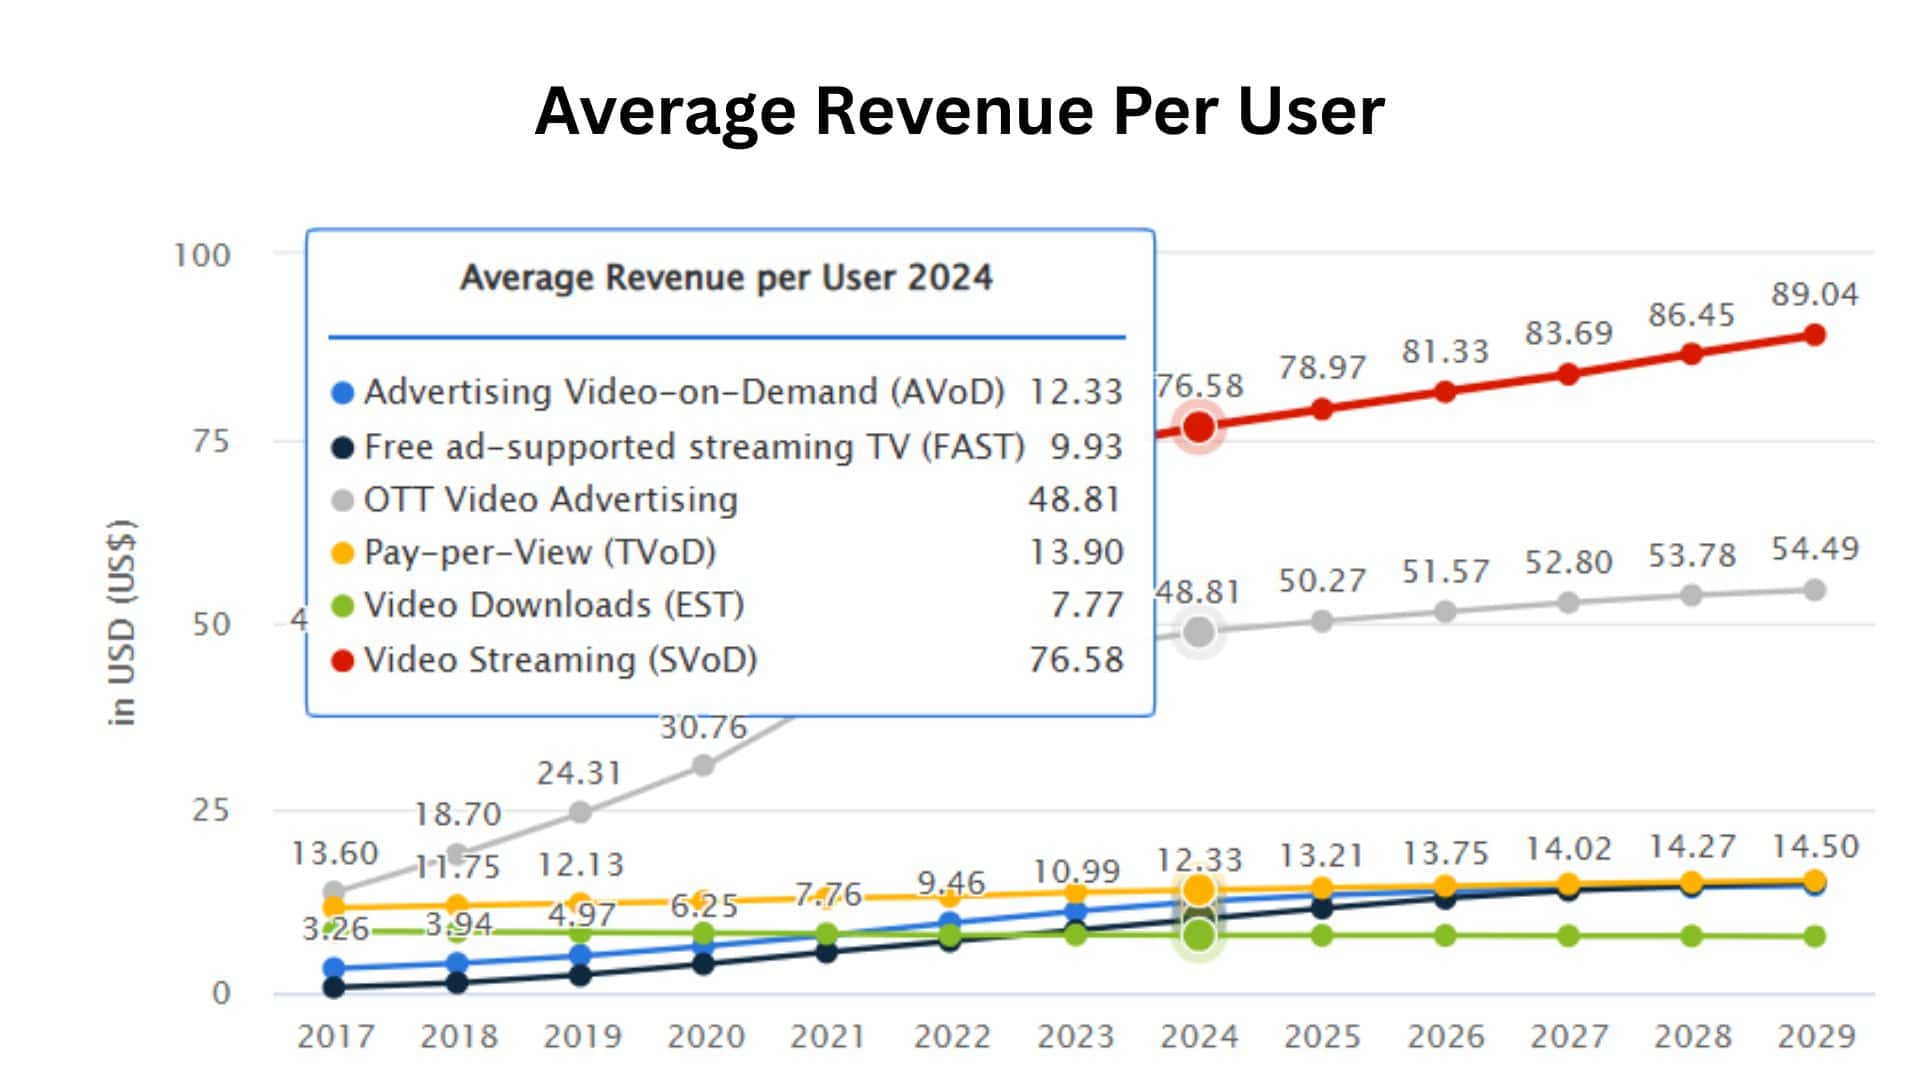
- As of 2024, per-user revenue accounted for by Advertising Video-on-Demand (AVoD) will be around USD 12.33.
- Others are followed by Free-ad-supported streaming TV (USD 9.93), OTT Video Advertising (USD 48.81), Pay-per-View (USD 13.90), Video Downloads (USD 7.77), and Video Streaming (USD 76.58).
Similarly, in the next few years, the average revenue per user in different segments is stated below:
| Year (USD) | AVoD | FAST | OTT Video Advertising | TVoD | EST | SVoD |
| 2025 | 13.21 | 11.43 | 50.27 | 14.17 | 7.74 | 78.97 |
| 2026 | 13.75 | 12.76 | 51.57 | 14.44 | 7.72 | 81.33 |
| 2027 | 14.02 | 13.83 | 52.80 | 14.70 | 7.68 | 83.69 |
| 2028 | 14.27 | 14.53 | 53.78 | 14.94 | 7.65 | 86.45 |
| 2029 | 14.50 | 14.95 | 54.49 | 15.17 | 7.62 | 89.04 |
OTT Platform User and Penetration Rate Statistics
| Year (billion) | AVoD | FAST | OTT Video Advertising | TVoD | EST | SVoD |
| 2024 | 3.9 (50.6%) | 3.9 (50.6%) | 1.0 (12.5%) | 0.8 (10.2%) | 0.7 (9.4%) | 1.4 (18.3%) |
| 2025 | 4.1 (52.8%) | 4.1 (52.8%) | 1.0 (13.1%) | 0.8 (10.4%) | 0.7 (9.4%) | 1.5 (19.3%) |
| 2026 | 4.3 (55%) | 4.3 (55%) | 1.1 (13.3%) | 0.8 (10.6%) | 0.8 (9.5%) | 1.6 (20.1%) |
| 2027 | 4.5 (57.1%) | 4.5 (57.1%) | 1.1 (13.1%) | 0.9 (10.9%) | 0.8 (9.6%) | 1.7 (20.7%) |
| 2028 | 4.7 (59.1%) | 4.7 (59.1%) | 1.1 (13.4%) | 0.9 (11.1%) | 0.8 (9.7%) | 1.7 (21.1%) |
| 2029 | 4.9 (61%) | 4.9 (61%) | 1.1 (13.4%) | 0.9 (11.3%) | 0.8 (9.8%) | 1.8 (21.7%) |
OTT Platform Subscribers Statistics
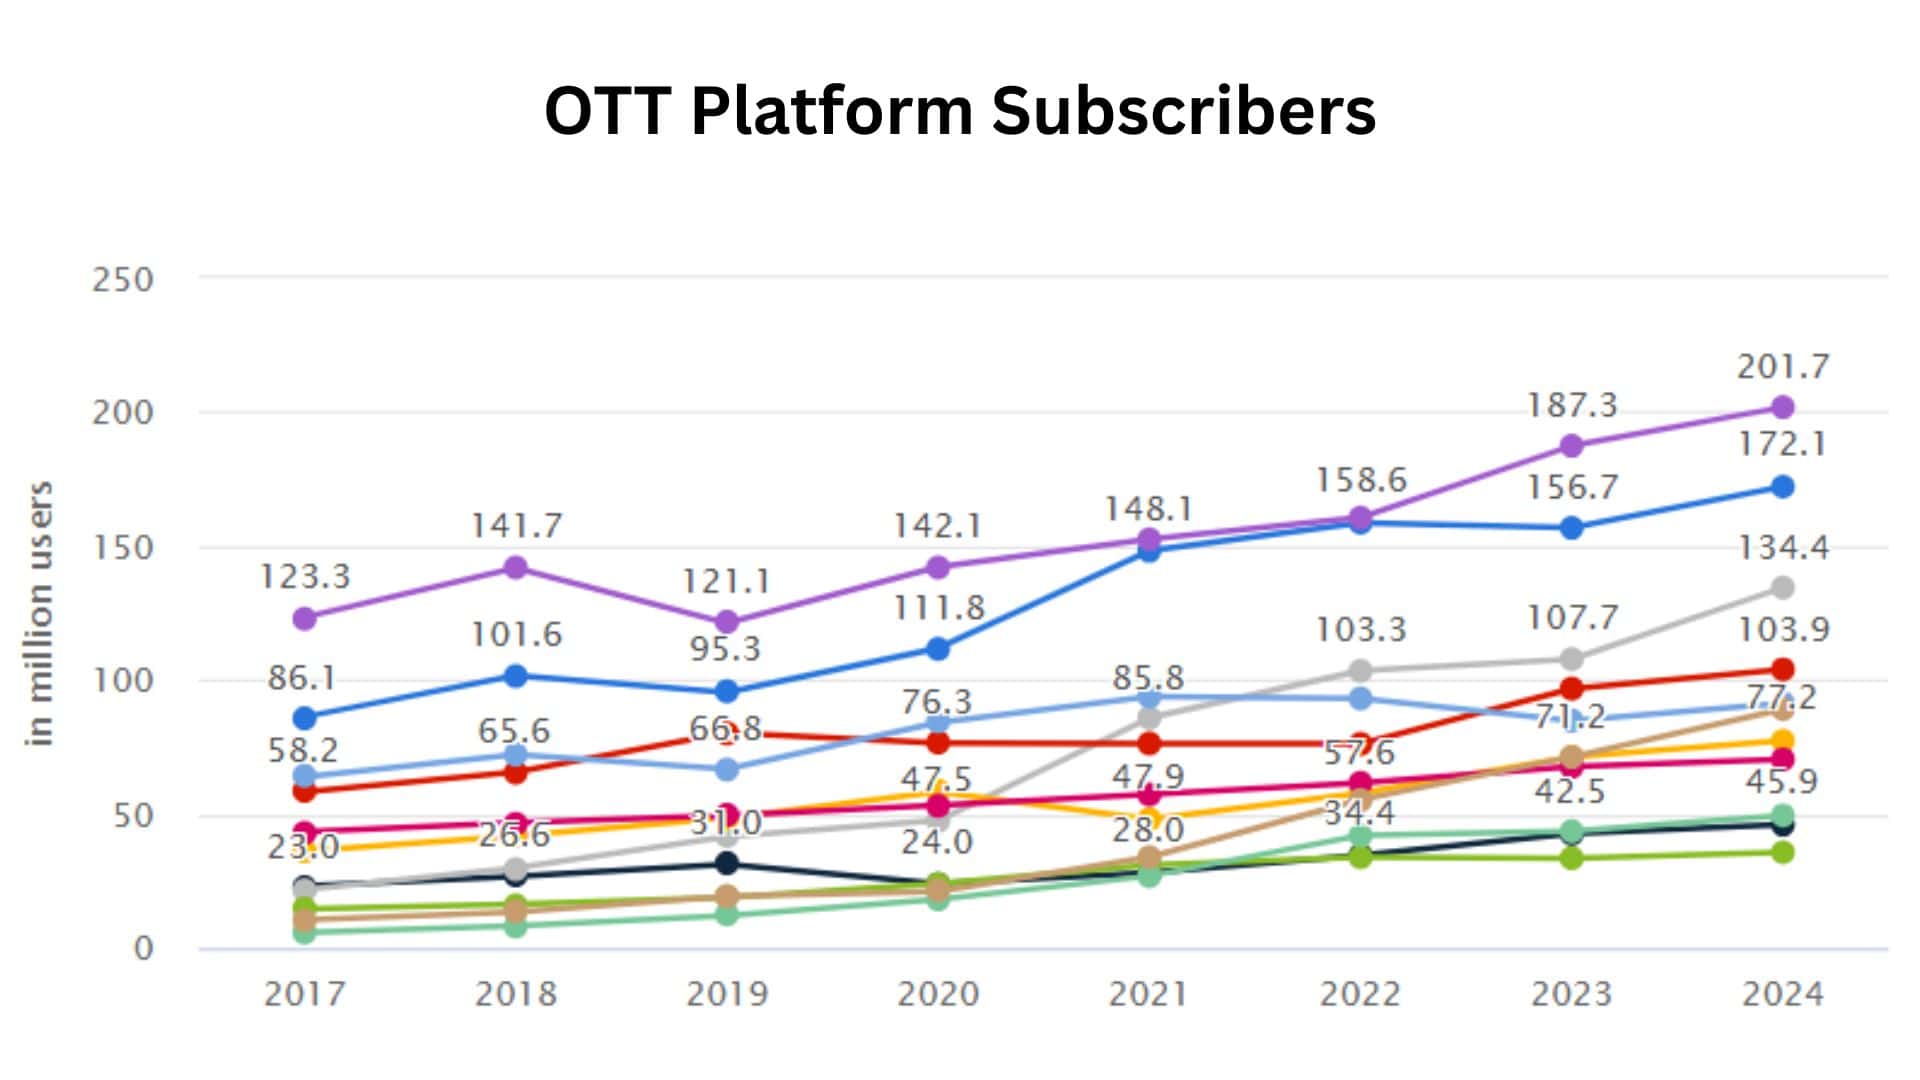
- As mentioned in OTT Platform Statistics, in November 2024, Netflix had the highest number of subscribers, 201.7 million, followed by Amazon Prime Video (172.1 million) and Disney+ (134.4 million).
- Furthermore, other OTT services subscriber counts are represented as Apple TV+ (45.9 million), HBO Max (77.2 million), Hulu (35.6 million), iQIYI (103.9 million), Paramount+ (49.4 million), Tencent Video (91.3 million), Youku (70.4 million), and YouTube Premium (89 million).
- By the end of 2023, Amazon Prime Video secured an 18% share of the global OTT platform, followed by Disney+ (15%) and Netflix (13%).
- Moreover, YouTube made up an OTT platform share of 12%, while Tubi and Pluto TV accounted for 8% each, and Crave and Paramount+ secured 7% each.
- Lastly, Crunchyroll and Discovery+ made up a share of 3% and 2%, respectively.
- Similarly, the rest of the OTT brand’s share was around 7%
Global Revenue Comparison by Country
- OTT Platform Statistics also show that the OTT Video market in the United States will earn USD 133.70 billion in 2024, growing by 7.68% annually (CAGR) to reach USD 193.60 billion by 2029.
- OTT Video Advertising will be the biggest segment, generating USD 85.39 billion in 2024.
- By 2029, 259.8 million people in the U.S. will use OTT video services, with user penetration rising from 71.0% in 2024 to 74.1%.
- The average revenue per user will be USD 550.60.
As per OTT Platform Statistics, the other top four countries’ market analyses in 2024 are stated in the table below:
| Country | Market Size (USD) | CAGR (from 2024 to 2029) | Largest Market | User Penetration Rate | Average Revenue Per User (USD) |
| China | 76.60 billion | 6.73% | OTT Video Advertising: USD 53.48 billion | 65.6% | |
| United Kingdom | 15.95 billion | 4.48% | OTT Video Advertising: USD 9.71 billion | 83.9% | |
| Japan | 9.94 billion | 5.42% | OTT Video Advertising: USD 5.23 billion | 65.4% | |
| Germany | 7.18 billion | 6.14% | Video Streaming (SVoD): USD 4.30 billion | 82.5% |
By Region, 2024
| Region | Revenue (USD) | CAGR (2024 to 2029) | Revenue Per User (USD) | User Penetration Rate |
| Africa | 3.91 billion | 8.54% | 10.06 | 29.9% |
| Americas | 151.30 billion | 7.58% | 223.30 | 66.7% |
| Asia | 104.80 billion | 6.65% | 46.32 | 49.8% |
| Australia and Oceania | 5.66 billion | 6.38% | 251.40 | 51.9% |
| Caribbean | 375.50 million | 4.76% | 19.06 | 48.6% |
| Europe | 50.71 billion | 5.77% | 89.10 | 67.4% |
Conclusion
OTT has moved from the sidelines to the main screen. Success comes from smart prices, bundles, strong discovery, local hits, and unmissable live moments. Hybrid tiers like SVOD, AVOD, and FAST will keep growing as homes combine paid and free options. Efficient growth means working the metric chain: cut CAC with precise targeting, raise watch time with better suggestions, curb churn with flexible plans, and lift ROI by funding what proven cohorts love. Strategies stay regional: mobile-first APAC, regulation-minded Europe, partnership-led emerging markets. The rule: use data, learn fast, and build durable profits.
Sources
FAQ.
OTT streams over public internet via apps; IPTV/cable use managed networks and set-top boxes instead.
SVOD is a paid subscription; AVOD is free or low-cost with ads, and FAST is a free, linear internet channel streaming.
Subscriptions, advertising, pay-per-view transactions, add-ons, bundles, licensing, sponsorships, merchandising, data partnerships, affiliate commissions, and content syndication.
Not always, many OTT platforms offer free ad-supported tiers, while some premium content requires subscriptions.
No, many OTT platforms offer free, ad-supported tiers; subscriptions unlock ad-free content and extras too.

Maitrayee Dey has a background in Electrical Engineering and has worked in various technical roles before transitioning to writing. Specializing in technology and Artificial Intelligence, she has served as an Academic Research Analyst and Freelance Writer, particularly focusing on education and healthcare in Australia. Maitrayee's lifelong passions for writing and painting led her to pursue a full-time writing career. She is also the creator of a cooking YouTube channel, where she shares her culinary adventures. At Smartphone Thoughts, Maitrayee brings her expertise in technology to provide in-depth smartphone reviews and app-related statistics, making complex topics easy to understand for all readers.