SanDisk Statistics By Product Growth, Market Size, Technology Evolution And Revenue
Updated · May 29, 2026


Table of Contents
- Introduction
- Editor’s Choice
- SanDisk Market Size
- SanDisk Capital Intensity
- SanDisk Technology Evolution And Bit Cost Reduction
- SanDisk Product Growth By Segment
- SanDisk Gross & Cash CapEx
- SanDisk Gross Revenue
- SanDisk Net Income
- SanDisk Adjusted Free Cashflow
- SanDisk Cash Position
- FQ3’25 Is Expected To Be A Transition Quarter
- Conclusion
Introduction
SanDisk Statistics: SanDisk is synonymous with flash memory storage; it has been a pioneer in revolutionary data storage and retrieval processes. The company, which started in 1988, primarily invented the whole range of storage media, from the first flash solid-state drives to high-capacity memory cards. SanDisk was acquired by Western Digital in 2016, and that fortified its already strong position in the market.
The year is 2025 as always, SanDisk is still leading the others in various destinations, especially in terms of the Indian consumer storage market. In this article, he tries to generate SanDisk statistics in terms of financials.
Editor’s Choice
- According to SanDisk statistics, in 2024, the company is projecting a Total Addressable Market (TAM) of US$100 billion, driven mostly by the continued strong demand for NAND technology, which is growing at 13% CAGR due to AI, cloud, and expansion in devices.
- CapEx for SanDisk w.r.t wafer fabrication equipment peaked at US$20 billion in 2021 but came down to US$6 billion in 2023 and is likely to stabilize at US$9 billion in 2024.
- SanDisk statistics reveal that in terms of products, the company witnessed aggressive growth across verticals, with data centers commanding 298 exabytes on demand.
- This segment accounts for 277 EB in terms of clients, with consumer storage reaching 59 EB. That demand sums up to 372 EB for mobile storage, showing a marked increase in high-resolution video and AI-driven applications.
- Again, capital expenditures have fluctuated for SanDisk, with investments from a joint venture going down from US$1.57 billion in 2022 to US$533 million in 2024.
- SanDisk statistics show that Revenue has declined from a very high US$9.75 billion in 2022 to a still sub-optimally high US$6.08 billion in 2024, with gross margins showing disastrous signs of fluctuation, as per the available data.
- The net income reported by the company was US$1.06 billion during 2022, but it faced losses in 2023 and 2024, with the forecast to return to profits in FQ1’25 with a net income of US$172 million.
- The company’s adjusted free cash flow was negative in 2023 and 2024; however, it did show improvement in Q1 of FY25.
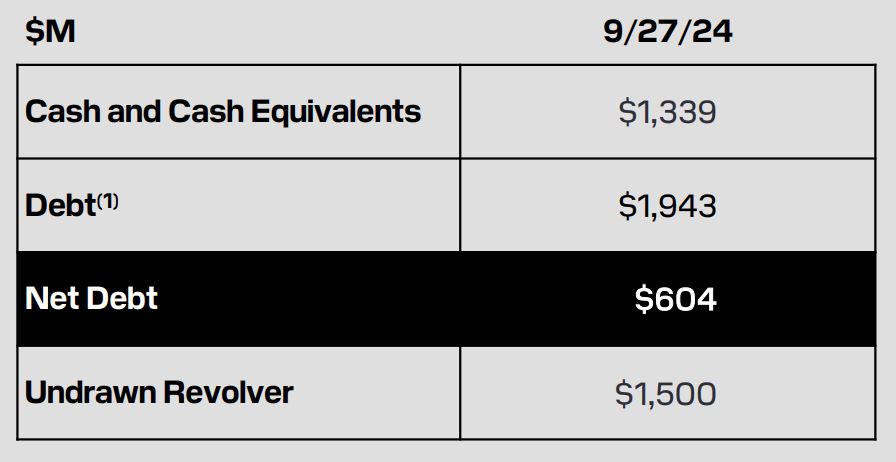
- As of September 2024, SanDisk’s Cash and Cash Equivalents stood at US$1.34 billion, Debt at US$1.94 billion, and Net Debt at US$604 million.
- It further had access to an undrawn revolving credit of US$1.5 billion.
- The company expected a transition quarter in FQ3’25, with forecast revenues of US$1.55 billion to US$1.65 billion, gross margin of 21.5% to 23%, operating expenses of US$395 million to US$405 million, and EPS likely to be negative between -US$0.30 and -US$0.45.
SanDisk Market Size
(Source: documents.sandisk.com)
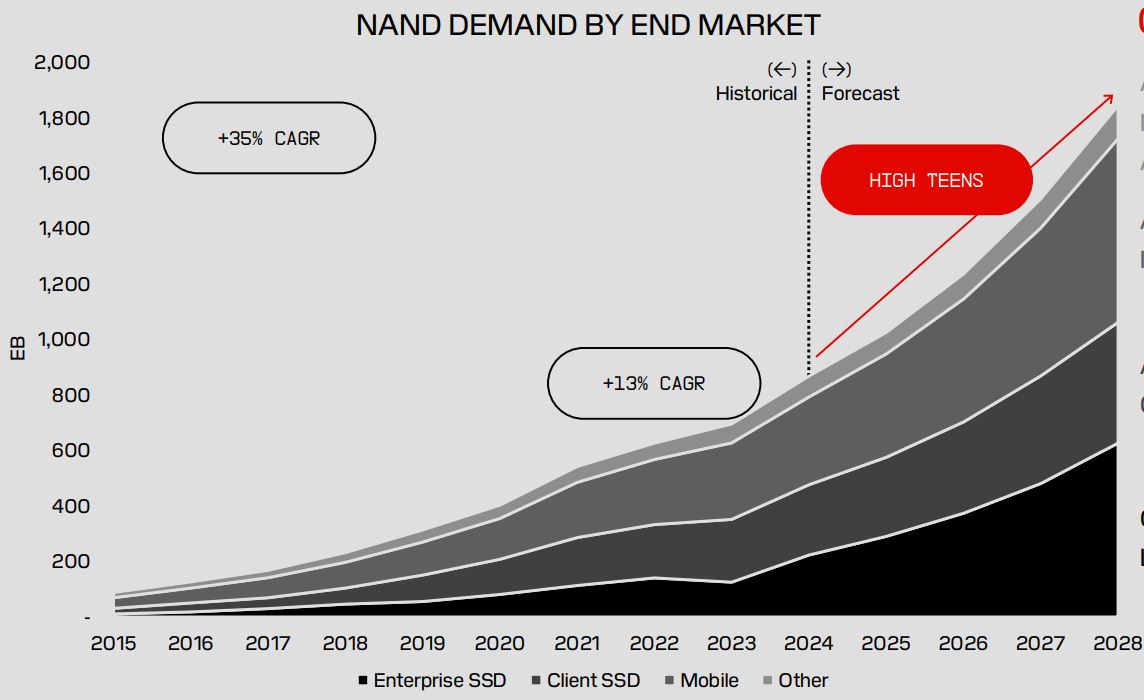
- Company Marquee launches a new series of cloud flash storage. The survey showed highly evident growth in the financial and market performance of SanDisk in 2024, in flash storage.
- It has maintained its leadership with a projected Total Addressable Market (TAM) of US$100 billion. The major 13% compound annual growth rate (CAGR) of the demand for NAND is attributed to AI, cloud computing, and, in general, device proliferation.
- Enterprise SSDs alone are over 100% in year-over-year demand percentage growth, while NAND technology innovations improve efficiencies and lower costs.
SanDisk Capital Intensity
(Source: documents.sandisk.com)
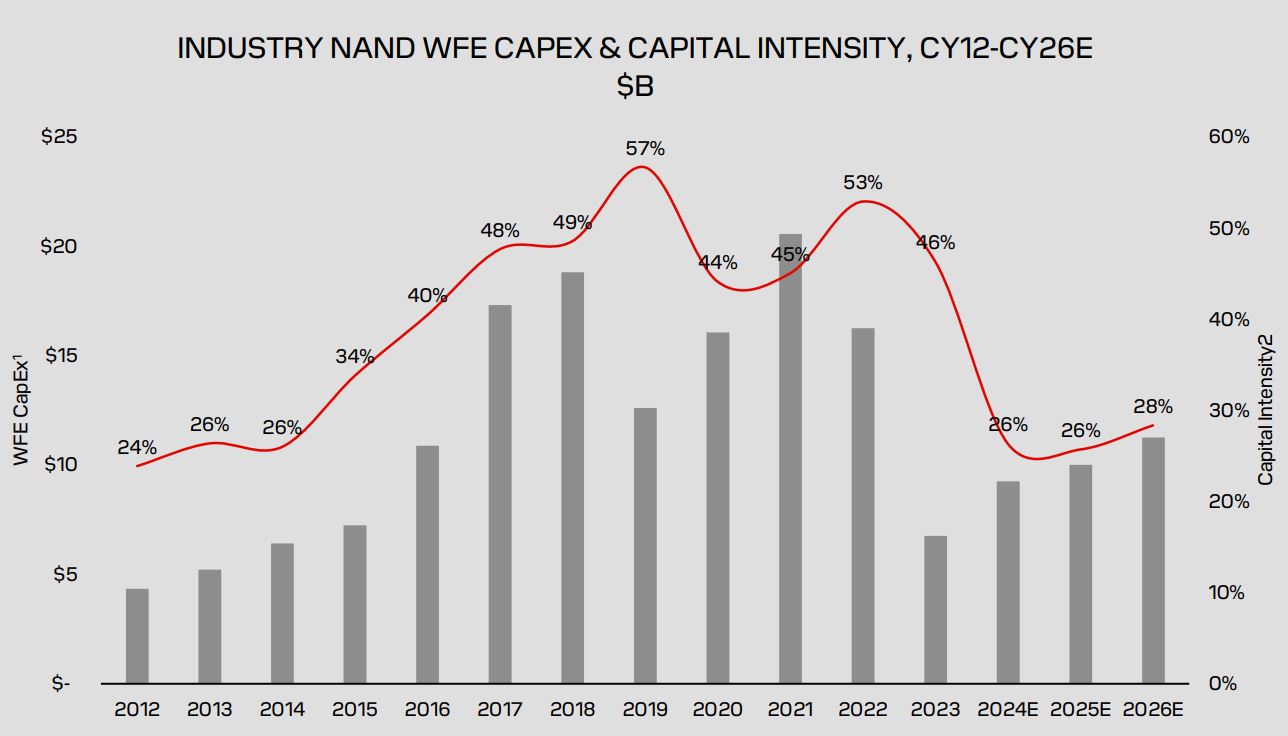
- SanDisk statistics across the industry have combined CapEx on wafer fabrication equipment (WFE) for NAND flash memory production from 2012 to what is expected by 2026.
- In 2012, there was relatively low CapEx for WFE and an accompanying capital intensity of 24%.
- Thereafter, investment went on to increase to impressive levels, peaking at US$20 billion in 2021 and with a capital intensity of 45%.
- However, a decline in 2023 by US$6 billion and 46% capital intensity resulted from market fluctuations, adjustments in supply and demand, and cost control measures.
- Spending is expected to stabilize in 2024 and after, with projected CapEx at US$9 billion for 2024, US$10 billion for 2025, and US$11 billion for 2026, while capital intensity rests at a steady 26-28%.
- This indicates a big portion of the shift from aggressive expansion strategies to efficient and profitable approaches in the industry.
SanDisk Technology Evolution And Bit Cost Reduction
(Source: documents.sandisk.com)
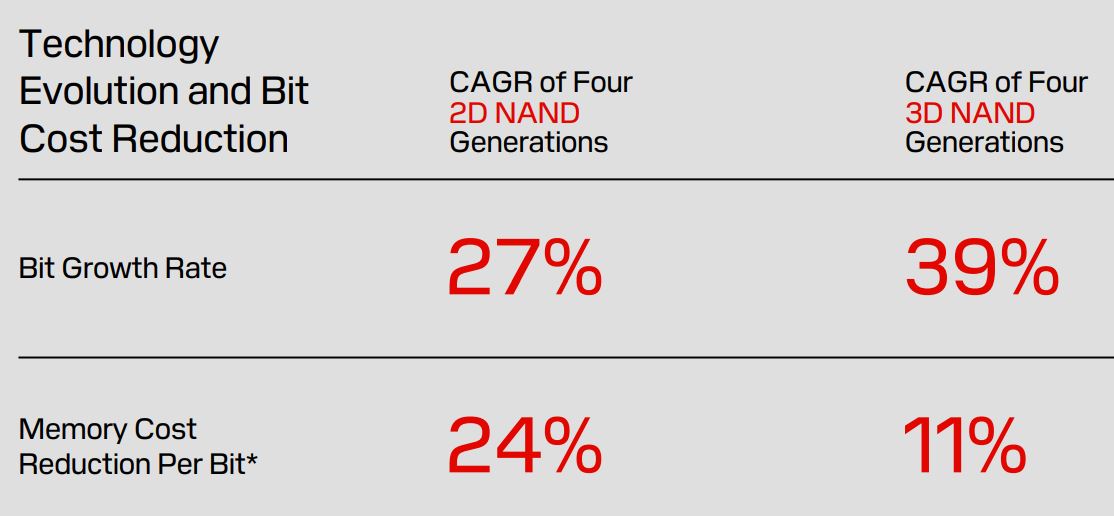
- As it always does, SanDisk is increasingly improving the bit density of NAND flash technology while negatively impacting costs with time.
- The improvement surpasses the percentage in which 2D NAND grew, 27% annually; that for 3D NAND scales to a whopping 39% because of the soaring number of vertical stacks.
- But then again, the decrease per bit slowed down in cost from 24% in 2D NAND to 11% in 3D NAND.
- SanDisk statistics indicate that although it is possible to store more using 3D NAND, there has been a decline in the gain due to the switch from previous generations of technology.
SanDisk Product Growth By Segment
(Source: documents.sandisk.com)
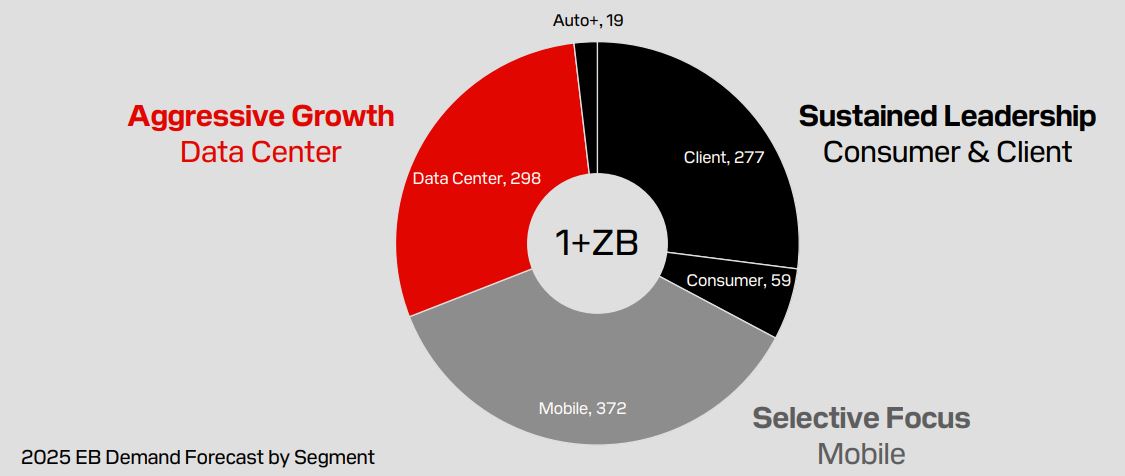
- Shifting in focus between their other segments in customer needs, product growth for SanDisk in 2024 has been prefigured into three major segments.
- Aggressive growth isn’t the only thing said about this segment; the data centre segment has accrued demand to a whopping 298 exabytes (EB). The need arises probably because of interest in high-performance enterprise storage, mostly with applications in AI and cloud computing.
- The company has continued to enjoy uninterrupted gaming in the consumer and client storage world. Of this, client storage contributed to the major 277 EB, while consumers consumed a total of 59 EB.
- The automotive industry had an addition of 19 EB, which covered smart vehicle data-embedded flash.
- The mobile segment is selective in focus, and indeed, it was where demand soared highest for an individual product, 372 EB.
- SanDisk statistics reflect the growing acceptance of mobile storage, as seen through UFS and eMMC technologies, to accommodate the burgeoning use of high-resolution video, gaming, and especially AI applications.
SanDisk Gross & Cash CapEx
(Source: documents.sandisk.com)
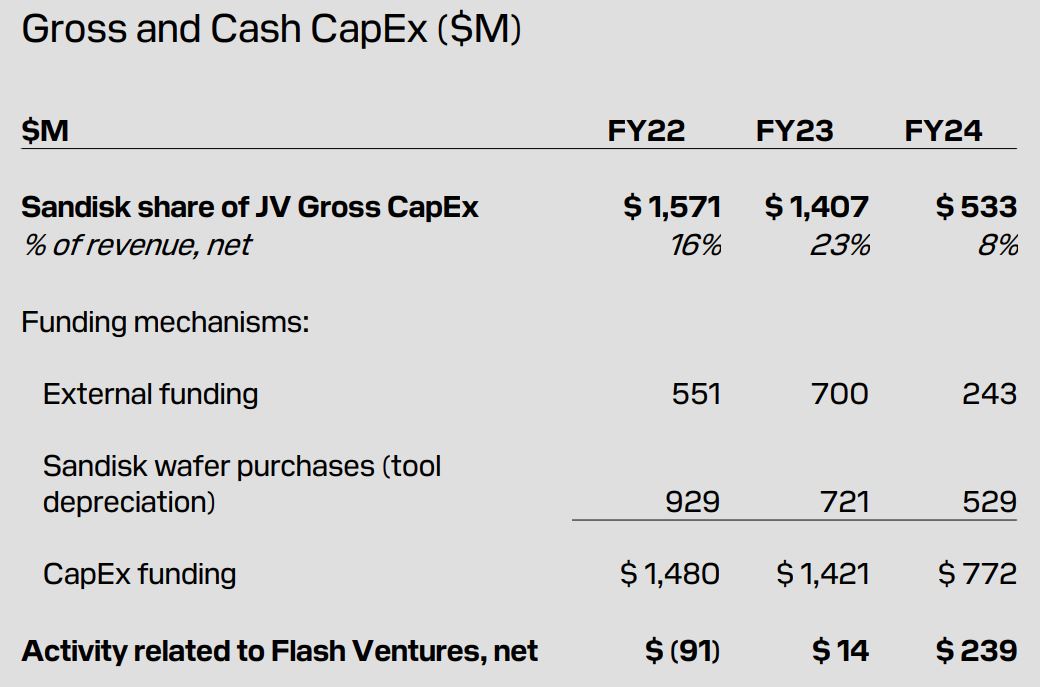
- SanDisk’s Capex from 2022 through 2024 indicates various changes in the evaluation of investment strategies and means of funding.
- In 2022, SanDisk spent 16% of net revenue on US$1.571 billion worth of Joint Venture Capital expenditure (JV CapEx).
- This went slightly down to US$1.407 billion in 2023 (23% of revenue) before showing a sharp decline to US$533 million in 2024 (8% of revenue).
- SanDisk received external funding for these investments in the amounts of US$551 million in 2022, US$700 million in 2023, and US$243 million in 2024, intended for CLDFlashIII. Wafer purchases and depreciation of tools funded a sizable US$929 million in 2022, US$721 million in 2023, and US$529 million in 2024.
- According to SanDisk statistics, CapEx funding totals amounted to US$1,480 million in 2022, US$1,421 million in 2023, and US$772 million in 2024.
- Concerning Flash Ventures, the net cash flow in 2022 amounted to an outflow of US$91 million, which signifies cash outflows associated with financial transactions related to its strategic partners, but in 2023, the net effect was mildly positive at US$14 million, and the amount rose to US$239 million in 2024, symbolizing improved financial efficiency in JV operations.
- These patterns do highlight the strategic aim of SanDisk’s approach to effectively allocating its investments and still advancing technology.
SanDisk Gross Revenue
(Source: documents.sandisk.com)
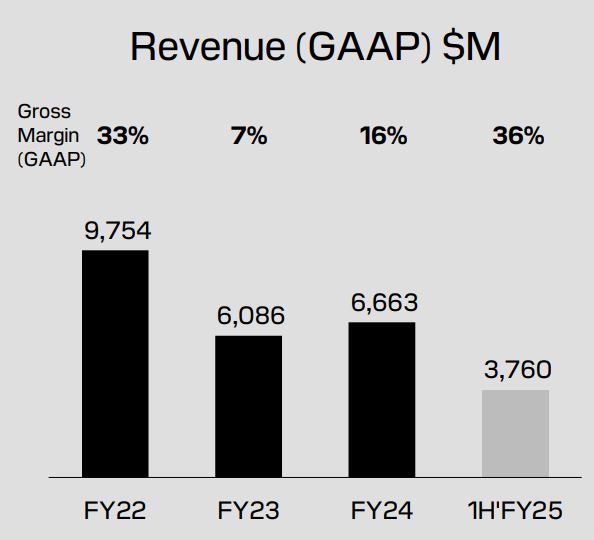
- The financial performance of SanDisk has revealed a fluctuating revenue and gross margin trend in recent years.
- SanDisk’s statistics experienced revenues of US$9.75 billion with gross margins of 33% in FY 2022.
- In 2023, falling revenues of US$6.66 billion and sharply lower gross margins of 7% reflect increasing financial pressure.
- Fiscal Year 2024 recovered somewhat from the downturn, with revenues of US$6.08 billion and gross margins of 16%.
- The first half of FY 2025 showed a continued improvement, with revenues of US$3.76 billion and gross margins of 36%, indicating an even better financial standing.
- These figures are based on the SanDisk Flash segment’s performance, excluding certain corporate cost allocations as reported in the financial statements of Western Digital Corporation.
SanDisk Net Income
(Source: documents.sandisk.com)
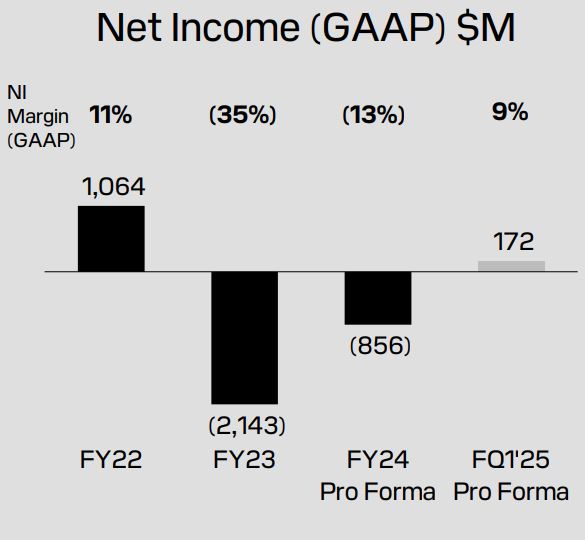
- The income pertains to SanDisk during an era in time and over various periods. Some of these figures have also seen accounting adjustments made on them for what is probably the effect of a spin-off and related transactions on them.
- SanDisk’s net income during fiscal year 22 stood at US$ 1,064 million, with a margin of 11%. Thus, it can be inferred that for each dollar of revenue generated by SanDisk, the company made a profit of 11 cents after paying all expenses.
- By contrast, FY23 marks a great dip in net income at SanDisk, which reported a loss of US$ 2,143 million and a margin of -35%.
- As every dollar of revenue was made, the company lost 35%, which shows a rough time during that period.
- Looking ahead, pro forma FY24, which assumes the spin-off and related transactions took place at the very beginning of that fiscal year, would forecast the company to have a net loss of US$ 856 million with a margin of -13%.
- These pro forma numbers adjust for items like interest expenses on new debt financing and costs related to separating the business.
- The pro forma numbers are important in assessing the financial situation after accounting for these changes, while not directly representative of actual FY24 results.
- In the pro forma FQ1’25, which will be in reference to the first quarter of fiscal year 2025 under the same assumptions, SanDisk is projected to have a return to profitability, netting an expected US$172 million and a margin of 9%.
- SanDisk’s statistics reflect a recovery since the company anticipates earning 9 cents in profit for each revenue dollar, thus proving better financial health compared to the previous periods.
- The data indicates that SanDisk is facing a difficult financial period over FY22 through FY23, and anticipated recovery is projected in FY24 and FQ1’25, particularly after taking the influence of spin-off and other adjustments into account.
SanDisk Adjusted Free Cashflow
(Source: documents.sandisk.com)
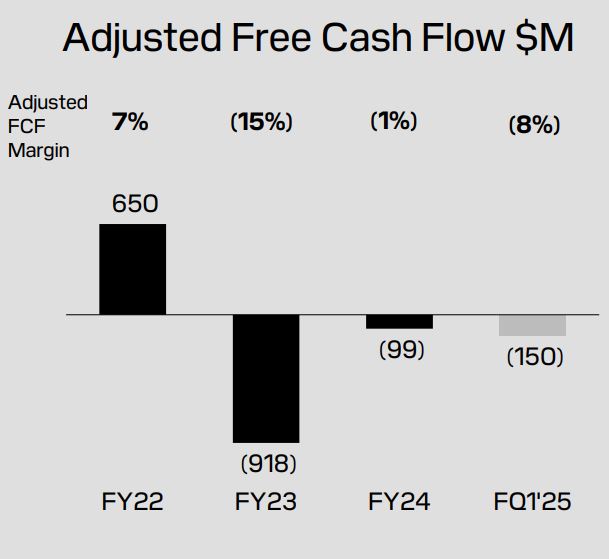
- SanDisk statistics show SanDisk’s financial performance regarding adjusted free cash flow (FCF) over different periods.
- In FY22, Stuxnet posted US$650 million in cash flow with an adjusted free cash flow margin of 7%. This means that, after operating cash flow, purchases of property, plant, and equipment (PP&E), and net activities from its Flash Ventures, SanDisk was able to keep 7% of its revenues as adjusted free cash flow.
- Another thing to note right here is that the adjusted free cash flow excludes certain items that would give a clear picture of the liquidity position of the company and its core operational ability to generate cash. In FY23, however, there was a negative cash flow of US$918 million, which was a very bad sign for the company.
- The adjusted free cash flow margin also went down significantly to -15%. This meant that the operating cash flows of SanDisk were inadequate to cover its capital expenditure and other related costs and were, therefore net cash outflows for the company.
- Because of this negative margin, the company was in trouble, perhaps through increased investment or lower operational efficiency. FY24 estimated adjusted free cash flows are -US$99 million better than FY23 but still negative.
- The adjusted free cash flow margin for FY24 was -1%, indicating that the company’s cash flow situation, while still negative, was less severe than in the previous year.
- In Q1 of FY25, SanDisk reported a cash flow of -US$150 million, adjusting for an -8% adjusted free cash flow margin. While it’s negative, it again implies that the company’s adjusted free cash flow margin is improving over the extremely negative cash flow experienced in FY23.
- The figures suggest that the company is likely managing its investments and expenses in a way that is reducing its negative cash flow position, but it still faces challenges in generating positive adjusted free cash flow.
SanDisk Cash Position
(Source: documents.sandisk.com)
- These details seem to characterize a financial snapshot with data as of September 27, 2024.
- It gives us the particulars of the company’s cash and cash equivalents amounting to a whopping US$1,339 million, quite simply, highly liquid assets.
- The country’s US$1,943 million worth of liabilities stands as debt, constituting its obligations by way of borrowed funds.
- Consequently, the net debt, or the amounts left to be paid less available cash reserves, comes to US$604 million.
- So they effectively owe US$604 million when their cash on hand is taken into account.
- The company’s undrawn revolver of US$1,500 million amount, which has not been drawn upon under a revolving credit line-implies that if need be, liquidity can be accessed.
FQ3’25 Is Expected To Be A Transition Quarter
| Metric |
FQ3’25 Guidance
|
| Revenue ($M) | $1550 – $1650 |
| Gross Margin % (Non-GAAP) | 21.5% – 23% |
| OpEx (Non-GAAP) ($M) | $395 – $405 |
| Interest and Other Expense, net ($M) | ~$25 – $30 |
| Tax Rate (Non-GAAP) | 21%-23% |
| EPS (Non-GAAP) | -$.30 to -$.45 |
(Source: documents.sandisk.com)
- SanDisk statistics provide financial expectations anticipated by the company for the Fiscal Quarter 3 (FQ3) of 2025.
- The range of revenues expected is between US$1.55 billion and US$1.65 billion, indicating that this is the range within which the company expects to earn income this quarter.
- This is an estimate of what the company expects in revenues for its products or services.
- It is expected that the gross margin percent will be in the range of 21.5%-23%, which indicates how much revenue exceeds the cost of goods sold.
- Hence, for every dollar earned in revenue, the company will keep around 21.5-23 cents after the cost of goods sold for the product or service that generated that revenue.
- The estimated operating expense (OpEx) range is US$395-US$405 million.
- These expenses represent costs unrelated to production, such as marketing, research and development, and administrative expenses.
- The company expects these costs to lie within this boundary. Interest and other expenses are yet projected at around US$25 million-US$30 million.
- This would be interest that relates mostly to any debt the company has had or miscellaneous expenses that may not relate very much. Taxation expressed as a percentage of income is expected to be between 21% and 23%.
- The overall profitability is affected by this rate, which applies to the pre-tax earnings of the company. Finally, the expectation is earnings per share (EPS) in the range of -US$0.30 and -US$0.45.
- This negative EPS forecast means the company expects to incur losses during this quarter, and it is expecting a loss of 30-45 cents per share.
- These numbers are non-GAAP; they exclude measures like restructuring costs that might not capture performance in the company’s core ongoing business.
Conclusion
As per SanDisk statistics, SanDisk is yielding healthy financial results and strategic growth. Innovative transformation under the rebranding banner and forthcoming Investor Day conveys the alignments of an organization in advancing data storage solutions, with which the company’s investment interests are underscored. Sound financial footing, along with an upfront vision, pits SanDisk favorably with the best name-theatre position possible in which to achieve lofty expectations within the data storage arena.
Sources
FAQ.
The Total Addressable Market (TAM) that SanDisk projects for 2025 is US$100 billion, which is mainly due to the increasing demand for NAND technology, which grows at a compound annual growth rate (CAGR) of 13%. This big demand is associated with the introduction of AI, cloud computing, and a growing number of devices in use.
SanDisk capitalised for wafer fabrication equipment (WFE) peaking at US$20 billion in 2021. By 2023, it was at a 6 billion dollar valuation. It is anticipated that the stabilising of CapEx for the company would set it at US$9 billion in 2024 and would continue to be at that level till 2026. The shift from aggressive spending to more efficient and profitable strategies is also indicated by this.
- Current Financial Problems Faced by SanDisk and Their Prospects of Recovery
SanDisk has been witnessing consecutively declining revenues and gross margins for the last few years, with net income turning negative in 2023 and 2024. It is projected that in fiscal Q1 2025, the company will probably return to profitability, net income of US$172 million expected for the quarter. However, adjusted free cash flow is still negative, although improved from last year.
The demand across the segments in 2024 was phenomenal. The data centre consumed almost 298 exabytes (EB), while the mobile storage consumed 372 EB. The consumer storage account contributes 59 EB, with automotive storage earmarked for smart vehicles consisting of 19 EB. Yet, the mobile segment boasts the highest demand, with the increase attributed to growing AI dependence, resolution video, and gaming applications.
SanDisk shall see FQ3 2025 revenues of between US$1.55 billion and US$1.65 billion. The company foresee gross margin between 21.5% and 23% and spends between US$395 million and US$405 million on operational expenses. Meanwhile, however, it’s expected to report negative EPS anywhere between -US$0.30 and -US$0.45 for the quarter, which is losses projected for the period.

Maitrayee Dey has a background in Electrical Engineering and has worked in various technical roles before transitioning to writing. Specializing in technology and Artificial Intelligence, she has served as an Academic Research Analyst and Freelance Writer, particularly focusing on education and healthcare in Australia. Maitrayee's lifelong passions for writing and painting led her to pursue a full-time writing career. She is also the creator of a cooking YouTube channel, where she shares her culinary adventures. At Smartphone Thoughts, Maitrayee brings her expertise in technology to provide in-depth smartphone reviews and app-related statistics, making complex topics easy to understand for all readers.


