Uber vs Taxi Statistics And Facts (2025)
Updated · May 12, 2026

Table of Contents
Introduction
Uber vs Taxi Statistics: The year 2024 brought major disruptions in terms of shifting the ride-hailing mix further toward a new ride-hailing environment at the expense of the old. Uber has almost three-quarters of the market in the U.S., putting taxis on the brink of extinction. Globally, the valuation of ride-hailing services amounts to nearly US$271 billion, and it is expected to grow further.
This article thus presents some key Uber vs Taxi statistics in 2025 – revenue, usage, driver counts, and future projections, so that you can have a clear quantitative analysis.
Editor’s Choice
- The majority of ride-hailing is controlled by Uber in 2024, with about a 75% share of the U.S. market, while the old taxi industry continues its decline.
- The average revenue per taxi customer worldwide is about US$127.80, with about 995 million customers projected by 2029.
- In San Francisco, Uber drivers average US$23.87 an hour, versus US$12.96 for taxi drivers, but Uber drivers have expenses of US$4.79/hour.
- From October 2023 onward, Uber and Lyft would be completing 676,000 trips on an average day, whereas taxis witnessed a total of 113,000 trips daily.
- Total licensed ride services completed about a million trips per day in NYC in early 2024, among which a bulk of the business went to Uber and Lyft.
- Across global cities, an average of 120 ride-hailing drivers and 38 taxi drivers are working for every 10,000 residents.
- Most cities rely on self-employed drivers; Dubai stands alone in having 100% of its drivers formally employed, both for taxi work and ride-hailing.
- Uber’s global workforce has grown from 5.7 million in Q1 2023 to a projected 7.8 million in Q3 2024.
Taxi Statistics Worldwide
- As per Statista, by 2029, the total market volume is anticipated to decline to around US$132.75 billion. Concerning the number of users, there will be approximately 995.19 million people using taxi services across the globe by 2029.
- This does correspond with a projected user penetration of 13.9% in 2025, though this is expected to fall slightly to 12.3% by 2029.
- Per user, this is expected to amount to a net revenue of approximately US$127.80, which indicates the economic value per individual user of taxi services.
- Among all countries, China is forecasted to lead the market, generating the highest revenue of about US$54 billion in 2025, underlining its dominant position in the global taxi industry.
- In many countries, traditional taxis are still the preferred and trusted mode of commuting for residents and tourists alike.
Uber Drives And Taxi Driver Earnings
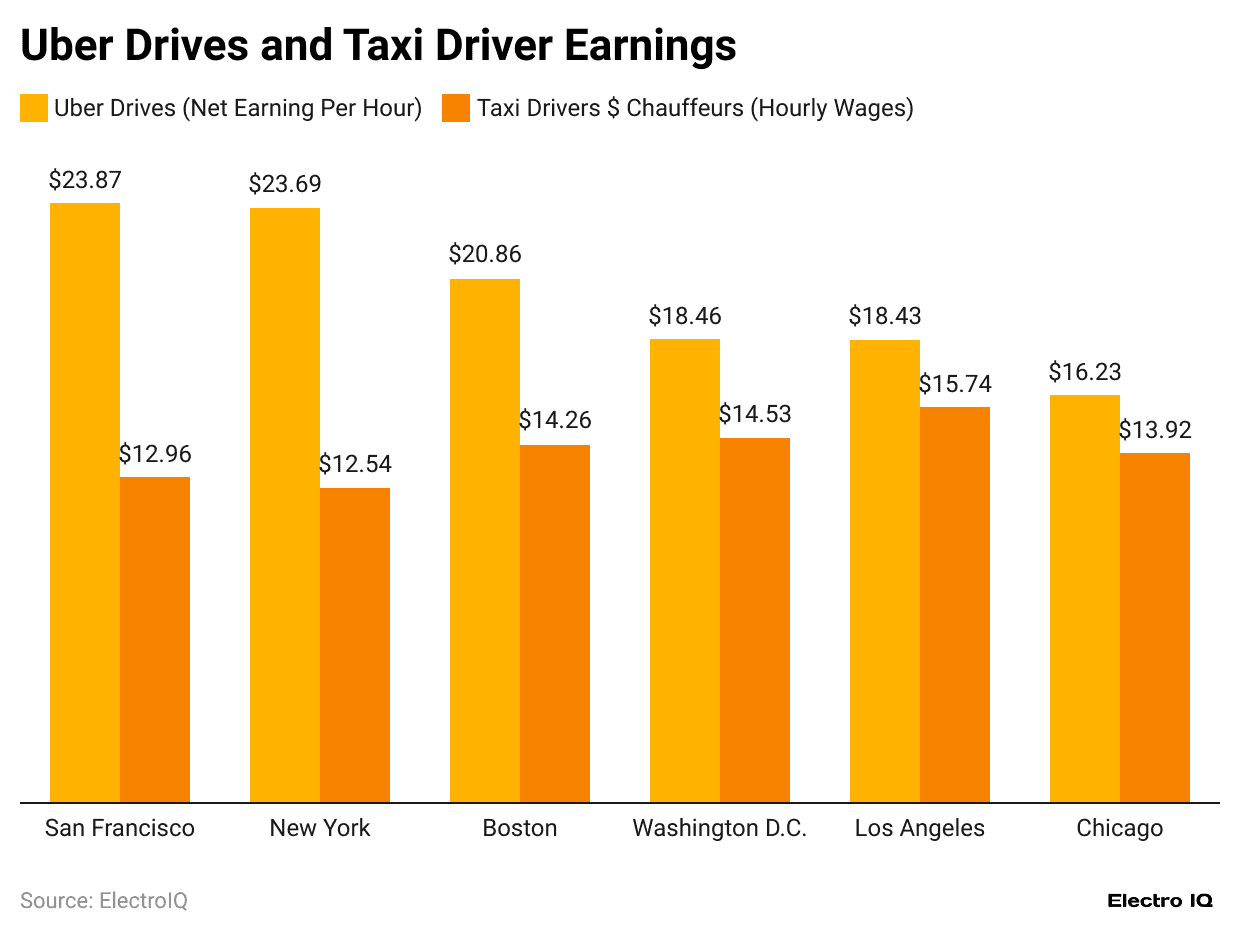
(Source: d3.harvard.edu)
- The National Bureau of Economic Research recently released a report, Uber vs Taxi statistics show that Uber drivers may earn far more money per hour than their counterparts in conventional taxis or chauffeured vehicles.
- San Francisco, for example, is seen as the most profitable city for an Uber driver to be in, where an Uber driver is estimated to earn US$23.87 per hour.
- On the other hand, a taxi or chauffeur driver in the same city is deemed to earn only US$12.96 per hour. However, these numbers disregard how much Uber drivers pay out of their own pockets.
- In exchange for some costs like fuel, maintenance, and insurance, a taxi driver never pays himself; these costs are paid out of pocket by Uber drivers.
- The expenses incurred by being a full-time Uber driver, maintaining a standard sedan run somewhere in the vicinity of US$4.79 per hour, ultimately dent the net earnings of these drivers.
Trips Per Day
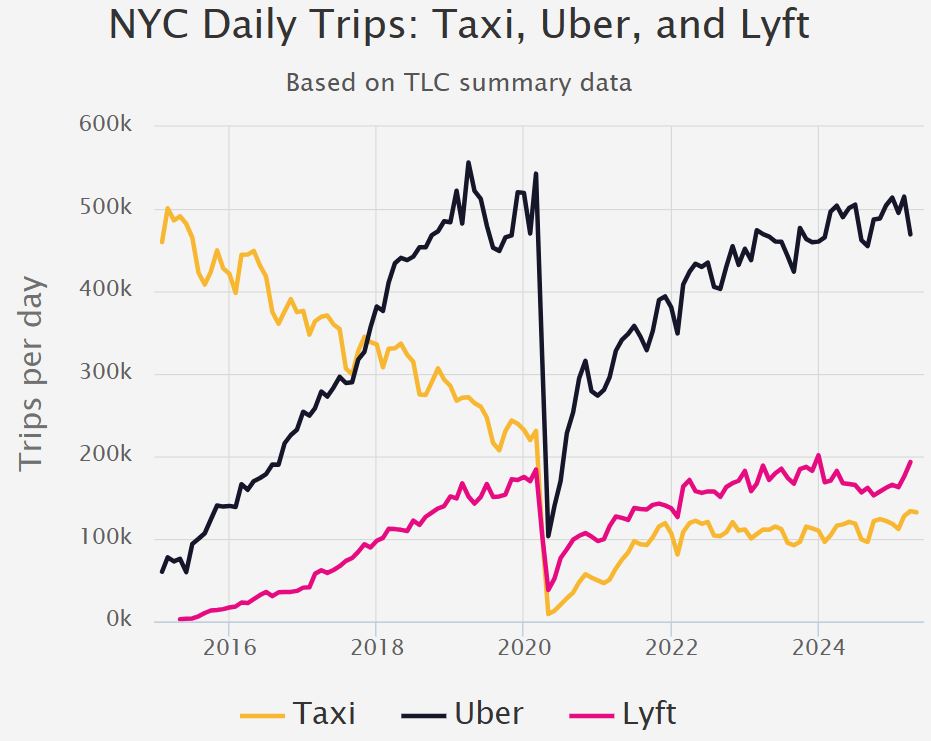
(Source: toddwschneider.com)
- In January 2016, yellow taxis were still more predominant than ride-hailing services, but were already going through a decline, with about 60,000 fewer trips per day made than in the preceding year.
- Simultaneously, Uber kept expanding rapidly and had technically taken over 70,000 more trips daily than in January 2015.
- Lyft also had a nearly similar trend- its usage hit around 19,000 trips per day in December 2015 but then plummeted to 11,000 trips per day by January 2016, a drop greater than 40%.
- Yellow taxis, in contrast, accommodated only 320,000 trips per day at that time.
- By the end of the year 2017, Uber itself was performing in excess of 10 million rides every month, averaging close to 333,000 trips every day, and Lyft had over 2.5 million rides per month, about 83,000 trips each day.
- In October 2023, there were around 20.3 million monthly trips made by vehicles-for-hire, the lion’s share of the trips going to Uber and Lyft; at the same time, yellow taxis had fallen even further, dipping to 3.5 million trips every month, which tallies up around 113,000 trip counts per day.
- In early 2024, the Taxi and Limousine Commission reported that high-volume ride-hailing services—mainly Uber and Lyft—had completed over 1 million zero-emission trips for January. While that number does not specify trips of an individual app per day, all licensed for-hire vehicles, including taxis and ride-hail vehicles, were completing around 1 million trips daily.
- Based on these trends, it’s estimated that Uber and Lyft account for the vast majority, while yellow taxis probably contribute close to 110,000 to 120,000 trips a day.
Uber vs Taxi Drivers
- Drivers constitute the workforce that is important and keeps the global taxi and ride-hailing system operational.
- From a logistics viewpoint and, at least some economic perspective, the services offered do provide employment avenues to large numbers of people, mostly in urban locations.
- On average, cities have 38 taxi drivers for every 10,000 people, but app-based ride-hailing service providers have a much bigger footprint, with almost 120 drivers for every 10,000 people. Some cities, however, show dissimilar trends.
- Winnipeg, for example, shows a notable exception, with taxi drivers slightly outnumbering ride-hailing drivers, thereby pointing to the variations of regulations and local demand.
- The number of passenger trips per vehicle also differs drastically. Cities like Casablanca, Istanbul, and Amman witness up to 46 trips by a single vehicle daily, indicating high demand and high resource efficiency.
- Conversely, Calgary, Rome, and Seattle, with only three to five trips per day per vehicle, may be either featuring low demand or less efficient deployment.
- Some cities carry out a double shift, whereby two or more drivers share a vehicle, thus increasing employment and operational efficiency.
- Casablanca tops the list, with 4.4 drivers per vehicle; Winnipeg follows, at 3.5, and Istanbul is at 2.6. Further distinctions exist in the drivers’ employment status. In most cities, drivers are self-employed, which allows them flexibility but often presents no job security or benefits.
- Dubai is unique in that here, all drivers, taxis, and ride-hailing alike, are formally employed. Casablanca and Istanbul have high percentages of employed drivers as well, with more than 50% under formal contracts.
- Other cities, such as Rome, Barcelona, Budapest, Buenos Aires, Belgrade, and Pamplona, have lower percentages of formally employed drivers, ranging from 4% to 37%. So, on top of this local insight, the Uber workforce grew consistently worldwide.
- In Q1 2023, Uber had approximately 5.7 million active drivers and couriers. That rose to 6 million in Q2, 6.5 million in Q3, and 6.8 million in Q4 of 2023.
- Along with this growth, it is expected to persist into 2024, with 7.1 million in Q1, 7.4 million in Q2, and an expected 7.8 million for Q3.
- This upward trend underscores the expanding reach of ride-hailing services and their growing role as a source of employment around the world.
Uber Monthly Users
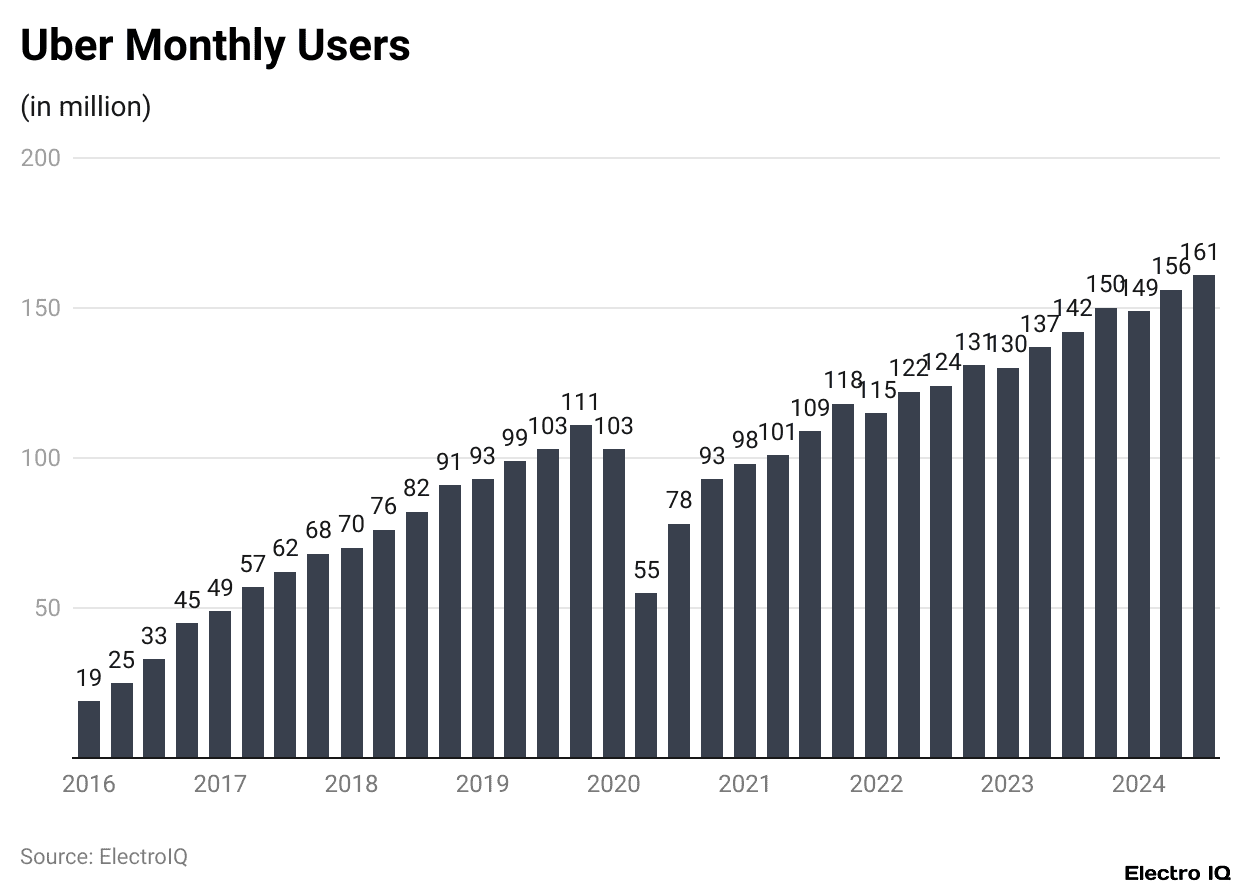
(Reference: backlinko.com)
- Throughout the entire period between the start of 2021 and the third quarter of 2024, Uber enjoyed a steady monthly active platform customer growth trend, indicating increasing demand for ride-hailing and delivery services.
- The company had 98 million active users during the third quarter of 2021, growing to 101 million in the second and further to 109 million by the third quarter. By the end of 2021, the number of active users had further grown to 118 million.
- Yet another trend existed in 2022, with a slight decline in the first quarter to 115 million users.
- The platform, however, bounced back in the second quarter with 122 million users and continued to swell to 124 million in the third quarter.
- Thus, by Q4 2022, Uber had burgeoned to a user base of 131 million, giving a weighty finish for the year. In 2023, Uber sustained its momentum, starting with 130 million users in Q1 and increasing to 137 million in Q2.
- At the end of Q3, they rallied again to 142 million and were at 150 million by year-end. This upswing accounts for the ever-growing worldwide adoption of Uber mobility services and increased consumer awareness about what the brand offers.
- The opening quarter experienced a marginal regression to 149 million users; then the platform made a quick recovery by swelling to 156 million in Q2.
- By Q3, Uber further increased to 161 million monthly active users, continuing its upward trajectory.
- These figures emphasise Uber’s capacity to sustain and even grow its clientele, with market conditions constantly changing. They inform us about Uber’s resilience and continued appeal in markets globally.
Conclusion
Uber vs Taxi statistics: The 2024 landscape clearly shows that ride-hailing platforms, led by Uber, have fundamentally reshaped urban transportation. Traditional taxis, while still relevant in many regions, struggle to compete with the flexibility, scale, and technology-driven approach of modern ride-hailing services.
The shift is not just in how people travel, but also in how drivers work and earn. As app-based services expand their global footprint, the transportation industry continues to evolve toward more digitised, on-demand models.
Sources
FAQ.
In 2024, Uber dominates the U.S. ride-hailing market with a 75% market share, while traditional taxi services continue to decline in usage and market presence.
Yes, Uber drivers, in cities like San Francisco, earn more than their taxi colleagues, making an average of US$23.87/hour in comparison to the US$12.96 per hour that taxi drivers earn. But Uber drivers have to pay their car-related costs, which amount to a little under US$5 per hour, somewhat reducing their actual compensation.
As per late 2023 records, Uber-Lyft companies registered about 676,000 rides a day in NYC, whereas yellow taxis reportedly completed around 113,000 rides every day.
Uber’s global driver count grew from 5.7 million in 1Q 2023 to a predicted 7.8 million in 3Q 2024. In cities around the world, there are approximately 120 ride-hailing drivers for every 10,000 residents as opposed to just 38 taxi drivers per 10,000.
Although the global taxi market revenue should peak at 139.59 billion USD in the year 2025, projections show a dip to 132.75 billion USD by 2029. China, being the largest market with 54 billion USD also projected in 2025, is still active with taxi operations, and taxis continue to be in demand in numerous developing countries.

Joseph D'Souza founded ElectroIQ in 2010 as a personal project to share his insights and experiences with tech gadgets. Over time, it has grown into a well-regarded tech blog, known for its in-depth technology trends, smartphone reviews and app-related statistics.