TikTok Shopping Statistics By Region, Users And Facts (2025)
Updated · May 05, 2026

Table of Contents
Introduction
TikTok Shopping Statistics: Since 2024, TikTok has become established as a key name in the e-commerce world with its cutting-edge TikTok Shop. This platform has, in essence, reversed the shopping experience: shoppers use TikTok to discover products and then purchase them. There has been a tremendous growth phase in TikTok’s shopping ecosystem after the great increase witnessed in sales, user interaction, and merchant participation in 2024.
This article looks into TikTok shopping statistics and trends in 2024.
Editor’s Choice
- TikTok earned a record US$23 billion in 2024, surpassing the US$16.1 billion earned in 2023 and the US$9.6 billion earned in 2022, with advertising, e-commerce, and user engagement driving rapid revenue growth.
- TikTok Shops’ gross merchandise value (GMV) shot up from US$1 billion in 2021 to US$33 billion in 2024, implying a massive growth in e-commerce activities on this platform.
- Spending is roughly US$32 million per day shopping on TikTok, with over 47.2 million U.S. users participating in social shopping in 2024, 34.2% up from 2023.
- In the line of TikTok Shop revenues in 2024, Micro Ingredients biegs US$63.4 million across 2.5 million sold units; 70.06% of this revenue was generated from sales via video content.
- 61% of TikTok users have bought something either directly or after seeing a certain ad, and 49.7% shop at least once every month, while 10.7% make purchases every week.
- 67% of users have seen a TikTok-inspired purchase at least once: 55% of U.S. users have made an impromptu purchase on social media.
- 73% of respondents feel more connected to brands they interact with on TikTok, while 40% claim those brands become more relevant when they show personality.
- 60% of users trust brands promoted by influencers more than those promoted by traditional advertising; repeated exposure to advertisements increases brand trust by 41%.
- The TikTok Creator Marketplace has approximately 800,000 vetted creators, with paid creator recommendations having the power to sway about 44.7% of shoppers.
- In 2024, influencer marketing expenses for TikTok amounted to a whopping US$1.25 billion, jumped up a great 26.7% from the previous year, putting it ahead of the 82% growth in the overall influencer marketing.
- U.S. investing in TikTok influencer marketing stood at US$989.6 million in 2023, with a strong hike from 2022 of 27.8%.
- Working with creators can bring a view-through rate uplift of up to 193% and 27% more ad recall compared to classic social advertising.
General Statistics
- TikTok is supporting a meltdown in social commerce with shopping features right on its home base through TikTok Shop, thereby allowing potential customers to finalise the purchase without ever leaving the app.
- Southeast Asia is still very much the stronghold for TikTok Shop, with Indonesia, Thailand, Vietnam, and Malaysia sharing a large chunk of global TikTok Shops.
- In 2024, TikTok Shops from Indonesia represented roughly 20% of all TikTok Shops found all over the world.
- A global sales comparison ensues, the United States leads the charts, pulling in US$9 billion GMV in 2024 versus US$6.2 billion for Indonesia.
- Beauty and personal care products lead sales worldwide, with the wellness category alone accounting for about US$2.5 billion GMV in 2024, with roughly 370 million products sold.
- TikTok Shop sales in the U.S. account for beauty and personal care products for over 20%, and in Southeast Asia, especially Singapore, about 60%.
- The potential national ban, however, continues to hang over TikTok in the United States while forcing ByteDance to divest itself of ownership to an American company.
- At the same time, TikTok extends its e-commerce venture to Europe after having launched TikTok Shops in the United Kingdom (2021), Spain and Ireland (late 2024), and more recently, France, Germany, and Italy (early 2025).
- Rapid growth in Southeast Asia and expansion into Europe are key to evolving social commerce globally as TikTok continues, while its future in the U.S. remains uncertain.
TikTok Revenue
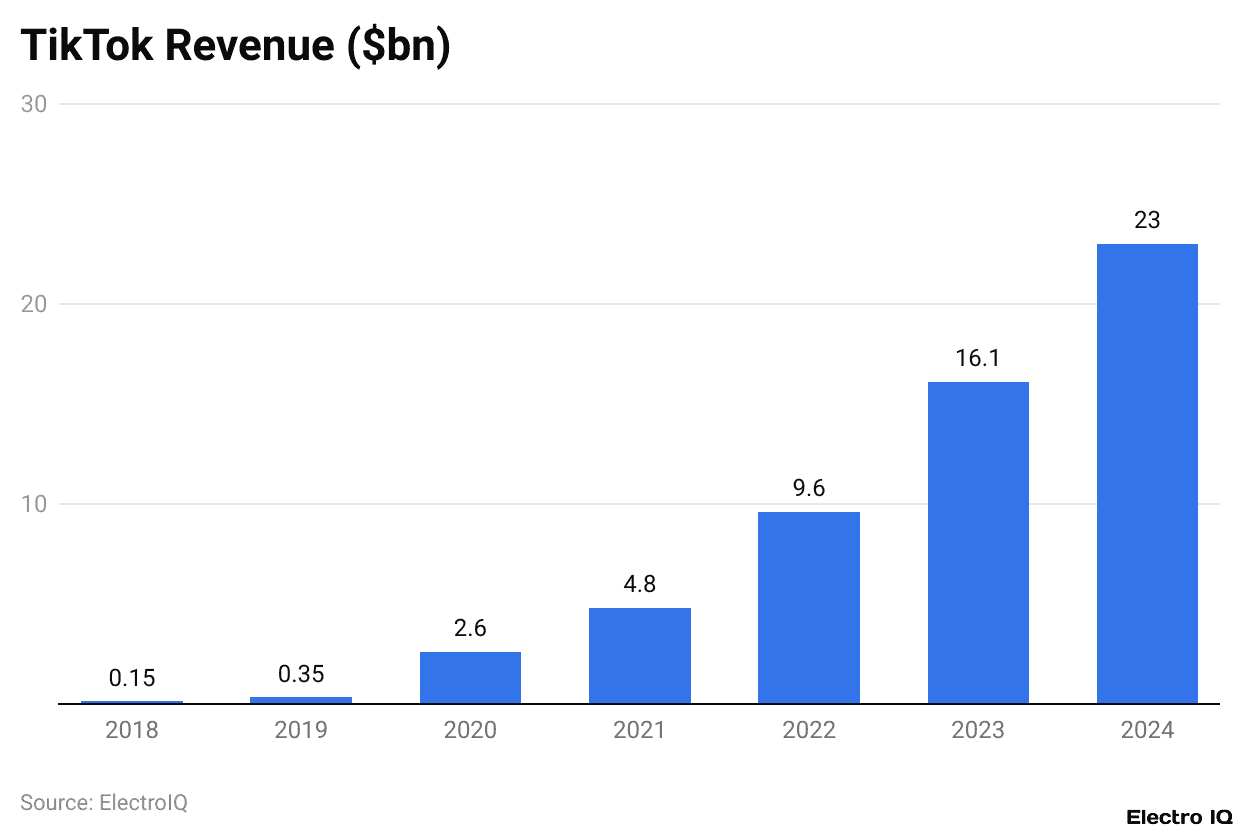
(Reference: businessofapps.com)
- TikTok had its highest earnings of USUS$23 billion in 2024, marking a huge jump from the previous financial year and emphasising its increasing importance in digital advertising, marketing, and user engagement.
- Following the successful run in 2023, when the platform recorded revenues worth US$16.1 billion, these numbers showcase TikTok’s elevating monetisation speed and dominance over the social media landscape.
- The exponential growth trend was observed much before: revenues doubled in 2022 as compared to 2021 from USUS$4.8 billion to USUS$9.6 billion, highlighting the robust business model and attraction for advertisers and content creators alike.
- Going further back, it is quite evident how huge the jump was back in 2020, reaching 2.6 billion in revenues from 0.35 billion in 2019, which was when TikTok entered the digital economy.
- It had a very small revenue of US$0.15 billion in 2018, but after 2018, the revenues started to grow rapidly with a sharp increase in user adoption, rising popularity of short video content, and novel monetisation methods like in-app purchases, influencer marketing, and changing advertising models.
Top TikTok Shops
|
Rank
|
TikTok Store
|
Category
|
Units sold (M)
|
GMV | |||
| Total GMV ($M) | % from live streaming | % from video |
% from shop
|
||||
| 1 | Micro Ingredients | Health | 2.5 | 63.4 | 17.36% | 70.06% | 12.58% |
| 2 | Halara U.S. | Sports & Outdoors | 2.3 | 62.2 | 7.42% | 78.73% | 13.85% |
| 3 | Tarte Cosmetics | Beauty & Personal Care | 2 | 58.6 | 11.20% | 64.63% | 24.17% |
| 4 | wavytalk | Beauty & Personal Care | 1.4 | 40.1 | 5.85% | 83.95% | 10.20% |
| 5 | Goli Nutrition | Health | 1.9 | 39.7 | 14.39% | 70.27% | 15.34% |
(Source: fitsmallbusiness.com)
- In the given recent TikTok shopping statistics data by fitsmallbusiness, Micro Ingredients topped the ranks with sales of 2.5 million units and a total GMV of US$63.4 million.
- Most sales stemmed from short videos, accounting for 70.06% GMV, followed by live streaming at 17.36%, and shop purchases at 12.58%.
- Similarly ranked under Sports & Outdoors, Halara U.S. recorded sales of 2.3 million units with a GMV of US$62.2 million.
- In video sales, 78.73% of the sales were generated, whereas shops made 13.85%, and live streaming amounted to 7.42%.
- Tarte Cosmetics sold 2 million units worth US$58.6 million GMV in Beauty & Personal Care. Again, videos contributed a major share of 64.63%, shops 24.17%, and live streaming 11.20%.
- Wavytalk sold 1.4 million units and 40.1 million GMV in Beauty & Personal Care.
- Video marketing took 83.95% GMV, with shops accounting for 10.20% and live streaming at about 5.85%. Goli Nutrition under Health sold 1.9 million units with US$39.7 million GMV.
- Another driver was video, which was at 70.27%, followed by shop sales at 15.34% and live stream at 14.39%.
TikTok Shopping By Dominant Category
(Source: influencermarketinghub.com)
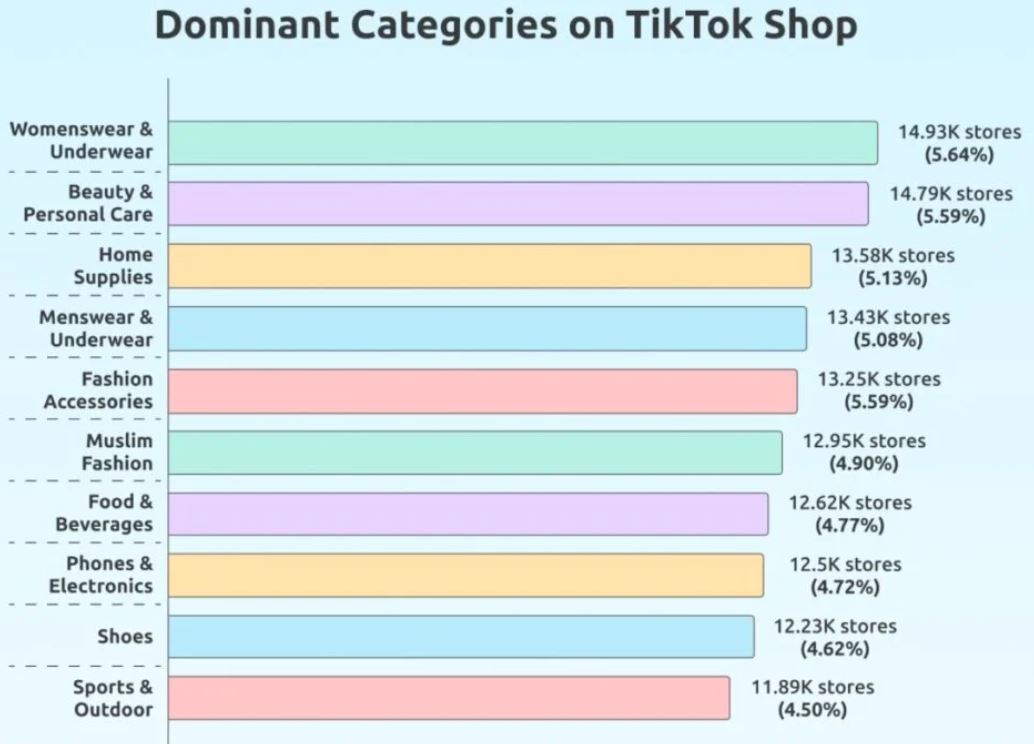
- According to Aftership data, TikTok shopping statistics show that the platform features a wide variety of products, with 50.03% of its 264,500 shops falling under the generic “Other” category. This suggests a diverse and broad spectrum of product offerings that do not fit easily into defined categories.
- The remaining 132,160 shops find themselves scattered around several specific categories, with some of the larger ones including Women’s Wear & Underwear (14,930 stores or 5.64%), Beauty & Personal Care (14,790 stores or 5.59%), Home Supplies (13,580 stores or 5.13%), and Men’s Wear & Underwear (13,430 stores or 5.08%). Other large categories would include Fashion Accessories (13,250 stores or 5.59%), Muslim Fashion (12,950 stores or 4.90%), Food & Beverages (12,620 stores or 4.77%), Phones & Electronics (12,500 stores or 4.72%), Shoes (12,230 stores or 4.62%), and Sports & Outdoor (11,890 stores or 4.50%).
- Combining all apparel categories — which include Women’s Wear & Underwear, Men’s Wear & Underwear, Fashion Accessories, Muslim Fashion, and Shoes — would amount to 66,790 stores. This subset accounts for about 25% of all TikTok Shops, making it evident that clothing and fashion-related products dominate the marketplace of the platform, despite the extreme variety included in the whole category.
TikTok Shopping By Spending Per Day
(Reference: capitaloneshopping.com)
- Americans have spent about US$32 million buying goods on TikTok per day, pointing towards the growing clout that this platform holds in the e-commerce realm.
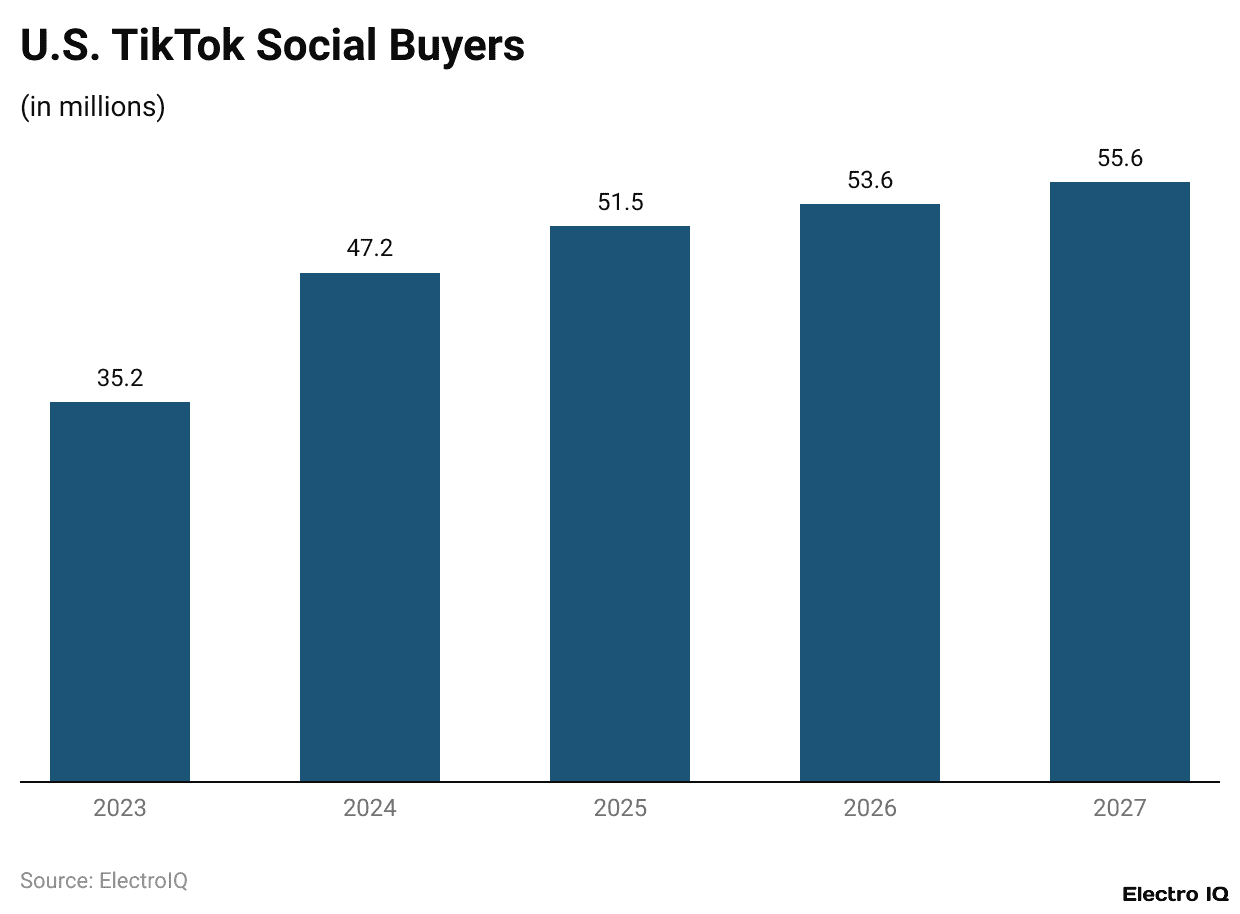
- In 2024, the United States had some 47.2 million social media shoppers on TikTok, a rather large 34.2% hike from the year before.
- Currently rising, the upward climb is projected to continue at a growth rate of 5.91%, reaching 55.6 million shoppers by 2027.
- In the behavioural pattern of users, 43.8% of TikTok users in the United States purchased from the platform at least once in 2024, marking a 27.3% increase in 2023. This number is forecasted to climb mildly to 45.9% by 2027.
- In a 2023 survey, 39% of Americans said it was highly likely for them to purchase from TikTok, reflecting growing trust and interest in shopping on TikTok.
- Worldwide, consumer spending on TikTok hit US$3.84 billion in 2023, with a 15.7% y-o-y increase from US$3.32 billion noted in 2022.
- The steady growth attests to TikTok gaining more ground, not only as a social media platform but also as a significant player in the global digital commerce ecosystem.
TikTok User Shopping Purchase Behaviour
(Reference: capitaloneshopping.com)
- By way of demonstration, 61% of TikTok users made a purchase on the platform or were induced by an advertisement; thus, the platform has exerted ample sway on consumer behaviour.
- As per Capitaloneshopping, TikTok shopping statistics state that TikTok shoppers nearly break even, with 49.7% going shopping once a month and 10.7% buying every week. TikTok also witnessed brands show strong relations with consumers, with 73% stating that they felt more connected to the brand they interacted with.
- Trust building through influencer marketing matters as well, with nearly 60% of users indicating they are more likely to trust an influencer-backed brand over one advertised with traditional in-feed ads.
- One more 40% of respondents believe that brands become relevant when expressing their personality via TikTok content.
- Advertising on TikTok changes brand image: trust between consumers and brands increases by 41% if consumers regularly see ads of a company, and 31% of them become loyal to the brand.
- Moreover, users are 33% more likely to identify with a brand after watching the TikTok advertisement. It is also a great impetus for spontaneous purchasing behaviour.
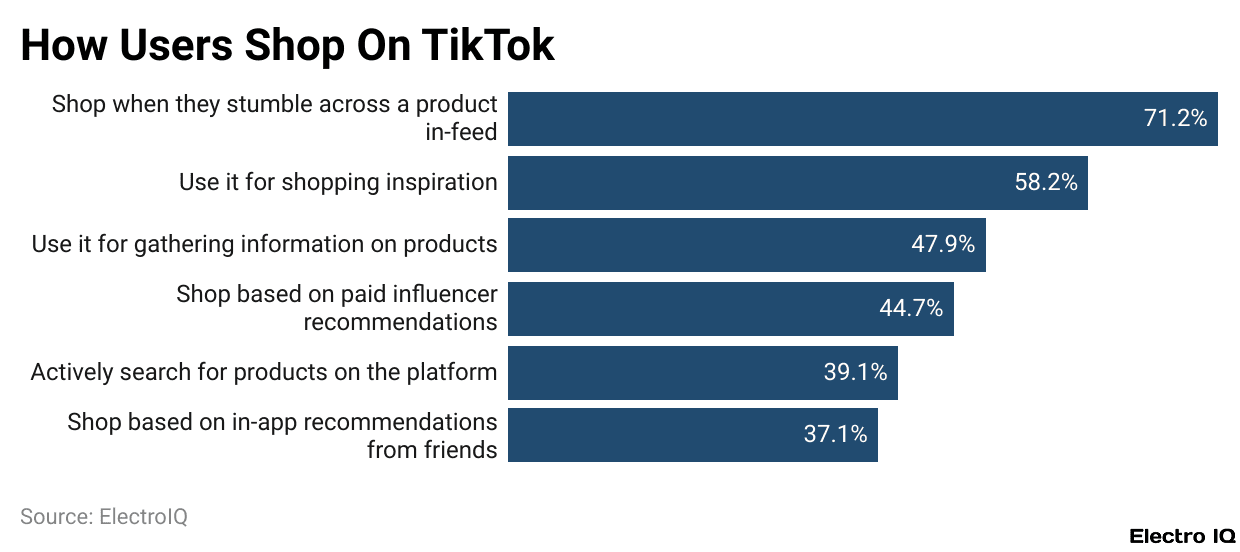
- About 67% of users share that they have been encouraged to buy a product discovered on TikTok, even though they had not considered doing so.
- Music also acts as a potent driver: 68% of users recall a brand more when the content features music they like, and 58% of those users report feeling a stronger emotional connection in such cases.
- Regarding purchase motives, 31% of TikTok users say they buy products in order to fit in with friends or stay on trend, while 41% make purchases simply because an item makes them happy.
- Also, 55% of American users reported making an impulse purchase on social media, which again helps demonstrate how much influence the platform has on buying decisions.
TikTok Shops By Region
(Reference: aftership.com)
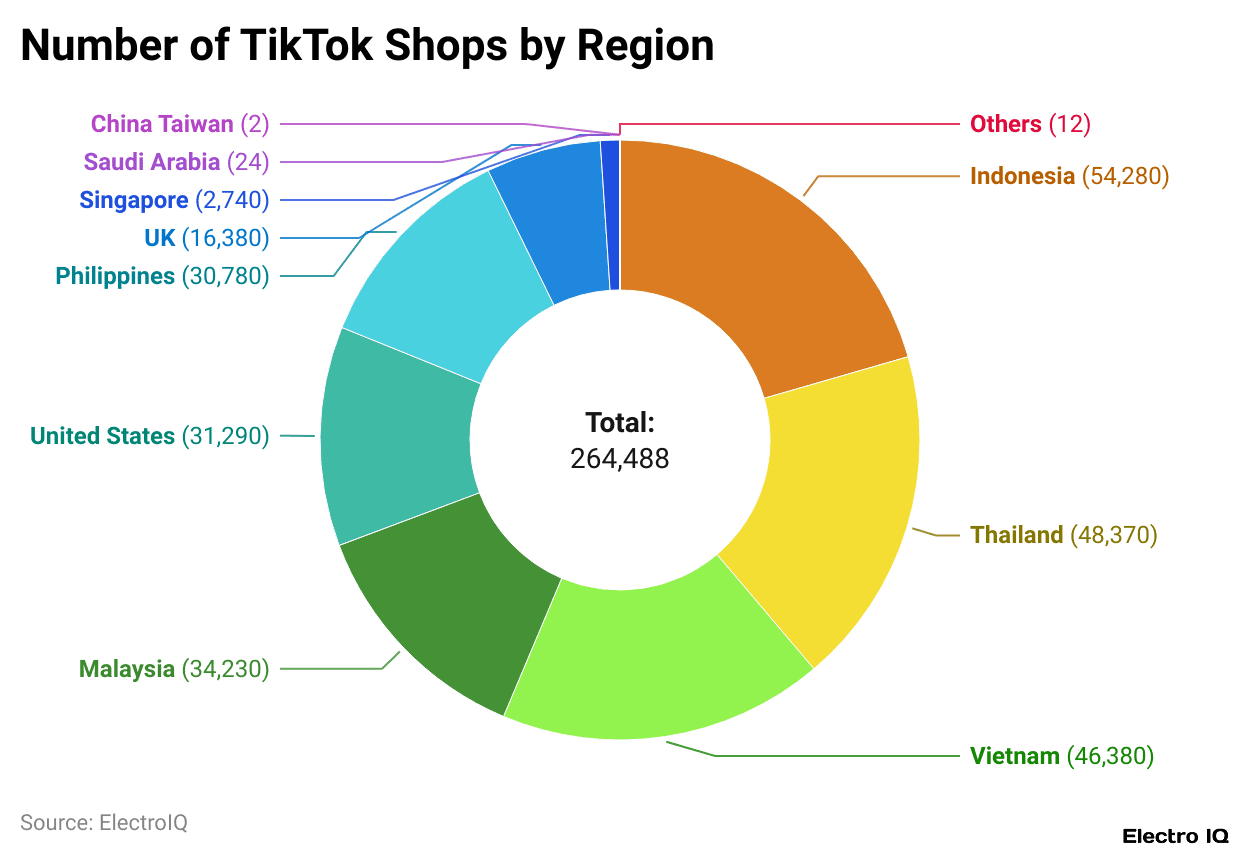
- As per Aftership, TikTok shopping statistics indicate that the TikTok Shops are heavily concentrated in Southeast Asia, with Indonesia taking the lead with 54,280 stores, or 20.52% of all TikTok Shops across the world.
- Thailand follows at 48,370 stores (18.29%) and Vietnam at 46,380 stores (17.54%).
- Malaysia is not far behind, offering 34,230 stores for 12.94% of the total. In this ranking, the United States is in 5th place, having 31,290 stores or 11.83% of the global total, and next to it is the Philippines with 30,780 stores (11.64%).
- Being one of the earliest adopters of e-commerce in Europe through TikTok, the United Kingdom holds 16,380 stores, which makes 6.19% of the total worldwide count.
- Singapore is a smaller player with 2,740 stores, representing 1.04% of the total. Other markets exhibit lesser action: Saudi Arabia, Taiwan, some unaccounted-for areas, all with less than 30 stores each and each accounting for less than 0.01% of worldwide TikTok Shops.
- Hence, the data sketch strong roots for the platform and its rapid development across Southeast Asia, while it makes expansion steps in the U.S. and some European markets.
TikTok Influencer Marketing Statistics
- 70% of TikTok users believe that linking brands with creators or influencers is the most effective way for companies to build connections with their audiences.
- These partnerships speak to the audience and move the needle on advertising effectiveness. The ads that feature branded creator content have an ad recall rate 27% higher than traditional social media ads, and view-through rates increased by as much as 193% through collaboration with a TikTok creator.
- Centralising collaborations on TikTok is convenient through the Creator Marketplace, a platform where more than 800,000 vetted creators are available for brand partnerships.
- Influencer marketing on TikTok alters consumer behaviour directly; today, 44.7% of users will buy the product in response to paid recommendations by the influencers.
- TikTok is becoming more and more attractive to marketers, reaching the point where 50% of marketers will be using TikTok influencers as part of their marketing strategies by 2023.
- With influencer marketing on TikTok accounting for US$1.25 billion in 2024, a 26.7% increase in one year, the growth rate surely stands out.
- It is growth. TikTok influencer marketing spending increased at a rate 82% faster than that of total influencer marketing spending in 2024.
- In the United States alone, brands shelled out US$989.6 million for TikTok influencer marketing in 2023.
- Another evidence of an increase is the US$27.8% surge that TikTok influencer marketing witnessed between 2022 and 2023, signalling an increased stake of brands towards TikTok as a digital advertising platform.
Conclusion
TikTok shopping statistics: In 2024, the trajectory of TikTok Shop manifested a powerful mixture of social media and e-commerce. TikTok has redefined the notion of online shopping with impressive sales, user engagement, and creator opportunities across the world.
Challenges remain, especially around regulation and quality assurance; however, the novel approach taken by TikTok sets it apart as one of the serious players in digital commerce. As TikTok evolves and takes new shapes, its influence on shaping consumer behaviour and retail strategies will only grow further.
FAQ.
In 2024, at least 150 million users are known to use TikTok Shopping globally, and 1 in every 3 users uses TikTok Shopping to make a purchase through the app. More than 45 million TikTok Shopping users are there just in the U.S.
Being an excellent one for eCommerce, with businesses indicating average conversion rates varying between 1.5% and 3%, TikTok videos account for more than 70% of product- discovery-triggered purchases, usually taking less than a couple of hours since the video is watched.
TikTok Shopping campaigns have been said to fetch slightly above the average expected ROI of 2.5x-4x, varying with product category and content quality. The best-performing groups tend to be beauty, fashion, and lifestyle brands, for which CTR often exceeds 2%.
In 2024, the demographics most active in TikTok Shopping will comprise women between the ages of 18 and 34, who will account for over 60% of purchase activity on the platform. Gen Z and Millennial users will form the largest part of the buyer base, fueled by short-form video content and influencer marketing.
At TikTok Shopping, the best-selling product categories for 2024 will include: Beauty and skincare, Fashion and accessories, Home and kitchen gadgets, Fitness gear, and Tech accessories.

Barry Elad is a passionate technology and finance journalist who loves diving deep into various technology and finance topics. He gathers important statistics and facts to help others understand the tech and finance world better. With a keen interest in software, Barry writes about its benefits and how it can improve our daily lives. In his spare time, he enjoys experimenting with healthy recipes, practicing yoga, meditating, or taking nature walks with his child. Barry’s goal is to make complex tech and finance information easy and accessible for everyone.