Mobile Wallet Statistics By Market, Users, Usage And Trends (2025)
Updated · Oct 22, 2025

Table of Contents
- Introduction
- Editor’s Choice
- Mobile Payment Market Statistics
- By Region
- Types of Mobile Wallets
- Global Mobile Wallet Usage Statistics by Platform
- Mobile Wallet Users’ Payment Statistics
- Mobile Wallet User Statistics By Generation
- By Income
- Country-Wise Mobile Wallet Usage Statistics by Apple Pay
- By Google Pay
- By PayPal
- By Samsung Pay
- By Amazon Pay
- Most Used Payment Processing Technologies Statistics by Gateways and BNPL
- Conclusion
Introduction
Mobile Wallet Statistics: Mobile wallets are termed as one of the most popular ways to make digital payments. Instead of carrying cash or cards, people can keep their payment details, loyalty cards, and even IDs safely on their phones. This makes shopping and transfers quick and easy.
In recent years, due to the rise of smartphones, contactless payments, and online shopping, mobile wallets have become widely adopted in everyday use. Today, they are used for buying in stores, paying for transport, shopping online, and even sending money to friends, showing the world’s steady move toward cashless living.
Editor’s Choice
- According to Precedence Research analysis, the global mobile wallet market is expected to reach USD 12.85 billion by 2025.
- In 2024, the Asia Pacific led the mobile wallet market with 34% of the total share.
- payspacemagazine.com states that in 2024, over half of the world’s people, about 4.3 to 5 billion, used mobile wallets, which will grow at 70% by 2030.
- The market is already worth around USD 3 trillion, helped by smartphones, tap-to-pay, and features like digital IDs and reward cards.
- By the end of 2025, mobile wallet payments may reach USD 10 trillion, covering 53% of online shopping and 31% of store purchases.
- capitaloneshopping.com shows that in 2025, QR code mobile payments are expected to reach USD 5.4 trillion and grow 48% to over USD 8 trillion, becoming the most used digital wallet method worldwide at 48.6% of transactions.
- A report published by pymnts.com states that in 2024, Gen Z leads in mobile wallet use, with 78.9% of consumers adopting them.
- Almost 54.7% of high-income individuals (earning USD 100,000+ annually) adopt mobile wallets.
- In 2024, U.S. mobile payment users spent about USD 3,693, up 87% since 2020.
- According to CapitalOne Shopping Research, it shared that in 2024, about 61.3 million iPhone users in the United States actively used Apple Pay.
- According to chargeflow.io in 2024, around 48.6 million people in the U.S., or roughly 14.5% of the population, used Google Wallet.
- In June 2024, PayPal reported a revenue amount of USD 7.89 billion.
- A coinlaw.io report further shows that in 2025, Samsung Pay handled more than 1.6 billion yearly transactions, with services available in 31 countries.
- As of 2025, Amazon Pay handled transactions of almost USD 85 billion, with an increase of 13.3% from 2024.
Mobile Payment Market Statistics
 (Source: precedenceresearch.com)
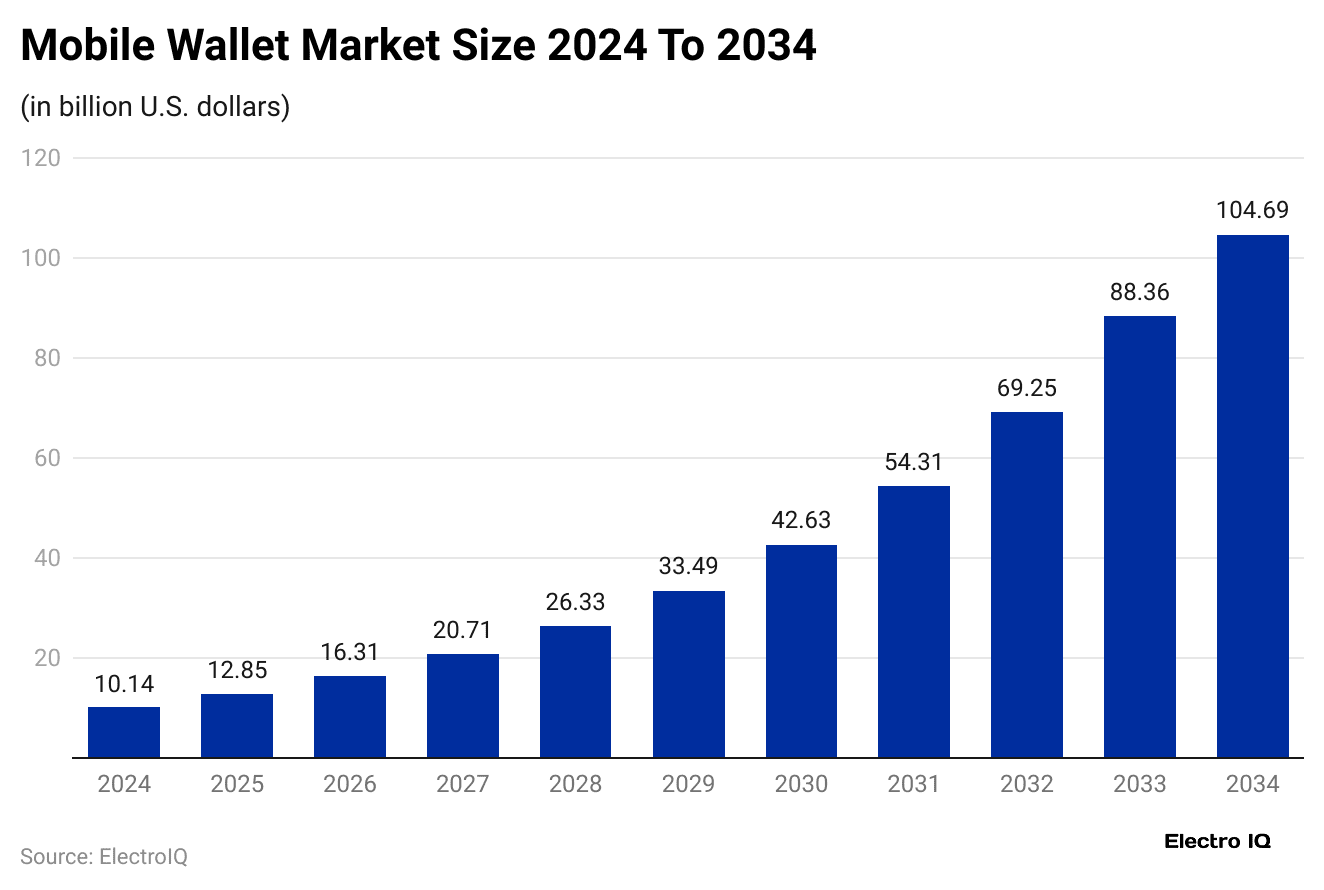
- In 2024, the global mobile wallet market was valued at USD 10.14 billion.
- The value is expected to grow from USD 12.85 billion in 2025 to about USD 104.69 billion in 2034.
- Between 2025 and 2034, the market is forecast to rise at a 26.30% yearly growth rate.
- In 2024, the global mobile payment market reached USD 88.5 billion and accounted for 23.8% of worldwide payment revenue, as mentioned in a report published by capitaloneshopping.com.
- The Asia-Pacific region captured the highest market share at 35.4%, while the U.S. recorded USD 670.5 billion in proximity mobile payment transactions.
- From 2025 to 2030, the global market is projected to grow at a 38.0% CAGR, hitting USD 587.5 billion by 2030, with U.S. transactions expected to surpass USD 1 trillion by 2027.
By Region
 (Reference: precedenceresearch.com)
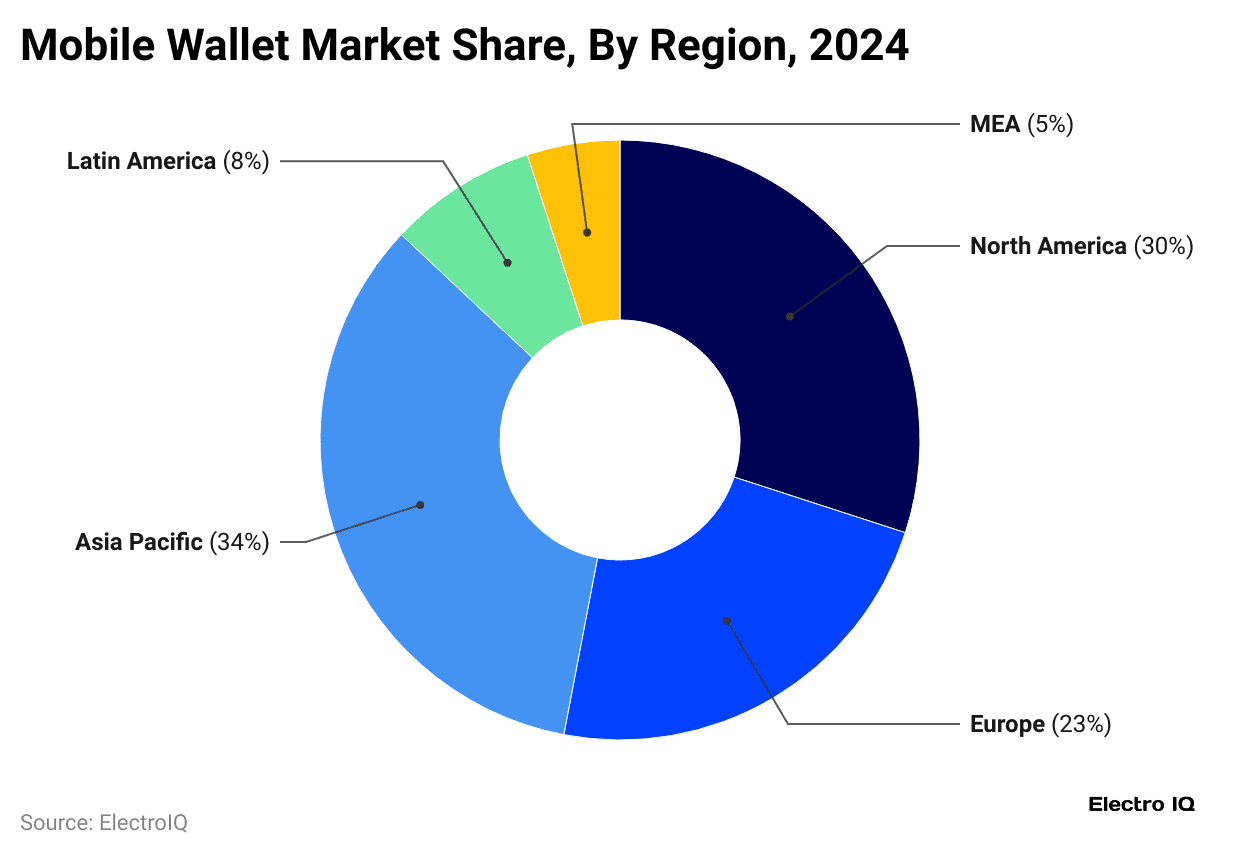
- In 2024, the Asia Pacific led the mobile wallet market with 34% of the total share.
- Furthermore, the other region shares are followed by North America at 30%, Europe at 23%, Latin America at 8%, and MEA at 5%.
Types of Mobile Wallets
 (Source: sdk.finance)
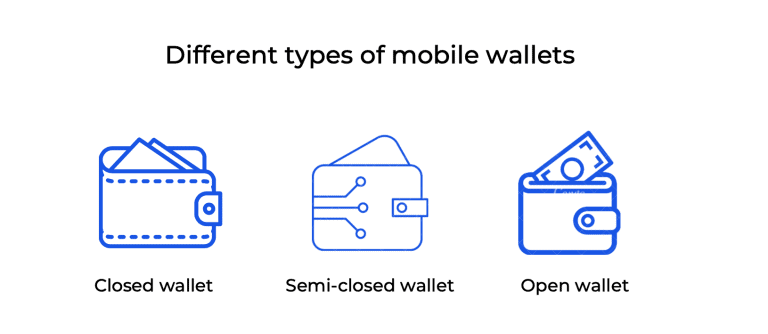
- Closed wallets are company-owned, like Amazon Pay.
- Open wallets, such as PayPal, let users store many cards.
- Semi-closed wallets come from one provider but work at different merchants for payments.
Global Mobile Wallet Usage Statistics by Platform
 (Source: payspacemagazine.com)
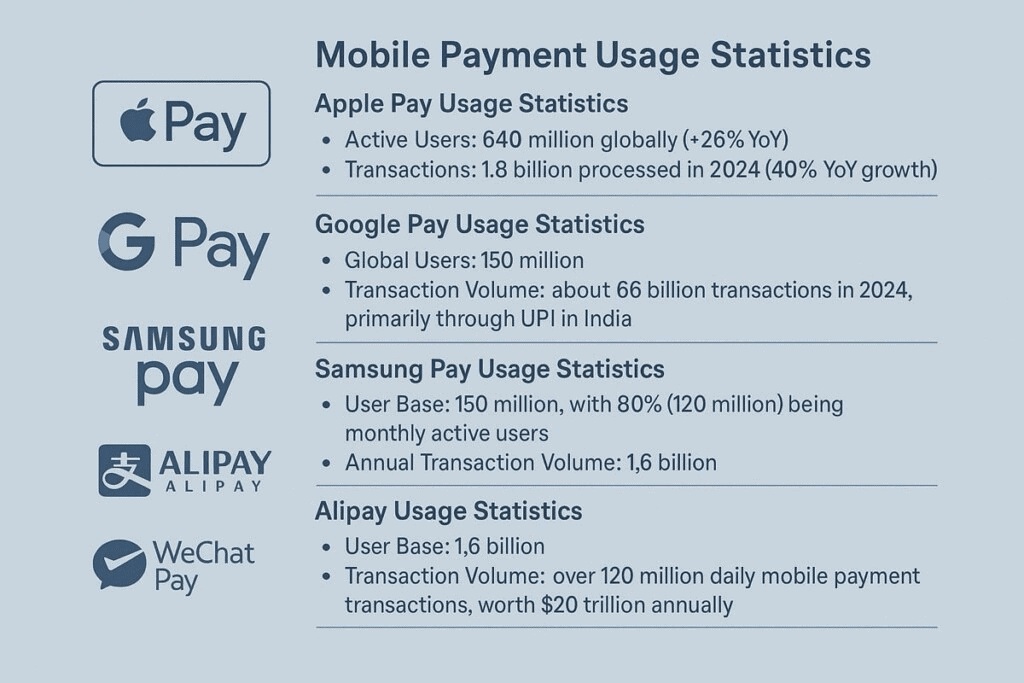
| Platform | Users | Transaction Volume |
| Apple Pay | 640 million (+26% YoY) |
1.8 billion |
|
Google Pay |
150 million | 66 billion |
| Samsung Pay | 150 million |
1.6 billion |
| 1.6 billion | >120 million daily | |
| PayPal | 434 million (+2.1% YoY) |
USD 1.68 trillion in FY |
| 57 million monthly active | USD 283 billion annual inflows | |
| Revolut | 52.5 million |
£1 trillion |
|
MetaMask |
30 million monthly active | USD 325 million cumulative swap revenue |
| Paytm | >350 million |
>4 billion |
|
WeChat Pay |
1.3 billion |
1 billion daily |
Mobile Wallet Users’ Payment Statistics
 (Reference: imagedelivery.net)
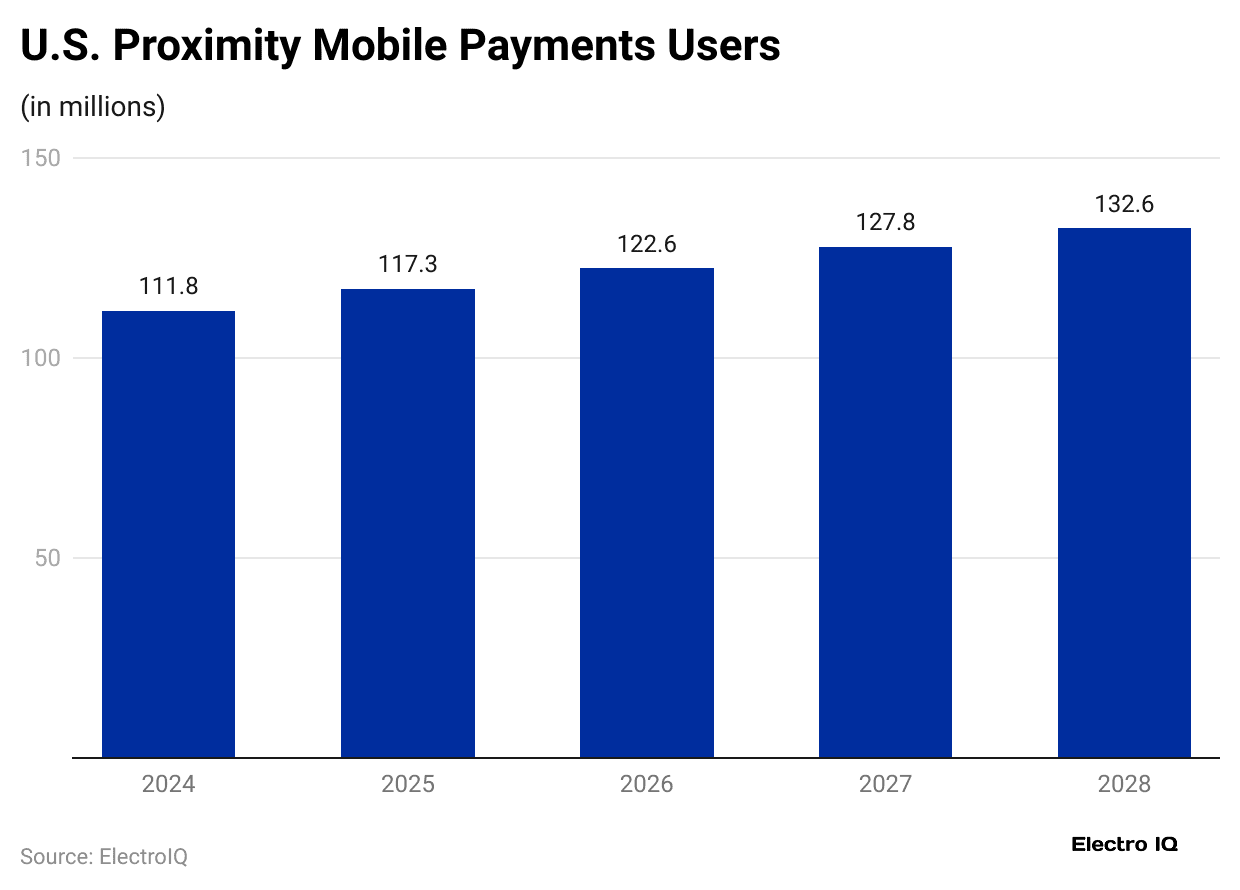
- The above graph shows that in 2024, the total number of United States proximity mobile payment users was 111.8 million, and it is going to reach 117.3 million by 2025.
- Other estimated mobile wallet users in the U.S. will be 122.6 million by 2026, 127.8 million by 2027 and 132.6 million by 2028.
Mobile Wallet User Statistics By Generation
 (Source: pymnts.com)
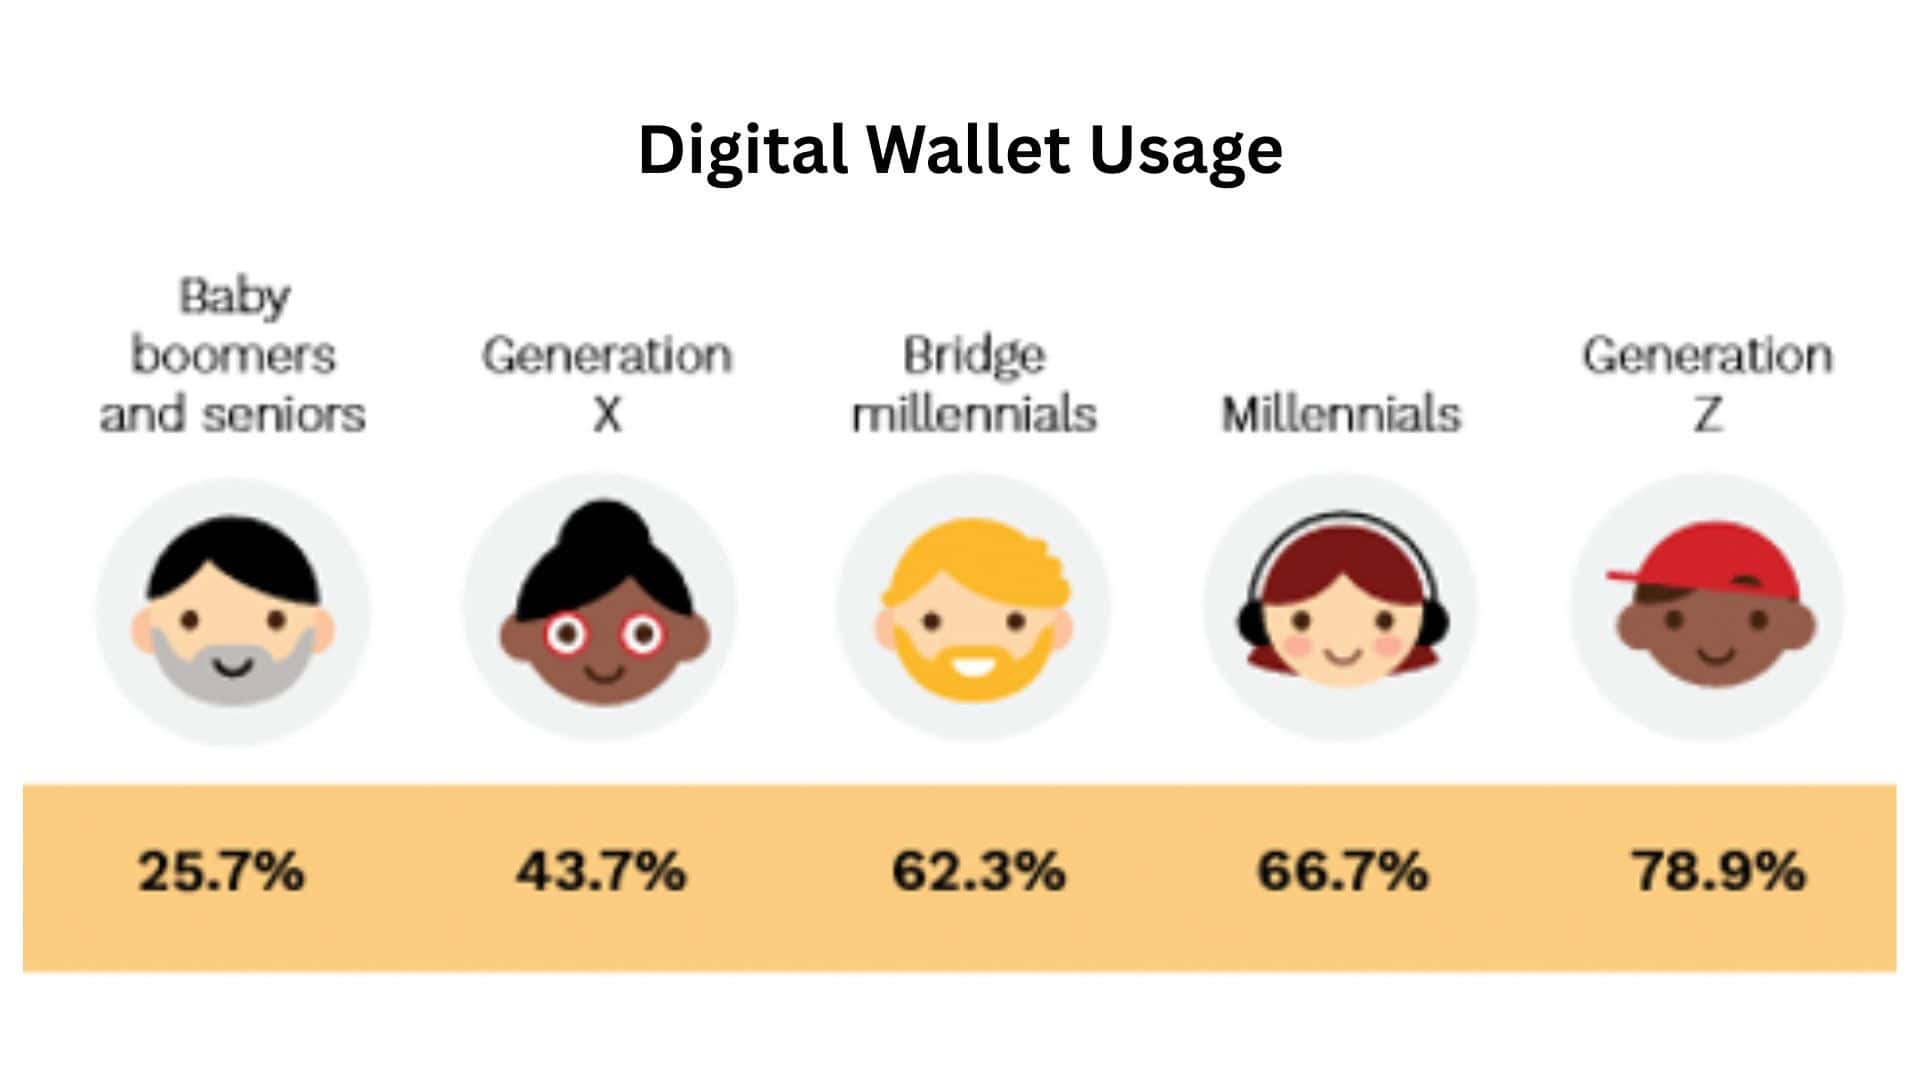
- In 2024, 78.9% of Gen Z consumers were the top users of mobile wallets.
- Millennials (66.7%) and Bridge Millennials (62.3%) also showed strong adoption of digital wallets.
- Usage was lower among Generation X at 43.7% and Older Adults at 25.7%.
By Income
- A report published by pymnts.com states that 54.7% of high-income individuals (earning USD 100,000+ annually) adopt mobile wallets.
- Followed by 51.4% of middle-income individuals (earning USD 50,000 to 100,000 annually), while 41.2% of low-income individuals (earning USD 50,000 or below annually).
Country-Wise Mobile Wallet Usage Statistics by Apple Pay
- According to CapitalOne Shopping Research, it shared that in 2024, about 61.3 million iPhone users in the United States actively used Apple Pay.
- Overall, 111.9 million Americans used some form of mobile payment that year.
- Among them, 54.8% preferred Apple Pay over other platforms.
 (Reference: imagedelivery.net)
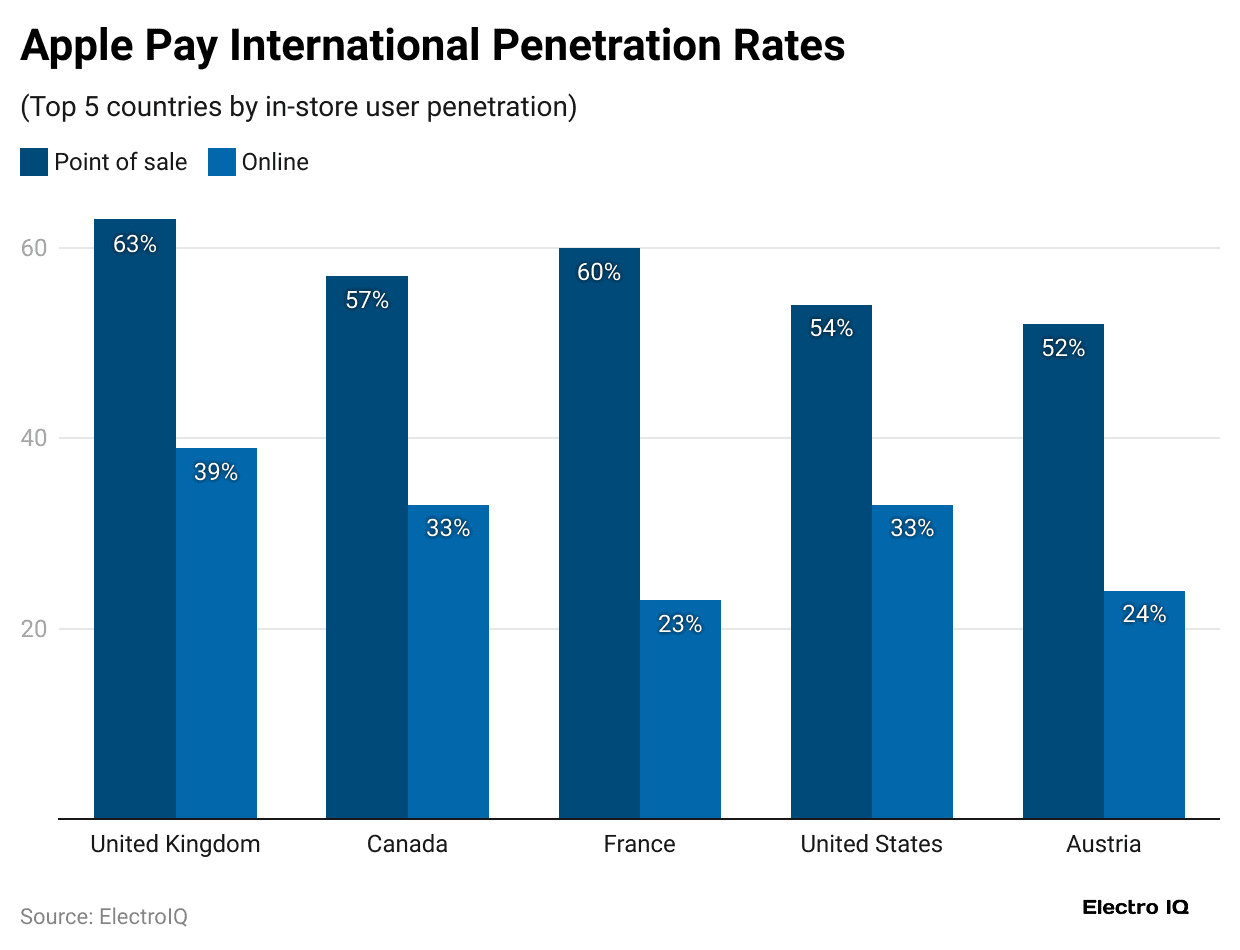
- By December 2024, the United Kingdom had the highest usage in Apple Pay, with 63% paying in stores and 39% online.
- France followed with 60% in-store and 23% online.
- Canada had 57% using it in shops and 33% online, while the United States showed 54% in-store and 33% online.
- Austria recorded 52% in stores and 24% online.
Furthermore, Apple Pay’s user penetration in other countries is stated below:
| Country | In-Store | Online |
| Sweden | 50% | 32% |
| Australia | 46% | 37% |
| Netherlands | 46% | 26% |
| Germany | 43% | 18% |
| Finland | 43% | 19% |
| Switzerland | 39% | 32% |
| Italy | 38% | 16% |
| Spain | 32% | 19% |
| Mexico | 22% | 14% |
| Poland | 21% | 18% |
| Brazil | 16% | 5% |
| China | 9% | 15% |
| Japan | 10% | 15% |
By Google Pay
- According to chargeflow.io, in 2024, around 48.6 million people in the U.S., or roughly 14.5% of the population, used Google Wallet.
- By 2025, this number is expected to grow to about 50.9 million and reach nearly 57 million by 2028, with a potential of 300 million users worldwide.
- Google Wallet handles 17% of in-store mobile wallet payments and 20% to 25% of online transactions.
- It represented about 2% to 3% of all U.S. merchant sales, with 10% to 12% of Americans using it at least once a month.
- Additionally, 70% to 80% of U.S. retailers accept Google Wallet for payments.
Google Wallet or Google Pay usage share by other countries is mentioned below:
| Country | In-Store | Online |
| India | 82% | 80% |
| United Kingdom | 37% | 32% |
| France | 25% to 30% | – |
By PayPal
- In June 2024, PayPal reported a revenue amount of USD 7.89 billion, followed by USD 1.13 billion (net income), and 14.31% (profit margin).
- Previously, in September 2023, revenue was USD 7.42 billion, with net income of USD 1.02 billion.
Online stores accepting PayPal as a payment method by country
| Country | Online Stores Share |
| Germany | 90% |
| Italy | 88% |
| Spain and France | 86% |
| Mexico | 82% |
| United Kingdom | 81% |
| Austria, Canada, Australia, and South Africa | 80% |
| Poland | 77% |
| Switzerland | 76% |
| Finland | 71% |
| Sweden | 68% |
| Netherlands | 63% |
| Brazil | 57% |
| India | 42% |
By Samsung Pay
- coinlaw.io report further shows that in 2025, Samsung Pay handled more than 1.6 billion yearly transactions, with services available in 31 countries.
- Its U.S. user base rose 9% year-on-year, reaching 35 million active users.
- People use the app about 5.2 times weekly, mostly for retail (68%) and some for peer-to-peer transfers (32%).
- Around 85% of all payments are NFC-based, showing the move to contactless.
- Loyalty program features increased engagement by 22%, proving Samsung Pay’s growing role in everyday purchases worldwide.
Samsung Pay / Samsung Wallet penetration rate in Q2 2025 is mentioned below:
| Country | In-Store | Online |
| South Korea | 36% to 40% | 18% to 22% |
| India | 20% to 30% | 10% to 20% |
| United States | 8% to 12% | 2% to 6% |
| United Kingdom | 6% to 10% | 3% to 6% |
| Australia | 10% to 16% | 6% to 10% |
| Canada | 6% to 10% | 3% to 6% |
| Germany | 8% to 12% | 3% to 6% |
| France | 6% to 10% | 2% to 5% |
| Japan | 5% to 9% | 4% to 8% |
| China | <5% | <5% |
| Brazil | 4% to 8% | 6% to 10% |
| Mexico | 4% to 8% | 4% to 8% |
| Spain | 5% to 9% | 3% to 6% |
| Netherlands | 6% to 10% | 4% to 7% |
By Amazon Pay
- As mentioned in a report published by CoinLaw in 2025, Amazon Pay handled about USD 85 billion in transactions, a 13.3% rise from 2024, and is expected to cover 6.1% of the global online payment market by year-end.
- The platform completed 3.2 billion transactions, with mobile payments growing 20%. Over 12 million users now use Amazon Pay Later.
- More than 600,000 merchants accept Amazon Pay, including 60,000 added in 2025, up from 500,000, showing rapid global expansion.
Amazon Pay’s customers ‘ monthly sales in 2025 by country are detailed below:
| Country | Sales (USD) |
| United States | 27.36 billion |
| Germany | 11.83 billion |
| Japan | 3.21 billion |
| Italy | 1.87 billion |
| United Kingdom | 1.73 billion |
| Spain | 780.59 million |
| France | 726.95 million |
| Saudi Arabia | 446.37 million |
| Austria | 310.33 million |
| Netherlands | 223.05 million |
| Others | 7.24 billion |
Most Used Payment Processing Technologies Statistics by Gateways and BNPL
 (Reference: electroiq.com)
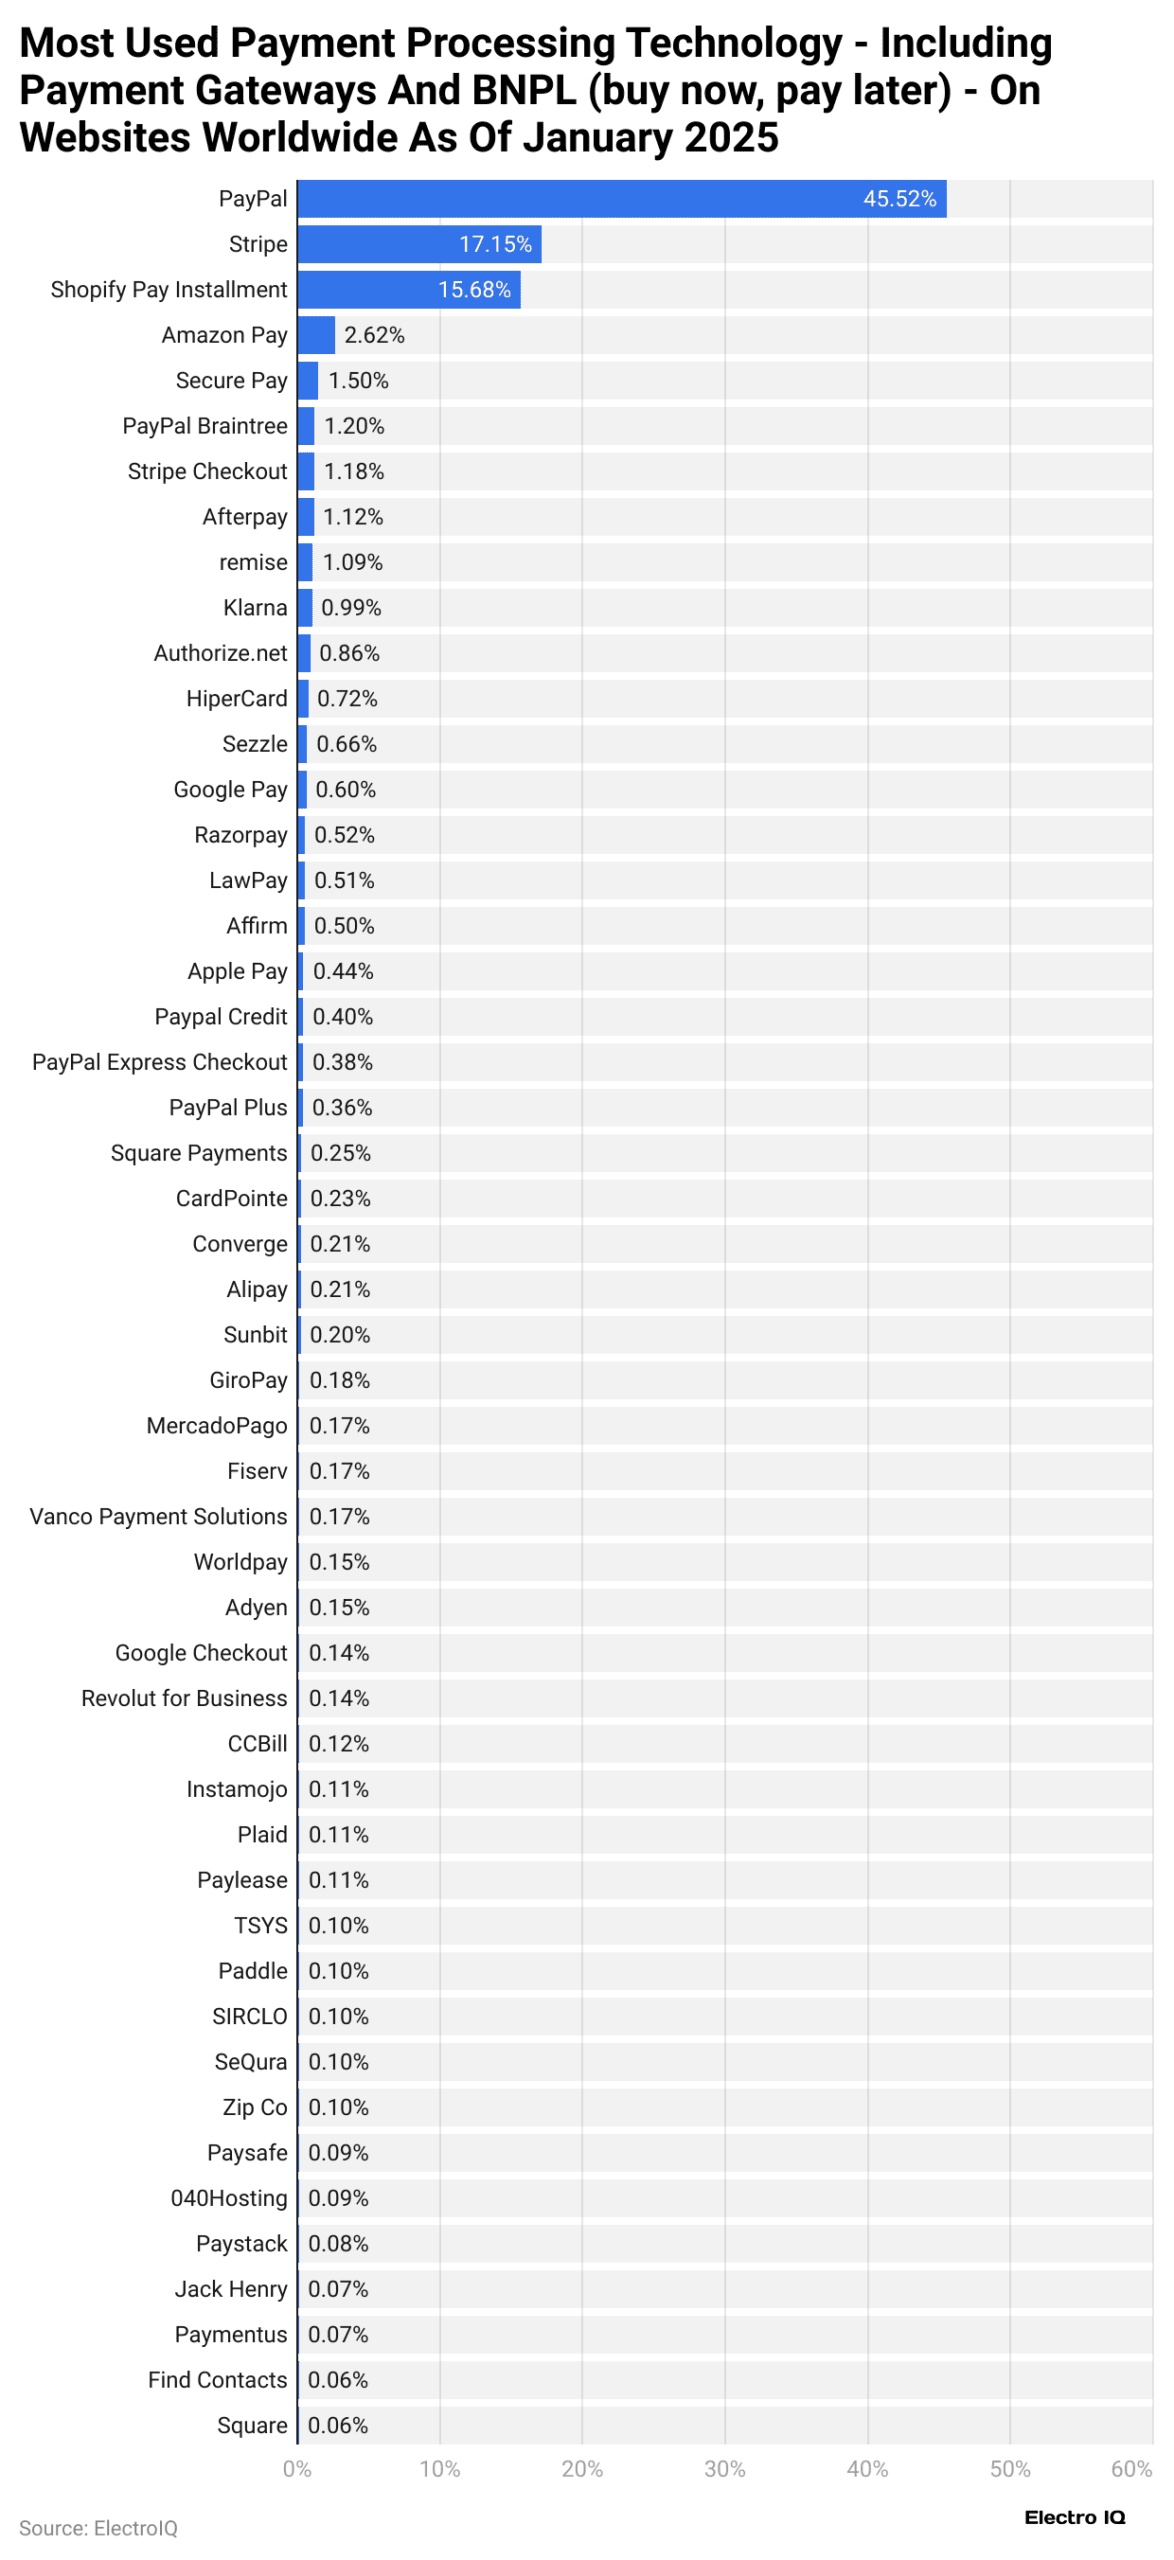
- As of January 2025, PayPal was the most used payment processing technology on websites worldwide, holding a 45.52% market share.
- Stripe followed it at 17.15% and Shopify Pay Instalment at 15.68%.
- Amazon Pay made up 2.62% of usage, followed by Secure Pay at 1.50%, PayPal Braintree at 1.20%, and Stripe Checkout at 1.18%.
- Afterpay held 1.12%, Klarna 0.99%, and Affirm 0.50%.
- Other well-known options included Remise with 1.09%, Authorize.net at 0.86%, HiperCard at 0.72%, Sezzle at 0.66%, Google Pay at 0.60%, Razorpay at 0.52%, LawPay at 0.51%, Apple Pay at 0.44%, PayPal Credit at 0.40%, and PayPal Express Checkout at 0.38%.
- Additional services with smaller shares were PayPal Plus (0.36%), Square Payments (0.25%), CardPointe (0.23%), Converge (0.21%), Alipay (0.21%), Sunbit (0.20%), GiroPay (0.18%), MercadoPago (0.17%), Fiserv (0.17%), Vanco Payment Solutions (0.17%), Worldpay (0.15%), Adyen (0.15%), Google Checkout (0.14%), Revolut for Business (0.14%), CCBill (0.12%), Instamojo (0.11%), Plaid (0.11%), Paylease (0.11%), TSYS (0.10%), Paddle (0.10%), SIRCLo (0.10%), SeQura (0.10%), Zip Co (0.10%), Paysafe (0.09%), 040Hosting (0.09%), Paystack (0.08%), Jack Henry (0.07%), Paymentus (0.07%), Find Contacts (0.06%), and Square (0.06%).
Conclusion
After completing the article on Mobile Wallet Statistics, it can be easily concluded that these days, cash and cards are no longer the only choice, as mobile wallets have become a key way to pay and manage money. They are now part of daily life because they offer speed, safety, and ease for shopping, travel, and online spending. As digital technology grows and more people move toward cashless payments, mobile wallets will likely become even more widely used in the coming years.
Sources
FAQ.
Yes, users can withdraw cash from their respective mobile wallets by using ATMs, partner banks, or authorised outlets.
Most mobile wallets have a daily transaction limit of around USD 1,000 to USD 2,000, depending on regulations.
A mobile wallet is not a bank account; it securely stores cards and processes over 1 billion transactions daily.
Users can withdraw money from their mobile wallet by transferring funds to their linked bank account within 24 hours.
Yes, most mobile wallets are free to download, and more than 80% of users enjoy services without charges.

Maitrayee Dey has a background in Electrical Engineering and has worked in various technical roles before transitioning to writing. Specializing in technology and Artificial Intelligence, she has served as an Academic Research Analyst and Freelance Writer, particularly focusing on education and healthcare in Australia. Maitrayee's lifelong passions for writing and painting led her to pursue a full-time writing career. She is also the creator of a cooking YouTube channel, where she shares her culinary adventures. At Smartphone Thoughts, Maitrayee brings her expertise in technology to provide in-depth smartphone reviews and app-related statistics, making complex topics easy to understand for all readers.


