Streaming Services Statistics By Features, Market Size, Share, Platforms, Users, and Country (2025)
Updated · Feb 07, 2026


Table of Contents
- Introduction
- Editor’s Choice
- Streaming Services Features
- Music Streaming Market Size
- Video Streaming Market Size
- Media Streaming Market Size
- Content Streaming Market Size
- Total TV And Streaming Statistics
- Streaming Market Share By Month Analysis
- All Streaming Services Analysis By Platforms
- Global Top 5 Streaming Services
- Monthly Cost Of Popular Streaming Services Statistics
- Top Streaming Services Statistics By Users
- Most Streamed Films In The United States
- Most Streamed New Binge-Released Series
- Streaming Services Statistics By Average Time Spent
- Key Video Streaming App Statistics
- Key Factors Influencing Video Streaming Preferences
- Video Streaming App Market Share Statistics By Country
- Reasons Viewers Stay Loyal To Video Streaming Services
- SVOD Cancellation And Renewal Trends By Generation
- Conclusion
Introduction
Streaming Services Statistics: A streaming media service is often called a streaming platform, involving a website or app that lets people watch or listen to entertainment like movies, shows, songs, or podcasts online. Instead of saving the whole file to their device, users can play it instantly over the internet, so they don’t have to wait for it to download first. Well-known streaming platforms include Netflix, Spotify, YouTube, and Disney+.
These services make it simple to enjoy content anytime, anywhere on demand, without needing physical disks or downloads. Better internet connections, the popularity of smart TVs, and low-cost subscription plans have helped the number of streaming users rise to over 1.5 billion worldwide. Ad-based streaming platforms and live sports coverage are reshaping how viewers pick what to watch.
This article on Streaming Services Statistics highlights several current analyses from different insights, including how global entertainment keeps changing, giving people more choices, tailored experiences, and easier access than ever before.
Editor’s Choice
- The global music streaming market is estimated to be around USD 49.5 billion by 2025 and will reach up to USD 125.7 billion by 2032.
- The video streaming market will reach USD 157.71 billion by 2025 and is expected to be USD 865.85 billion by 2034.
- By 2025, the media streaming market will reach around USD 115.2 billion and is expected to be USD 258,4 billion by the end of 2034.
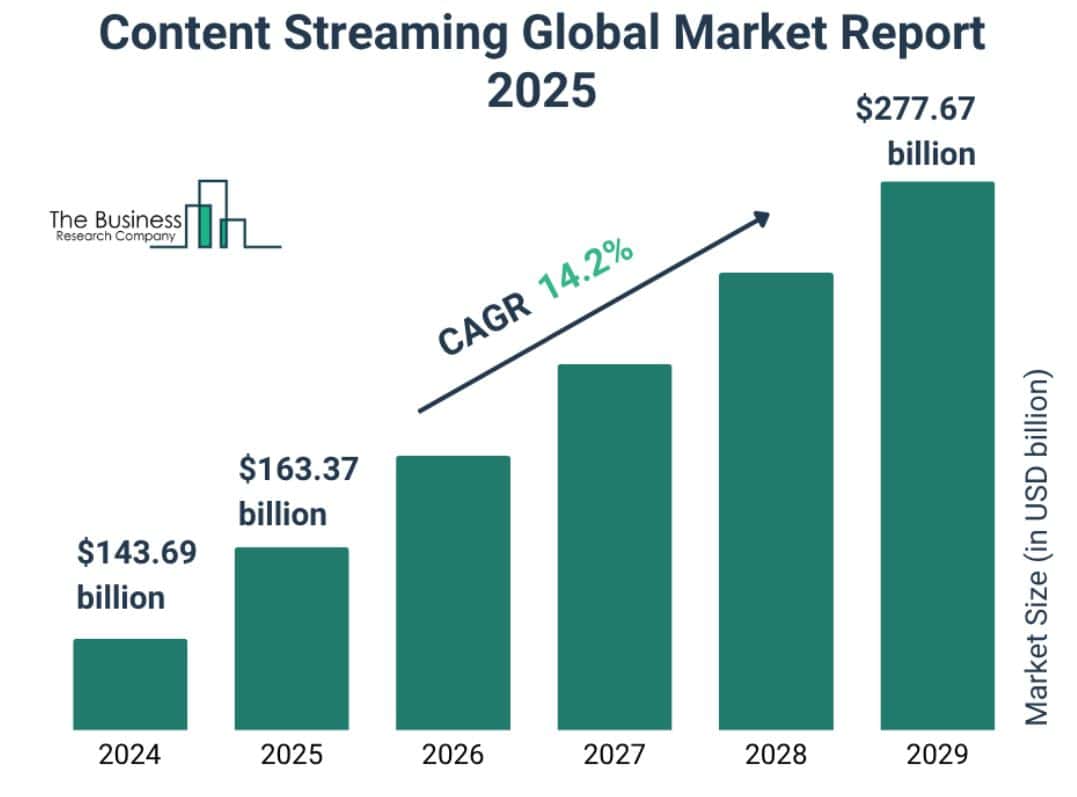
- The content streaming market is expanding rapidly, increasing from USD 143.69 billion in 2024 to USD 163.37 billion in 2025.
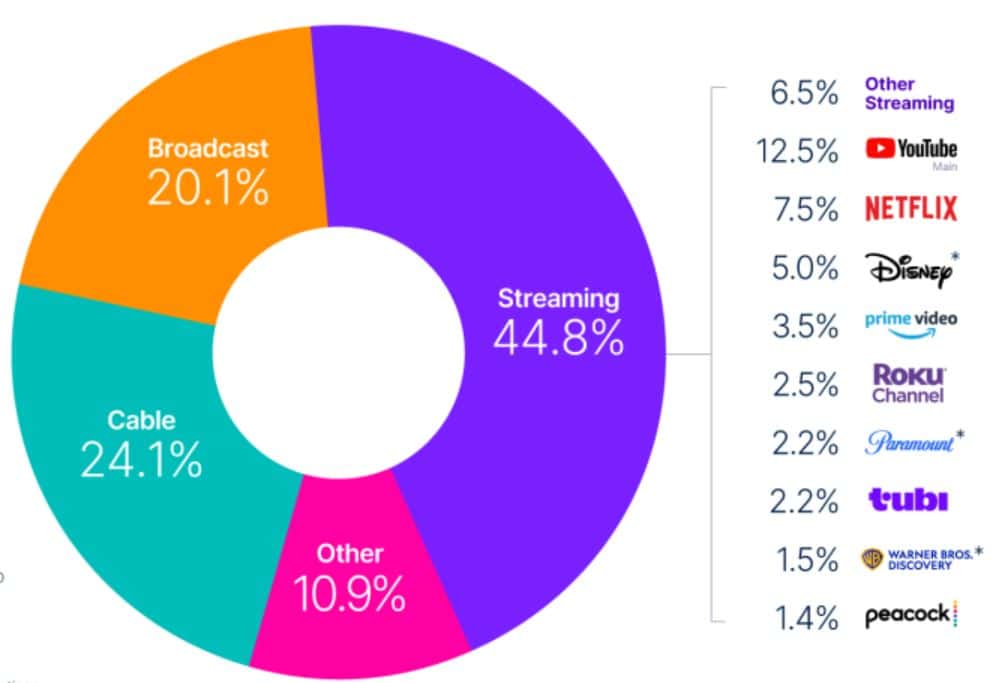
- According to Nielsen’s “The Gauge” report for May 2025, streaming continued to dominate U.S. viewing habits, capturing 44.8% of total TV usage.
- In early 2025, the streaming share showed steady growth of 43.3% in January, 43.5% in February, and 43.8% in March.
- According to Wikipedia, Netflix had 301.6 million paid memberships worldwide as of January 2025.
- In 2025, Amazon Prime Video with ads reaches over 130 million U.S. customers each month.
- As of May 2025, Wikipedia reports that Max (formerly HBO Max) and Discovery+ together reached 122.3 million global subscribers.
- As of May 2025, Wikipedia reports that Max (formerly HBO Max) and Discovery+ together reached 122.3 million global subscribers.
- Hulu reached about 53.6 million paying subscribers in the U.S.
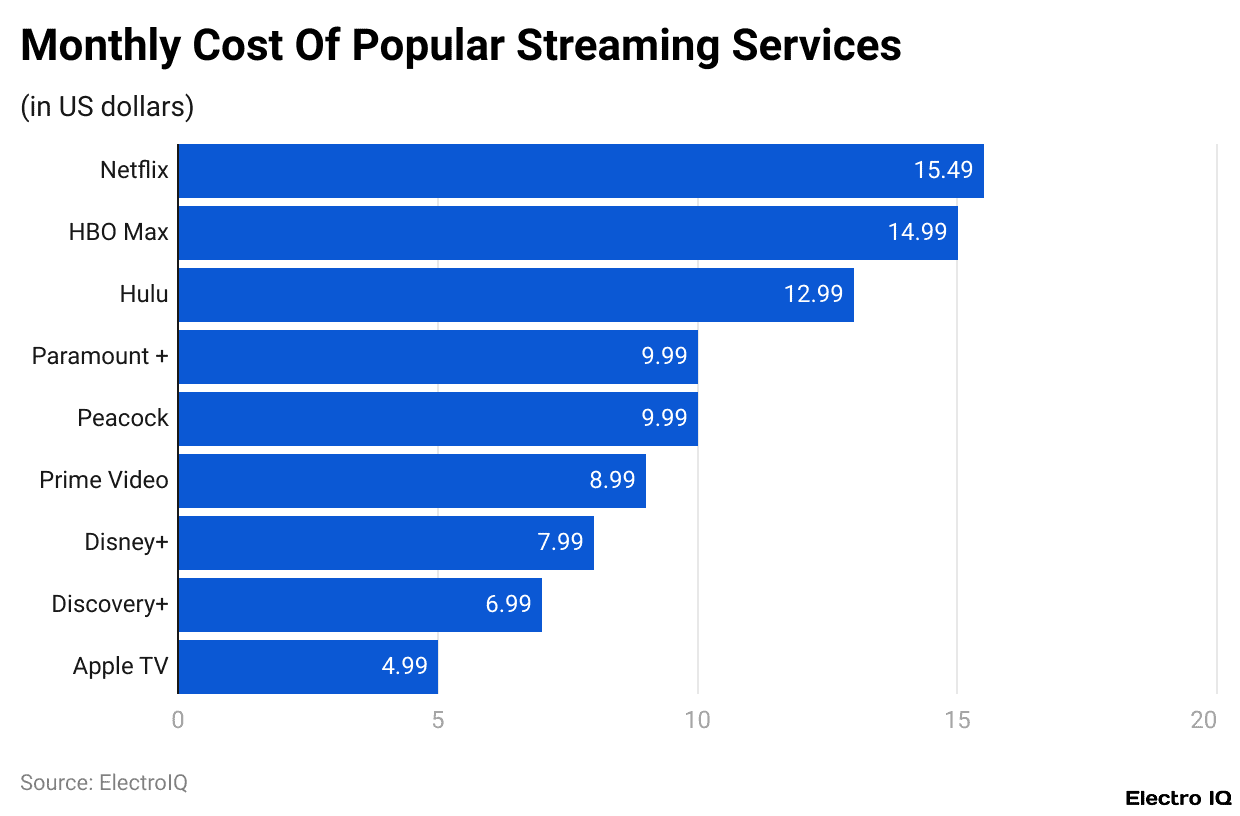
- As of 2025, on global streaming platforms, Netflix remains the most expensive at USD 15.49 per month, followed by HBO Max at USD 14.99 and Hulu at USD 12.99.
- In April 2025, 83% of U.S. adults watch content on streaming platforms such as Netflix, Disney+, and Amazon Prime Video.
- According to Nielsen, the most-watched streaming film in the first half of 2025 was Moana 2 with 33.6 million cumulative viewing equivalents (CVEs) in its first 14 days of release.
- In the United States, based on Nielsen’s 2025 streaming data, Adolescence led all new binge-released series with 12.1 million cumulative viewing equivalents (CVEs) in its first 14 days.
- In 2025, streaming engagement among U.S. users showed Netflix’s dominant lead, with active users spending an average of 1 hour and 3 minutes per day, while total adults averaged 36 minutes on the platform.
- According to recent consumer insights, the effective reasons for choosing streaming services are cost (84%), ease of use (81%), and variety of content (79%).
Streaming Services Features
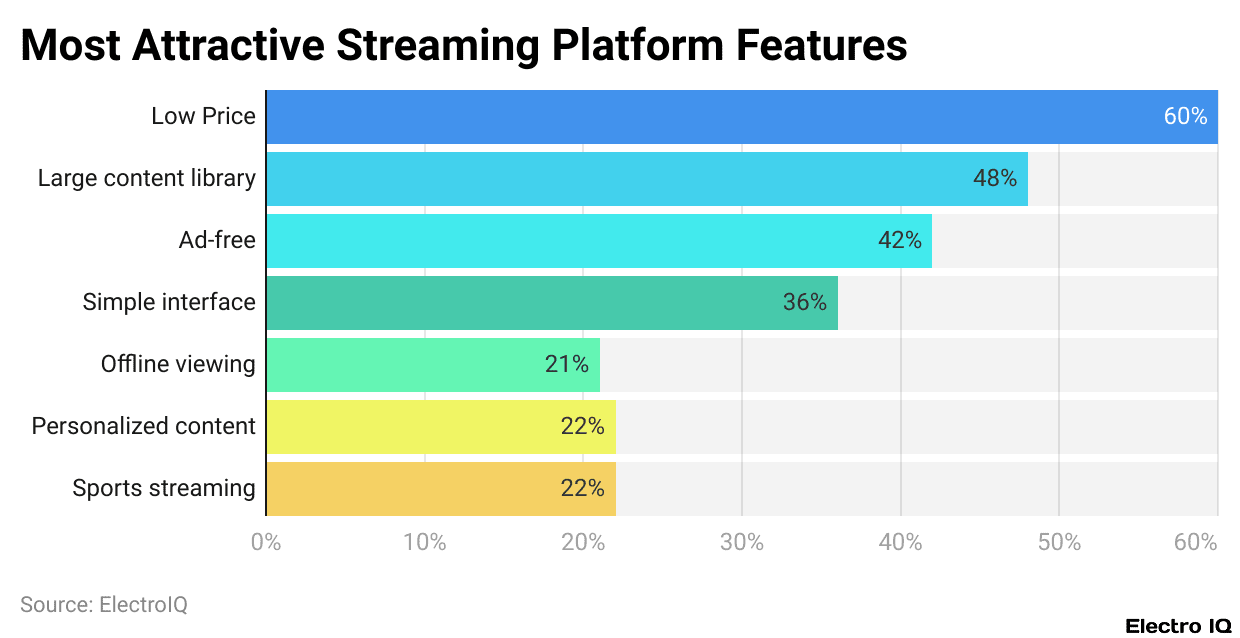
(Reference: cloudwards.net)
- In a 2024 survey, most people said the most important streaming features were low price (60%) and a large content library (48%).
- Others valued an ad-free experience (42%), easy navigation (36%), offline viewing (21%), personalised recommendations (22%), and access to sports streaming (22%).
Music Streaming Market Size
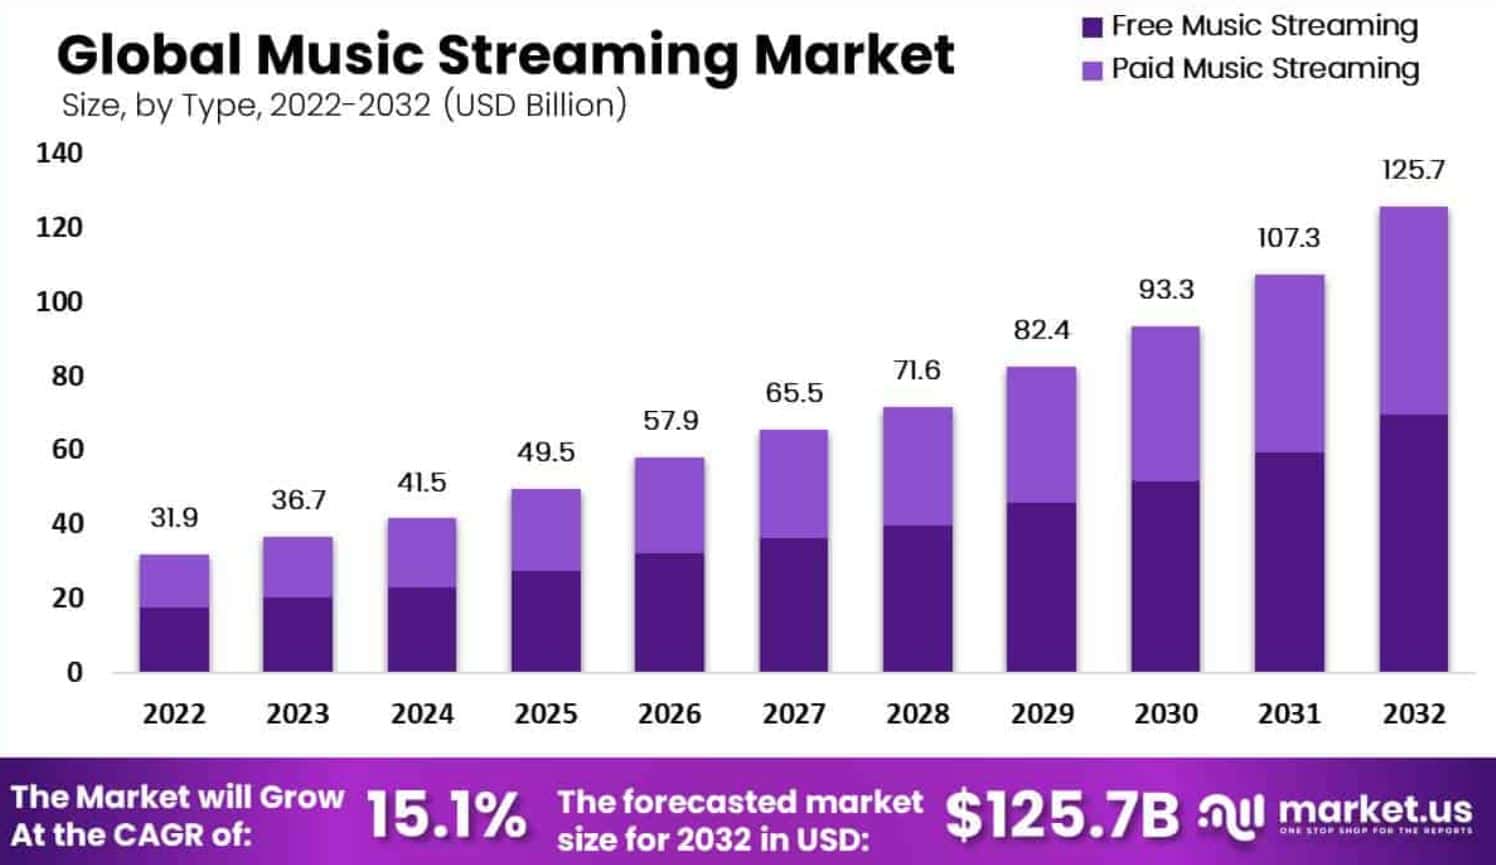
(Source: market.us)
- The global music streaming market is estimated to be around USD 49.5 billion by 2025 and will reach up to USD 125.7 billion by 2032.
- The overall market will grow at a 15.1% CAGR from 2025 to 2032.
Video Streaming Market Size
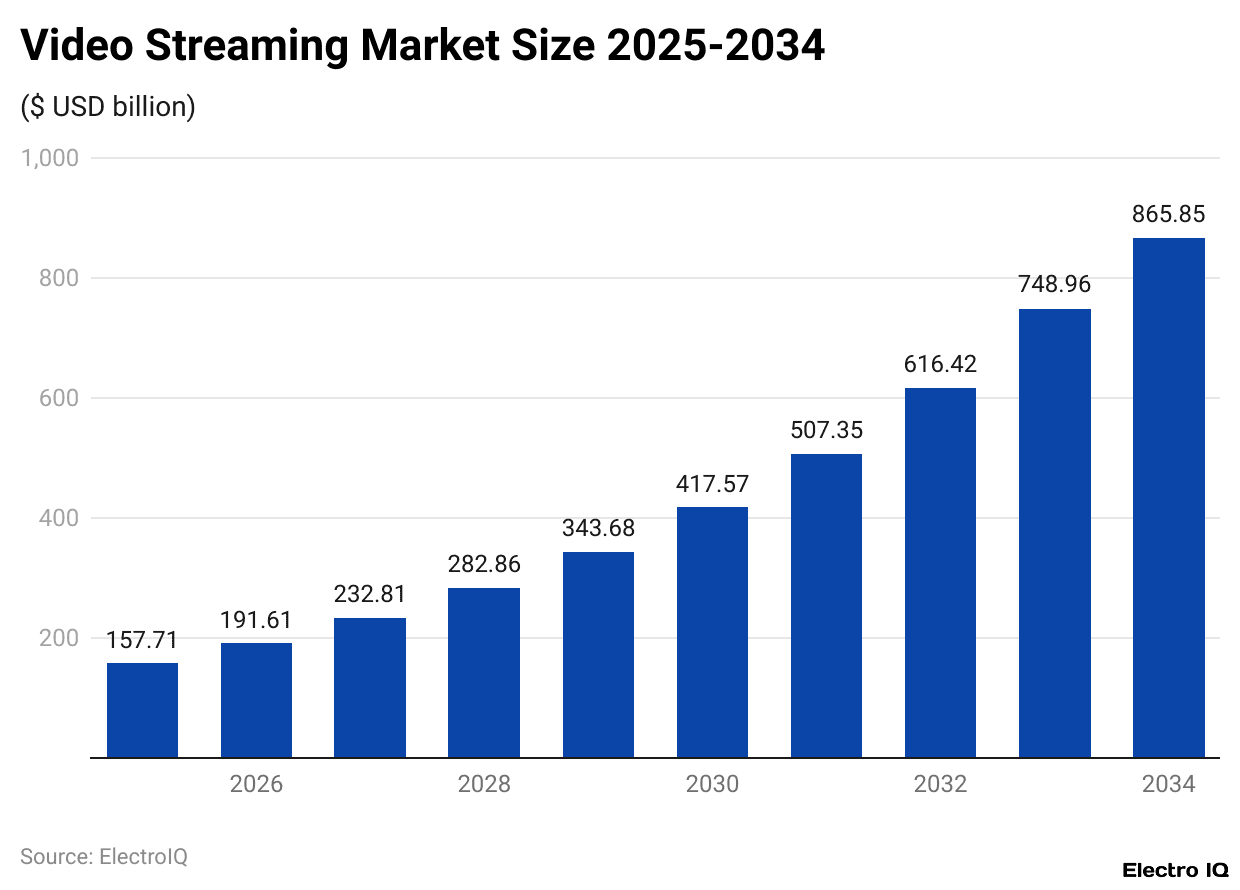
(Reference: precedenceresearch.com)
- The global video streaming market will reach USD 157.71 billion by 2025 and is expected to be USD 865.85 billion by 2034.
- The market is growing at a CAGR of 20.90% from 2025 to 2034.
- As of 2024, the largest market was captured by the North American region with a share of 32%.
- In the same period, market shares of other regions are followed as Europe (29%), Asia Pacific (25%), Latin America (9%), and MEA (5%).
Media Streaming Market Size
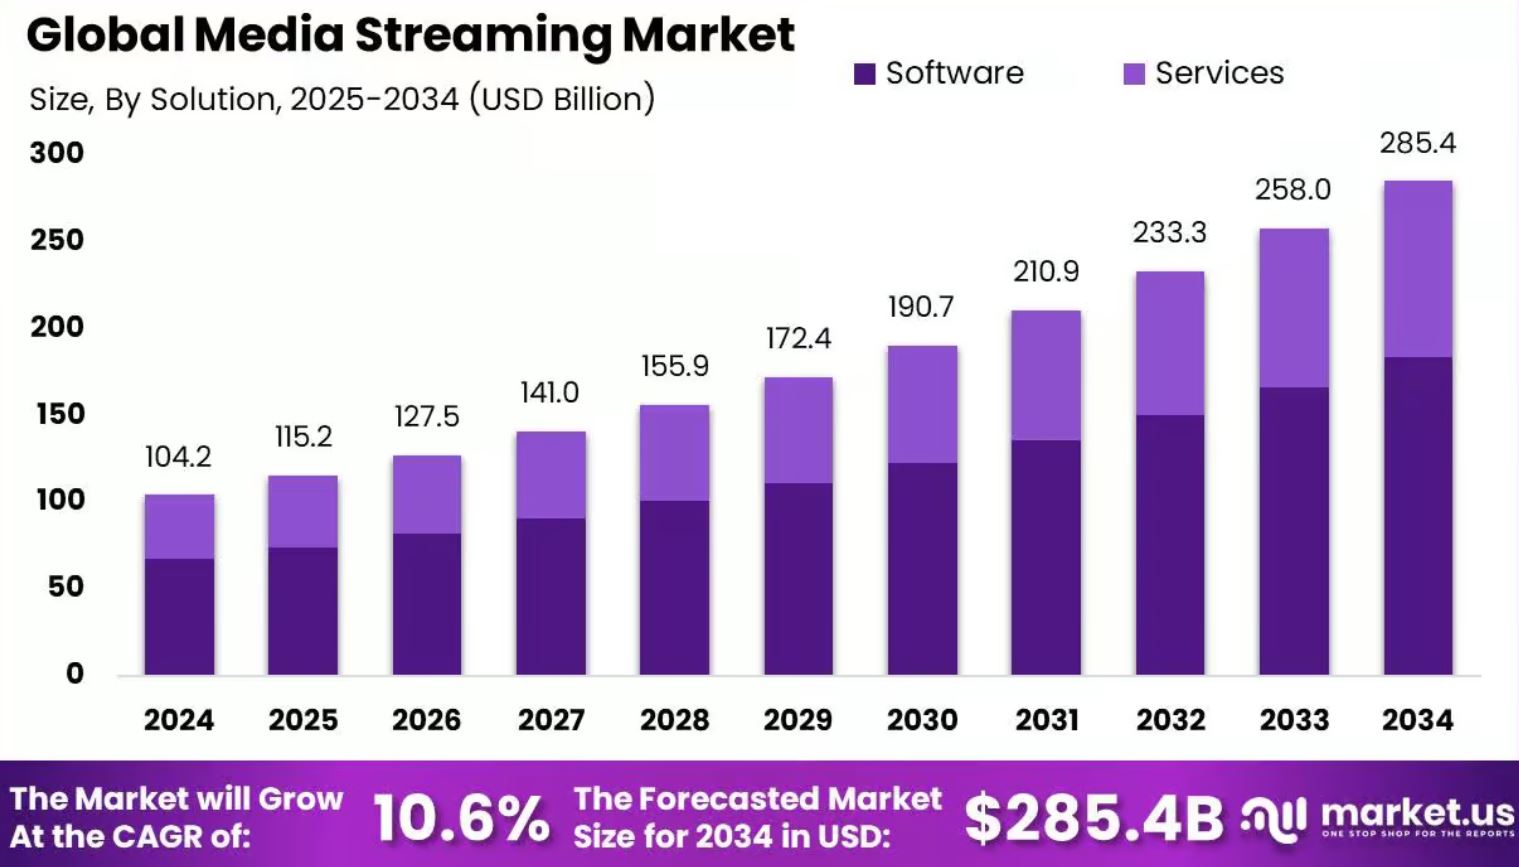
(Source: sp-ao.shortpixel.ai)
- By 2025, the global media streaming market will reach around USD 115.2 billion and is expected to be USD 258,4 billion by the end of 2034.
- The market is predicted to grow at a 106.6% CAGR from 2025 to 2034.
- The North American region secured the highest market share of 44.2%, resulting in USD 45.05 billion in revenue in 2024.
- In the same duration, the software category captured the highest market share of 64.5%, and satellite TV (44.8%).
- Lastly, the Subscription-based model secured 52.8%, and E-Learning contributed 38.5%.
Content Streaming Market Size
(Source: thebusinessresearchcompany.com)
- The content streaming market accounted for USD 143.69 billion in revenue in 2024 and is estimated to reach around USD 163.37 billion in 2025.
- The compound annual growth rate of the market will grow at a CAGR of 14.2% from 2025 to 2029.
Total TV And Streaming Statistics
(Source: nielsen.com)
- According to Nielsen’s report of May 2025, streaming continued to dominate U.S. viewing habits, capturing 44.8% of total TV usage.
- Cable followed with 24.1%, while Broadcast accounted for 20.1%, and Other viewing categories made up 10.9%.
- Among streaming platforms, YouTube led with 12.5%, followed by Netflix at 7.5%, Disney+ at 3.5%, and Prime Video at 3.5%.
- Roku Channel, Paramount+, and Tubi each held 2.2%, while Warner Bros. Discovery had 1.5% and Peacock closed at 1.4%.
- In early 2025, the streaming share showed steady growth of 43.3% in January, 43.5% in February, and 43.8% in March.
- In the same years, the upward trend continued with 44.3% in April and peaked at 44.8% in May.
Furthermore, other monthly streaming shares of 2024 are mentioned in the table below:
| Months | Streaming Share |
| May | 38.8% |
| June | 40.3% |
| July | 41.4% |
| August | 41.4% |
| September | 41.0% |
| October | 40.5% |
| November | 41.6% |
| December | 43.3% |
All Streaming Services Analysis By Platforms
| Service Name | Origin Country | Launch Year | Subscribers | Served Country/Region |
| Netflix | United States | January 16, 2007 | 301.6 million | Worldwide |
| JioHotstar | India | February 14, 2025 | 280 million | India |
| Disney+ |
United States
|
November 12, 2019 | 127.8 million | Worldwide |
| Hulu | October 29, 2007 | 55.5 million |
United States
|
|
| ESPN+ | April 12, 2018 | 24.1 million | ||
| Amazon Prime Video & MGM+ | September 7, 2006 | 205 million |
Worldwide
|
|
| iQIYI | China | April 22, 2010 | 128.9 million | |
| YouTube Premium |
United States
|
November 14, 2014 | 125 million | 120 countries |
| HBO Max | May 27, 2020 |
122.3 million
|
Armenia, Andorra, Australia, Austria (upcoming), Belgium, Caribbean, Central and Eastern Europe, Cyprus, France, Georgia, Germany (upcoming), Greece, Ireland (upcoming), Israel (upcoming), Italy (upcoming), Japan, Kazakhstan, Kyrgyzstan, Latin America, Nordics, Netherlands, New Zealand, Poland, Portugal, Spain, Southeast Asia, Switzerland (upcoming), Taiwan, Tajikistan, Turkey, Ukraine, United Kingdom (upcoming), and United States | |
| Discovery+ | January 4, 2021 | Canada, Europe, India, Israel, and the United States | ||
| Tencent Video |
China
|
June 2011 | 120 million | Bangladesh, China, Hong Kong, Indonesia, Macau, Malaysia, Philippines, Singapore, South Korea, Taiwan, Thailand, and Vietnam |
| Youku | December 21, 2006 | 90 million | China | |
| Paramount+ & SkyShowtime | United States | March 4, 2021 | 79 million | Austria, Belgium, Canada, Central America, Dominican Republic, France, Germany, Central and Eastern Europe, Italy, Japan, Middle East, Northern Europe, Portugal, Philippines, Russia, South America, Spain and Andorra, Sub-Saharan Africa, Switzerland, United Kingdom, and United States |
| MangoTV | China | April 20, 2014 | 73.31 million | Worldwide |
| Vidio | Indonesia | October 15, 2014 | 60 million | Indonesia |
| ZEE5 | India | February 14, 2018 | 48 million | 190+ countries |
| Apple TV+ |
United States
|
November 1, 2019 | 45 million | 114 countries |
| Peacock | July 15, 2020 | 41 million | Andorra, Australia (upcoming), Austria, Canada (upcoming), Central and Eastern Europe, Germany, India, Ireland, Italy, Latin America, Middle East and North Africa (upcoming), Netherlands, New Zealand (upcoming), Nordics, Pakistan (upcoming), Portugal, Spain, Sub-Saharan Africa, Southeast Asia, United Kingdom, and United States | |
| SonyLIV | India | January 22, 2013 | 33.3 million | Canada, Europe, the Middle East, Indo-Pacific, and the United States |
| BiliBili | China | June 26, 2009 | 28.5 million | Worldwide |
| iflix | Malaysia | May 27, 2014 | 25 million | Bangladesh, Brunei, Cambodia, Indonesia, Malaysia, Maldives, Myanmar, Nepal, Pakistan, Philippines, Sri Lanka, Thailand, and Vietnam |
| Curiosity Stream | United States | March 18, 2015 | 25 million | 175 countries |
| Shahid | Saudi Arabia | 2008 | SVOD: 4.8 million AVOD: 17.8 million |
Worldwide
|
| DAZN | United Kingdom | July 8, 2015 | 20 million | |
| Starz | United States | October 8, 2012 | 19.6 million | India, Indonesia, Ireland, Malaysia, Pakistan, Philippines, (Lionsgate+) and 17 countries in the Middle East and North Africa region (Starzplay Arabia), the United States and Canada (Starz). |
| Eros Now | India | August 2012 | 19 million |
Worldwide
|
| Crunchyroll | United States | May 14, 2006 | 15 million | |
| Viu | Hong Kong | October 26, 2015 | 13.8 million | Bahrain, Egypt, Hong Kong, Indonesia, Jordan, Kuwait, Malaysia, Myanmar, Oman, Philippines, Qatar, Saudi Arabia, Singapore, South Africa, Thailand, and the United Arab Emirates |
| VMX |
Philippines
|
January 29, 2021 | 12 million | 78 countries |
| iWant | January 8, 2010 | 11 million | Worldwide | |
| Mubi | United Kingdom | February 14, 2007 | 9 million | 200 territories |
| Rakuten TV | Japan & Spain | 2010 | 7 million | Europe and Japan |
| Globoplay | Brazil | November 3, 2015 | 6.5 million | Australia, Austria, Belgium, Brazil, Canada, Denmark, Finland, France, Germany, Greece, Ireland, Italy, Japan, Luxembourg, Netherlands, Norway, Portugal, Spain, Switzerland, the United Kingdom, and the United States |
| Viaplay | Sweden | May 2007 | 5.55 million | Australia, Austria, Germany, the Netherlands, Nordics (Norway, Sweden, Finland, Denmark), and Switzerland |
| TVING | South Korea | October 2, 2020 | 5 million | Japan, South Korea, and Taiwan |
| U-Next | Japan | June 1, 2007 | 4.3 million | Japan |
| Crave | Canada | October 30, 2014 | 3.2 million | Canada |
| BET+ | United States | September 19, 2019 | 3 million | American Samoa, Guam, Northern Mariana Islands, Palau, Puerto Rico, the United States, and the U.S. Virgin Islands |
| Hulu Japan |
Japan
|
September 1, 2011 | 2.8 million |
Japan
|
| d-anime Store | July 3, 2012 | 2.5 million | ||
| NOW | United Kingdom | July 17, 2012 | 2.21 million | Austria, Germany, Ireland, Italy, Switzerland, the United Kingdom, and the United States |
| Stan. | Australia | April 1, 2014 | 2.1 million | Australia |
| BritBox | United Kingdom | March 7, 2017 | 2 million | Australia, Canada, South Africa, the United Kingdom, and the United States |
| Lemino | Japan | November 18, 2011 | 2 million | Japan |
| Neon | New Zealand | February 1, 2015 | 1.7 million | New Zealand |
| Smash. | Japan | October 22, 2020 | 1.63 million | Japan and South Korea |
| Angel Studios | United States | 2023 | 1.529 million | The United States, Canada, and other countries will be coming soon |
| Royal Bioscope |
India
|
February 14, 2018 | 1.5 million | Bangladesh and India |
| Aha | March 25, 2020 | 1.439 million | India | |
| FuboTV | United States | January 1, 2015 | Canada, Spain, and the United States | |
| Kayo Sports | Australia | November 26, 2018 | 1.08 million | Australia |
| Videoland | Netherlands | 2010 | 1.006 million | Netherlands |
| HayU | United States | March 1, 2016 | Australia, Belgium, Canada, Denmark, Finland, Hong Kong, India, Ireland, Luxembourg, Netherlands, Norway, Philippines, Singapore, Sweden, and the United Kingdom | |
| Acorn TV | United Kingdom | August 15, 2013 |
1 million
|
Australia, Canada, Ireland, New Zealand, the United Kingdom, and the United States |
| Shudder | United States | 2015 | Australia, Canada, Ireland, New Zealand, the United Kingdom, and the United States | |
| Telasa | Japan | May 15, 2012 | Japan | |
| Philo |
United States
|
November 14, 2017 | 800,000 | United States |
| Nebula | May 23, 2019 | 680,000 | Worldwide | |
| Atresplayer Premium | Spain | September 8, 2019 | 670,000 | Americas and Spain |
| Venevision Play | Venezuela | August 25, 2023 | 600,000 | Venezuela |
| Showmax | South Africa | August 19, 2015 | 590,000 | Africa |
| ALTBalaji | India | April 16, 2017 | 570,000 |
Worldwide
|
| Dropout |
United States
|
September 26, 2018 | 500,000 to 999,999 | |
| BlazeTV | September 12, 2011 | 450,000 | United States | |
| GagaOOLala | Taiwan | 2017 | 150,000 | Worldwide |
| AMC+ |
United States
|
2020 | Australia, Canada, India, New Zealand, South Korea, Spain, and the United States | |
| IFC Films Unlimited | 2019 |
100,000
|
United States and Canada | |
| Sundance Now | 2014 |
United States
|
||
| Allblk | 2020 | |||
| We TV+ | 2020 | |||
| SOMM TV |
2019
|
– | Worldwide | |
| ETV Win | India | – | India |
Global Top 5 Streaming Services
Netflix
- According to Wikipedia, Netflix had 301.6 million paid memberships worldwide as of January 2025.
- Investing.com reported its Q2 2025 revenue reached USD 11.08 billion, showing a 16% year-over-year rise.
- As noted by MarketBeat, the company’s earnings per share resulted in USD 7.19.
- A report published by licensinginternational.org mentioned that in 2025, revenue guidance is USD 44.8 to 45.2 billion with an operating margin of 29.5%.
- Reuters stated the ad-supported tier grew to 94 million users in May 2025, while nScreenMedia reported 18.9 million new members in Q4 2024, totalling about 301.6 million.
Amazon Prime Video
- According to Tech Xplore (2025), Amazon Prime Video with ads reaches over 130 million U.S. customers each month.
- MediaPost reports that total U.S. Prime subscribers reached 128.6 million in 2025, marking nearly a 30% growth since 2020.
- Globally, Electro IQ estimates the platform’s subscriber base at 167.07 million by 2025.
- As per Evoca, Prime Video captured around 22% of the U.S. subscription video-on-demand (SVOD) market.
- Meanwhile, MediaPost (May 2025) adds that it holds a 3.5% share of total TV viewing.
Disney+
- As of August 2025, Disney+ had around 127.8 million paid subscribers worldwide, ranking as the third-largest SVOD platform after Netflix and Amazon Prime Video, according to Wikipedia.
- In its Q2 fiscal 2025 earnings report, The Walt Disney Company stated that Disney+ reached 126 million subscribers, marking an increase of 1.4 million from the previous quarter.
- Additionally, CosmicBook.News reported that in Q3 2025, Disney’s combined streaming platforms Disney+ and Hulu had a total of 183 million subscriptions, with 128 million attributed specifically to Disney+.
HBO Max (Max)
- As of May 2025, Wikipedia reports that Max (formerly HBO Max) and Discovery+ together reached 122.3 million global subscribers.
- According to The Verge, the platform gained 3.4 million new users in Q2 2025, with nearly all growth coming from international markets except 200,000 in the U.S.
- FlixPatrol estimates that 56.5 million subscribers are based in the United States. As noted by Business of Apps, Warner Bros.
- Discovery aims to achieve 150 million total streaming subscribers across both services by 2026.
- Furthermore, The Verge confirmed that on July 9, 2025, the platform officially reverted its name from “Max” back to HBO Max.
Hulu
- A report shared by Evoca mentioned that in the United States, Hulu has already secured around 53.6 million paid subscribers in 2025.
- A ScreenMedia further shows that the Live TV + SVOD plan made up about 4.4 million users in Q1 2025.
- In contrast, this streaming service earns nearly USD 12.29 per user each month.
- According to Business of Apps, Hulu’s audience accounted for 52 million in late 2024.
Monthly Cost Of Popular Streaming Services Statistics
(Reference: cdn.buttercms.com)
- As of 2025, Netflix will remain the most expensive service at USD 15.49 per month, followed by HBO Max at USD 14.99 and Hulu at USD 12.99.
- Mid-tier options include Paramount+ and Peacock, both priced at USD 9.99, while Prime Video costs USD 8.99 and Disney+ at USD 7.99.
- Budget-friendly services include Discovery+ at USD 6.99 and Apple TV+ at USD 4.99.
Top Streaming Services Statistics By Users
(Source: straitsresearch.com)
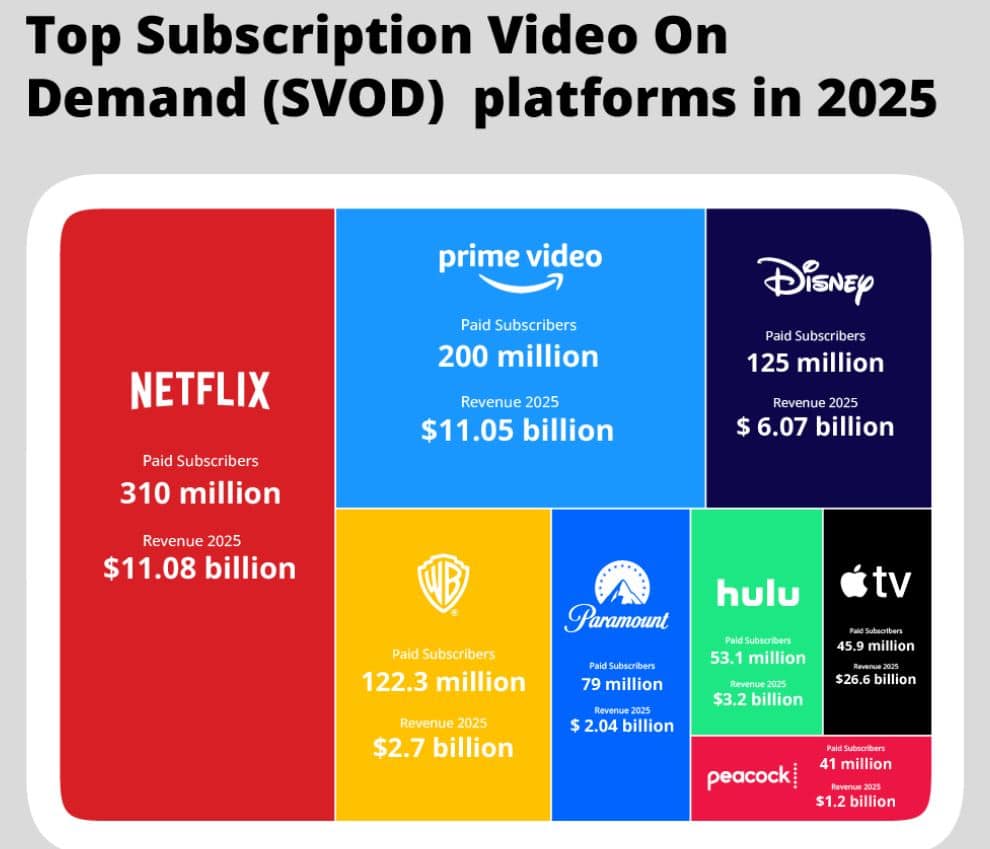
- In 2025, Netflix is termed as the global leader in the streaming service market with approximately 310 million subscribers, followed by Amazon Prime Video with 200 million subscribers.
- Disney+ and HBO Max accounted for 125 million and 122 million users, respectively.
- Meanwhile, Paramount+ had 79 million subscribers, followed by Hulu (53 million), Apple TV+ (45.9 million), and Peacock (41 million).
- Whereas Tubi and The Roku services secured more than 100 million monthly active users and 145 million, respectively.
By Demographics
- As of April 2025, 83% of U.S. adults watch content on streaming platforms such as Netflix, Disney+, and Amazon Prime Video.
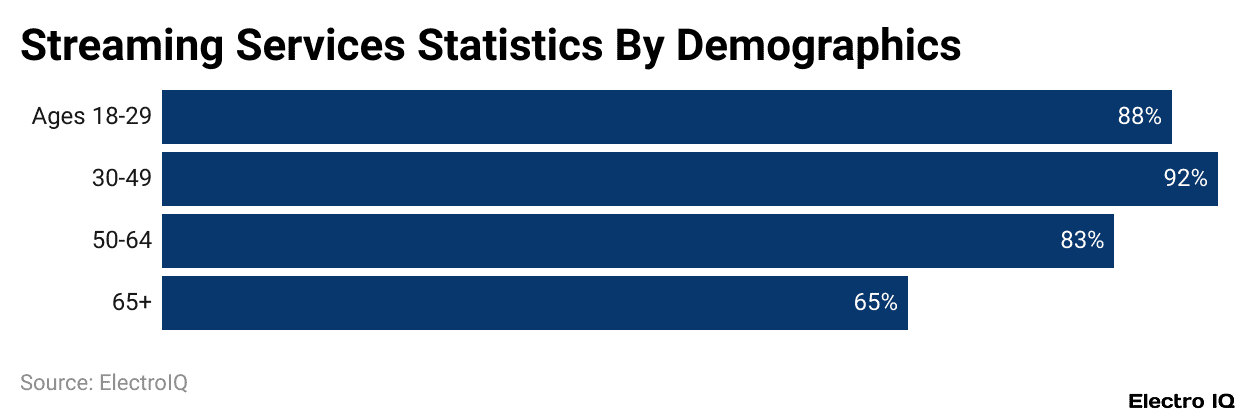
(Reference: pewresearch.org)
- 88% adults aged 18 to 29 are currently using streaming services, increasing to 92% for ages 30 to 49.
- Meanwhile, 83% of people aged 50 to 64 and 65% of seniors watch streaming content.
- Income-wise, 91% of upper-income adults stream, compared to 85% of middle-income and 77% of lower-income individuals.
Most Streamed Films In The United States
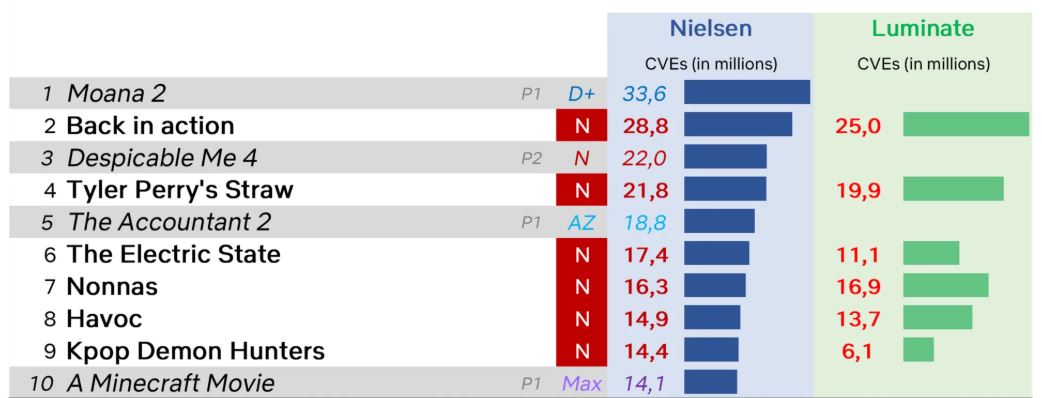
(Source: netflixandchiffres.com)
- According to Nielsen, the most-watched streaming film in the first half of 2025 was Moana 2 with 33.6 million cumulative viewing equivalents (CVEs) in its first 14 days of release.
- Back followed it in Action with 28.8 million, Despicable Me 4 with 22.0 million, and Tyler Perry’s Straw with 21.8 million CVEs.
- Other top performers included The Accountant 2 (18.8 million), The Electric State (17.4 million), Nonnas (16.3 million), Havoc (14.9 million), KPop Demon Hunters (14.4 million), and A Minecraft Movie with 14.1 million CVEs.
Most Streamed New Binge-Released Series
- In the United States, based on Nielsen’s 2025 streaming data, Adolescence led all new binge-released series with 12.1 million cumulative viewing equivalents (CVEs) in its first 14 days.
- It was followed by Zero Day with 11.8 million, Sirens at 11.4 million, and The Four Seasons with 10.6 million.
- Other top streaming series include American Primaeval (10.1 million), Running Point (9.1 million), and Missing You (8.5 million).
- The Residence made up 7.7 million, while The Waterfront reached 7.6 million, and Ransom Canyon rounded out the top ten with 5.7 million CVEs.
- Secondary titles included Dept. Q (4.3 million), Pulse (4.0 million), The Better Sister (3.9 million), Secrets We Keep (3.6 million), and Forever with 3.3 million.
Streaming Services Statistics By Average Time Spent
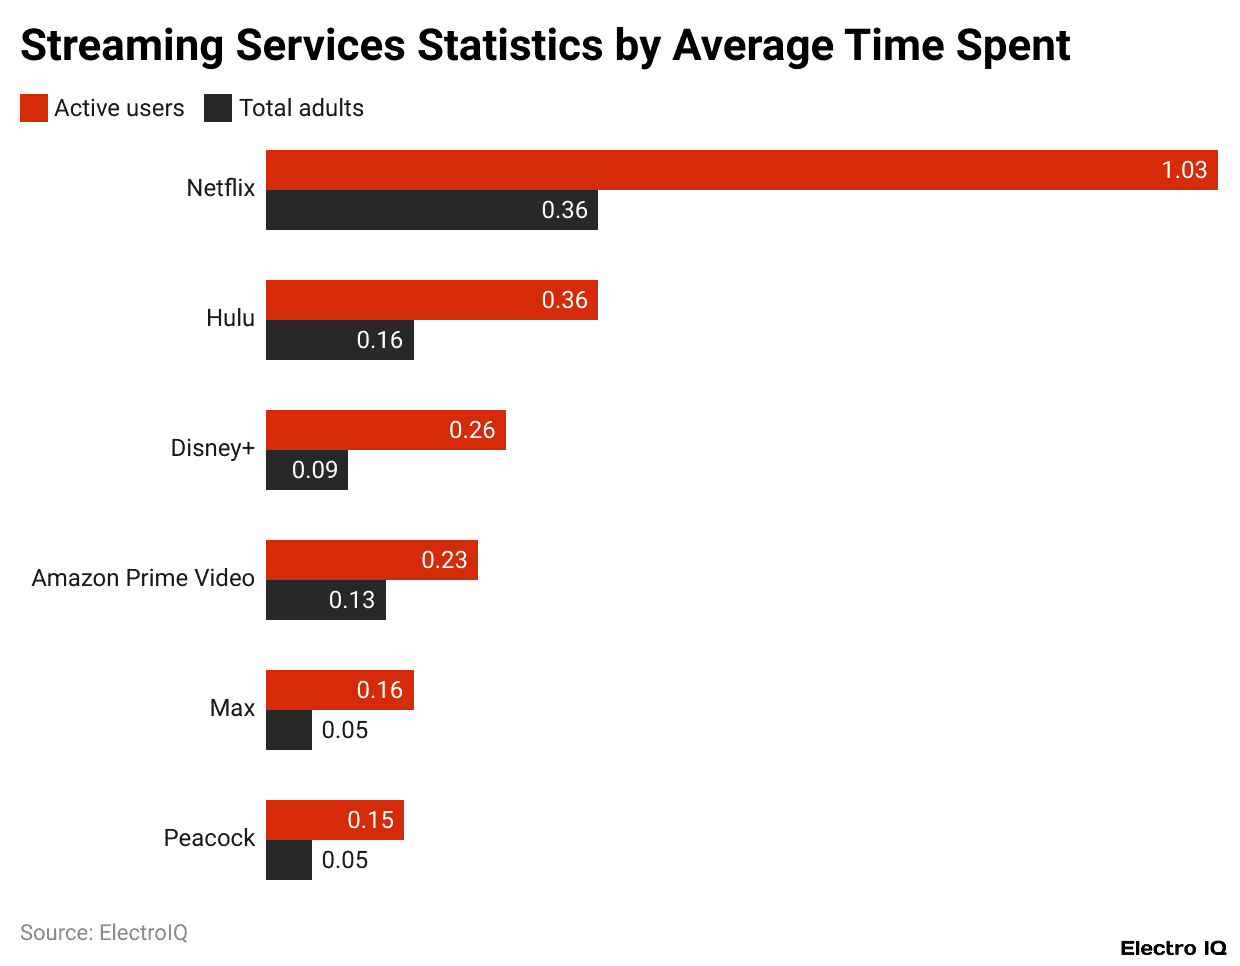
(Reference: emarketer.com)
- In 2025, streaming engagement among U.S. users showed Netflix’s dominant lead, with active users spending an average of 1 hour and 3 minutes per day, while total adults averaged 36 minutes on the platform.
- Hulu followed with 36 minutes among active users and 16 minutes among total adults.
- Disney+ users spent 26 minutes daily, compared to 9 minutes for the overall adult population.
- Amazon Prime Video recorded 23 minutes for active users and 13 minutes for all adults, while Max averaged 16 minutes and 5 minutes, respectively.
- Lastly, Peacock users watched for about 15 minutes per day, with 5 minutes among the total U.S. adult base.
Key Video Streaming App Statistics
- A Business of Apps report analysis shows that the global revenue earned by the video streaming app market was USD 233 billion in 2024.
- YouTube is termed the most used free streaming service platform, with approximately 2.4 billion users globally.
- Netflix had the highest number of paid subscribers at 277 million, while in the U.S., Amazon Prime Video and Netflix shared an almost equal market share, according to JustWatch.
- In China, Douyin was leading the market for video streaming with more than 700 million active users.
Key Factors Influencing Video Streaming Preferences
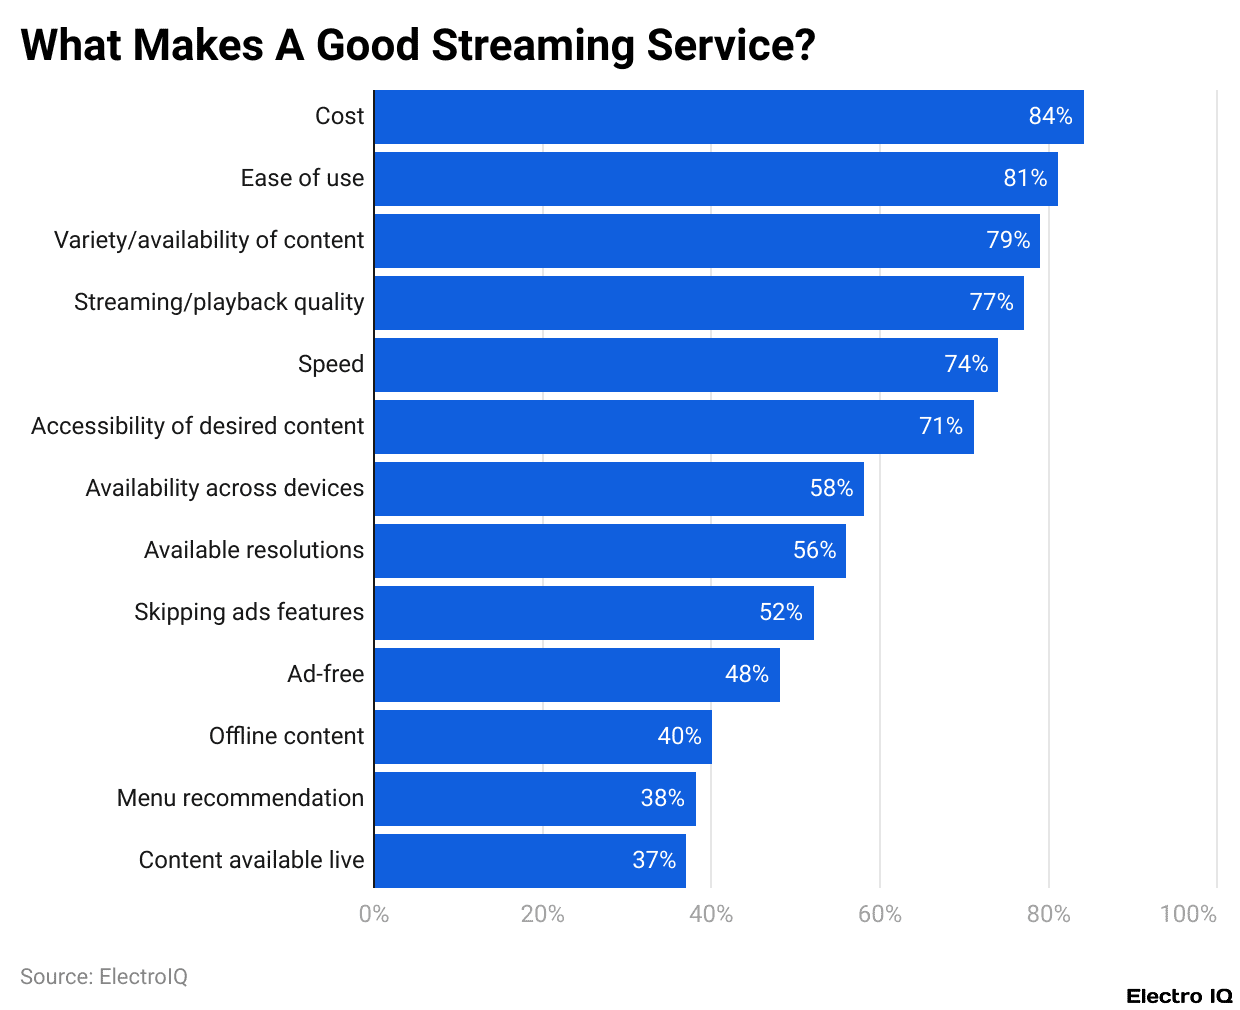
(Reference: cdn.buttercms.com)
- According to recent consumer insights, the effective reasons for choosing video streaming services are cost (84%), ease of use (81%), and variety of content (79%).
- Other crucial factors include streaming quality (77%), speed (74%), content accessibility (71%), and cross-device availability (58%), 4K resolution (56%), skipping ads (52%), ad-free experience (48%), offline downloads (40%), menu recommendations (38%), and live content (37%) also significantly shape viewer satisfaction.
In the United States
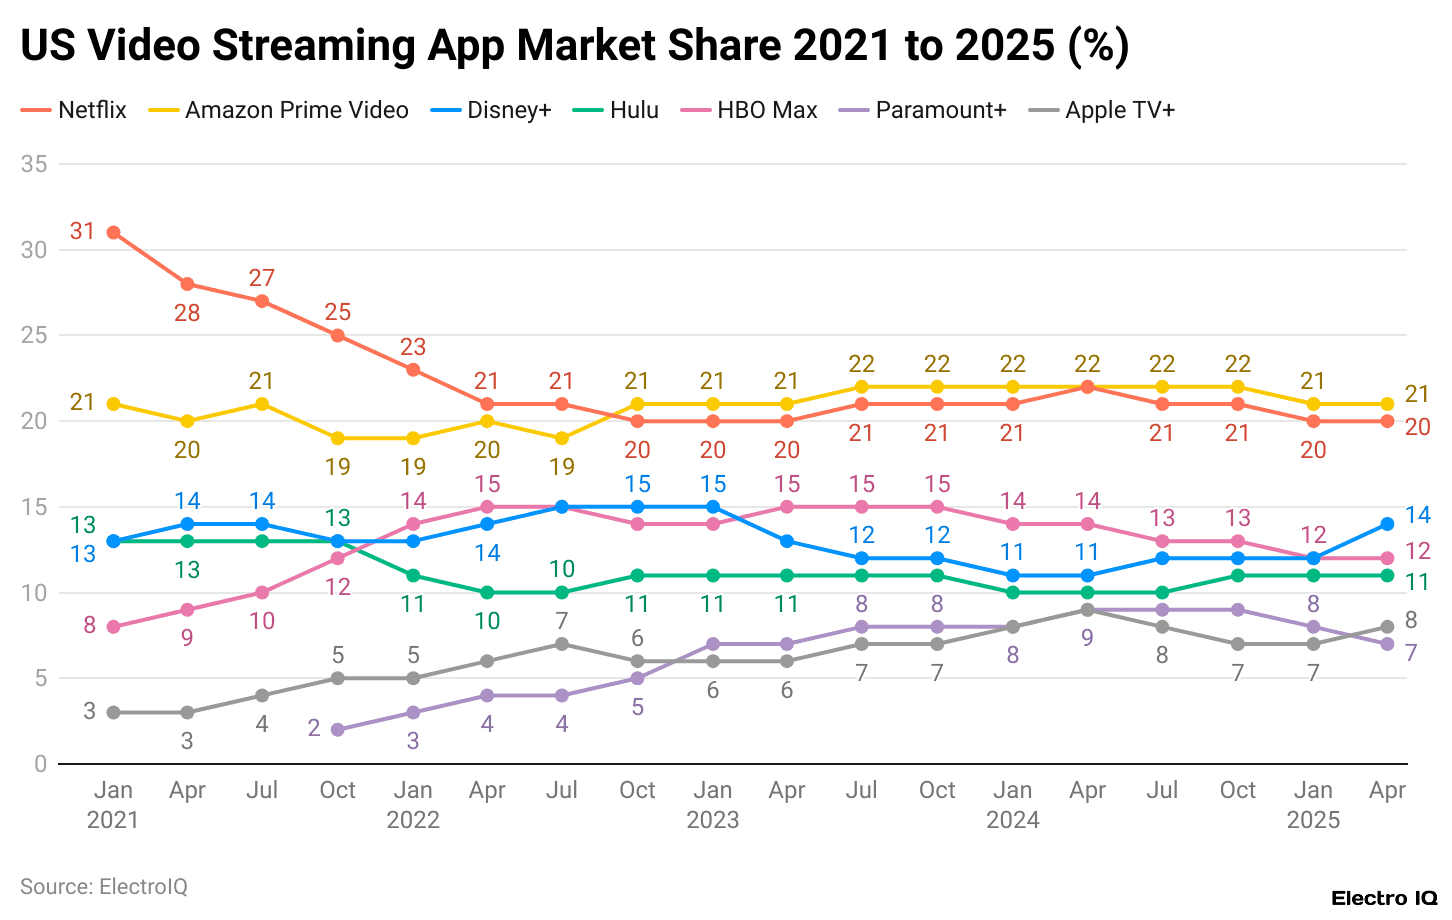
(Reference: infogram.com)
|
Streaming App
|
Market Share (2025) | |
| Q1 | Q2 | |
| Prime Video | 21% | 21% |
| Netflix | 20% | 20% |
| Disney+ | 12% | 14% |
| HBO Max | 12% | 12% |
| Hulu | 11% | 11% |
| Apple TV+ | 7% | 8% |
| Paramount+ | 8% | 7% |
Furthermore, other countries’ video streaming app market share in 2024 is as follows:
| Country | Q4 |
| United Kingdom | Prime Video: 30% Netflix: 28% Disney+: 19% WOW: 7% Apple TV+: 7% Paramount+: 3% |
| Germany | Prime Video: 26% Netflix: 22% Disney+: 17% Binge: 12% Stan: 8% Paramount+: 8% |
| Australia | Netflix: 25% Prime Video: 20% Disney+: 15% Max: 13% Globoplay: 12% Apple TV+: 7% |
| Brazil | Disney Hotstar: 23% Prime Video: 23% Netflix: 16% ZEE5: 11% Apple TV+: 11% JioCinema: 8% |
| India | Prime Video: 30% Netflix: 29% Disney+: 15% U-Next: 10% Hulu: 9% MUBI: 1% |
| Japan | Prime Video: 30% Netflix: 29% Disney+: 15% U-Next: 10% Hulu: 9% MUBI: 1% |
Reasons Viewers Stay Loyal To Video Streaming Services
- According to a report by Exploding Topics, around 28% of subscribers remain with a streaming service because they can switch to a reduced-cost, ad-supported version.
- Meanwhile, 27% cite the release of exclusive new movies or series as a key reason for staying.
- Other factors include access to simultaneous theatrical releases (23%), multiple viewing profiles (22%), offline downloads (17%), and perks such as discounts or social watch features (18%), while 9% said none of these influences their loyalty.
SVOD Cancellation And Renewal Trends By Generation
- In subscription cancellations, millennials secured the highest position with 62% ending in the past six months and 43% later renewing, followed closely by Gen Z at 57% cancellations and 38% renewals.
- In contrast, Gen X reported 43% cancellations and 20% renewals, while Boomers and older showed the lowest churn, with only 24% cancelling and 7% renewing.
- Lastly, the overall average stands at 44% cancellations and 24% renewals.
Conclusion
Streaming services are expanding quickly as more people change their viewing habits and enjoy faster internet connections with affordable plans. In 2025, major players such as Netflix, Disney+, Amazon Prime Video, and Hulu lead the market, while Hotstar, Viu, and iQIYI grow in popularity worldwide.
With more users leaving cable TV, the need for personalised suggestions, better content quality, and easy access across devices keeps increasing. The future success of streaming platforms will rely on offering value, smooth experiences, and unique entertainment choices.
FAQ.
They are popular for flexibility, low-cost plans, and unlimited, ad-free access across multiple devices.
Streaming services work by sending digital audio or video data over the internet, allowing users to watch instantly without downloading.
They need a stable internet connection, a compatible device, and an active subscription or account.
Streaming lets you watch or listen in real time over the internet, while downloading saves the file to your device for offline use.
Yes, some services like Tubi, Pluto TV, and Crackle offer free content supported by ads, known as AVOD (Ad-Supported Video on Demand).

I hold an MBA in Finance and Marketing, bringing a unique blend of business acumen and creative communication skills. With experience as a content in crafting statistical and research-backed content across multiple domains, including education, technology, product reviews, and company website analytics, I specialize in producing engaging, informative, and SEO-optimized content tailored to diverse audiences. My work bridges technical accuracy with compelling storytelling, helping brands educate, inform, and connect with their target markets.