Social Media Statistics By Users, Networks, Platform Use, Advertising And Marketing, Trends and Insights (2025)
Updated · Dec 19, 2025

Table of Contents
- Introduction
- Editor’s Choice
- General Social Media Statistics
- Number of Social Media Users Statistics
- Most Used Social Media Networks By Number Of Users
- Global Social Media Use Statistics
- Self-Declared Social Media Platform Use Statistics
- Favourite Social Media Platforms Analysis
- Main Reasons For Using Social Media Statistics
- Social Media User Statistics By Platforms
- Ad Spending On Social Media Advertising Statistics
- Facebook Statistics
- YouTube Statistics
- Whatsapp Statistics
- Instagram Statistics
- TikTok Statistics
- AI In Social Media Marketing Statistics
- Preferred Social Media Content Formats
- Conclusion
Introduction
Social Media Statistics: Social media has become an integral part of everyday life. People use it to talk, learn new things, shop, and relax. Every like, share, comment, and view creates data that shows what people enjoy and how they behave online. Knowing these social media statistics can help businesses plan more effective ads, assist creators in reaching a wider audience, and enable users to better understand the online world around them.
In this article, we examine key statistics from major platforms, including user counts and content engagement patterns. By studying these facts, you will see how social media shapes opinions, influences choices, and reshapes industries, and learn how to use it more wisely.
Editor’s Choice
- As of 2025, the total number of social media users worldwide is projected to reach approximately 5.42 billion, up from 5.17 billion in 2024.
- In February 2025, Facebook led all social platforms with 3,070 million monthly active users.
- In October 2025, the world counted 5.66 billion social media user identities.
- People spent an average of 18 hours and 36 minutes per week on social platforms.
- As of October 2025, 56.9% of internet users aged 16+ reported using Facebook at least once in the past month, followed by YouTube (55.4%), Instagram (55.1%), and WhatsApp (54.0%).
- According to datareportal.com, WhatsApp ranked as the top favourite platform among active social media users aged 16+, selected by 17.4% of users.
- WhatsApp ranked as the top favourite platform among active social media users aged 16+, selected by 17.4% of users.
- The top reason people used social media was to keep in touch with friends and family, chosen by 50.2% of users.
- In February 2025, the worldwide gender distribution of social media audiences shows Instagram with 52.7% male and 47.3% female users.
- AI is increasingly important in social media work, as 72% report better results with AI-generated content and 71% already use these tools.
- As of 2024, consumers showed the strongest interest in short-form videos under 15 seconds, with 42% choosing this format.
General Social Media Statistics
(Reference: statista.com)
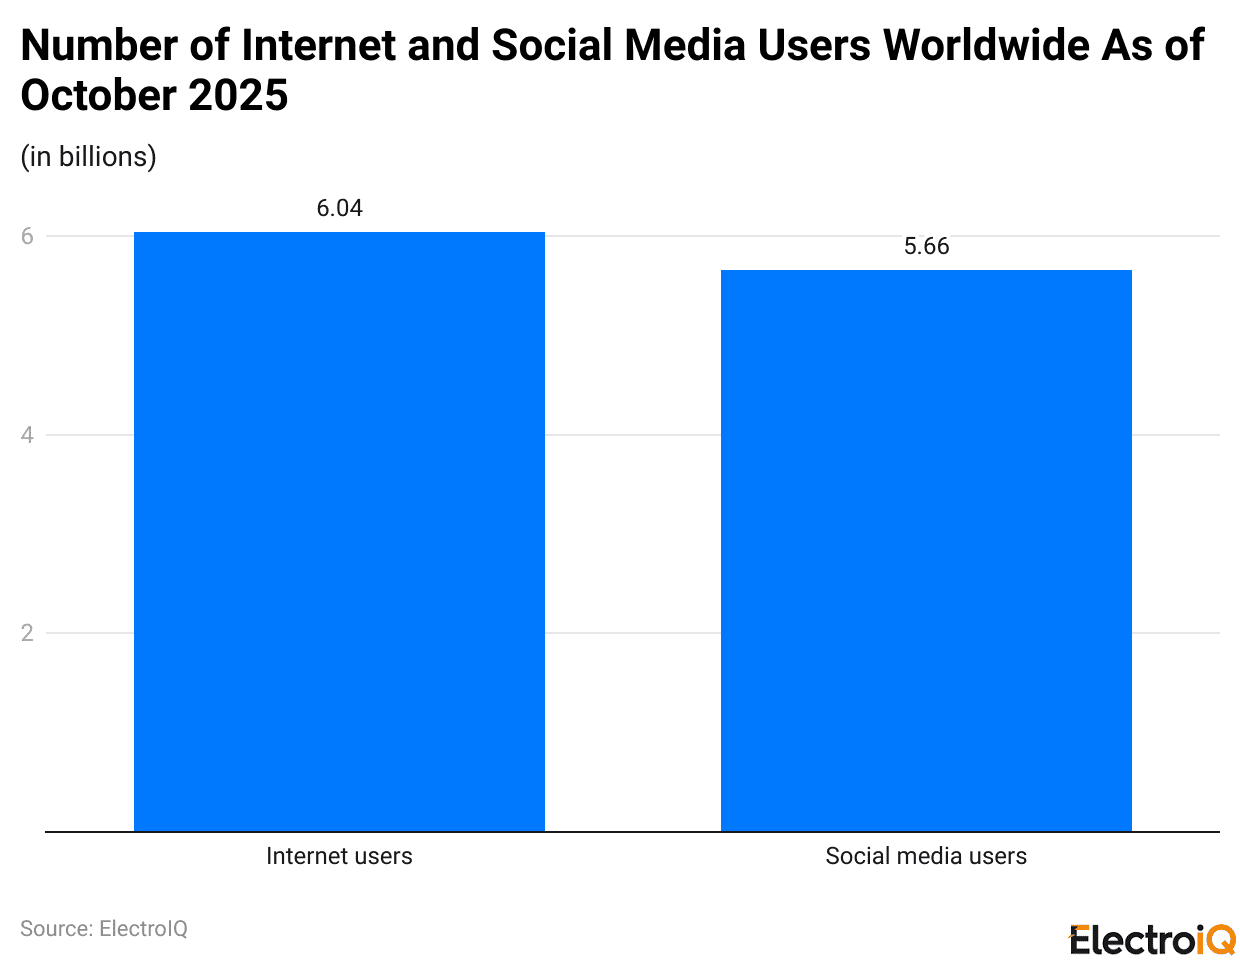
- As of October 2025, approximately 6.04 billion people used the internet, representing approximately 73% of the global population.
- Approximately 5.66 billion people used social media, representing about 69% of the global population.
Number of Social Media Users Statistics
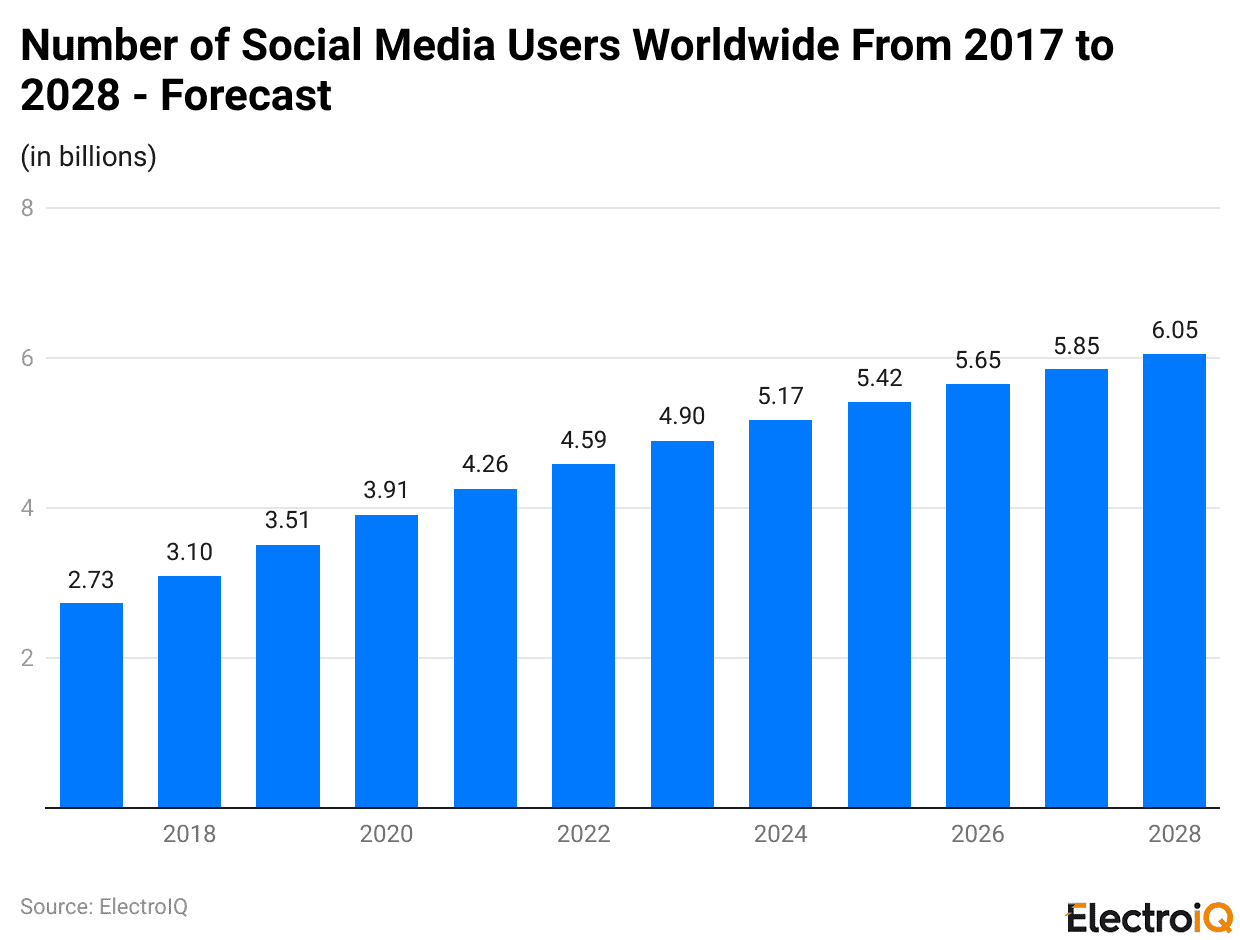
- As of 2025, the total number of social media users worldwide is projected to reach approximately 5.42 billion, up from 5.17 billion in 2024.
- In the coming years, the estimated number of users is projected to reach approximately 5.56 billion by 2026, 5.58 billion by 2027, and 6.05 billion by 2028.
Most Used Social Media Networks By Number Of Users
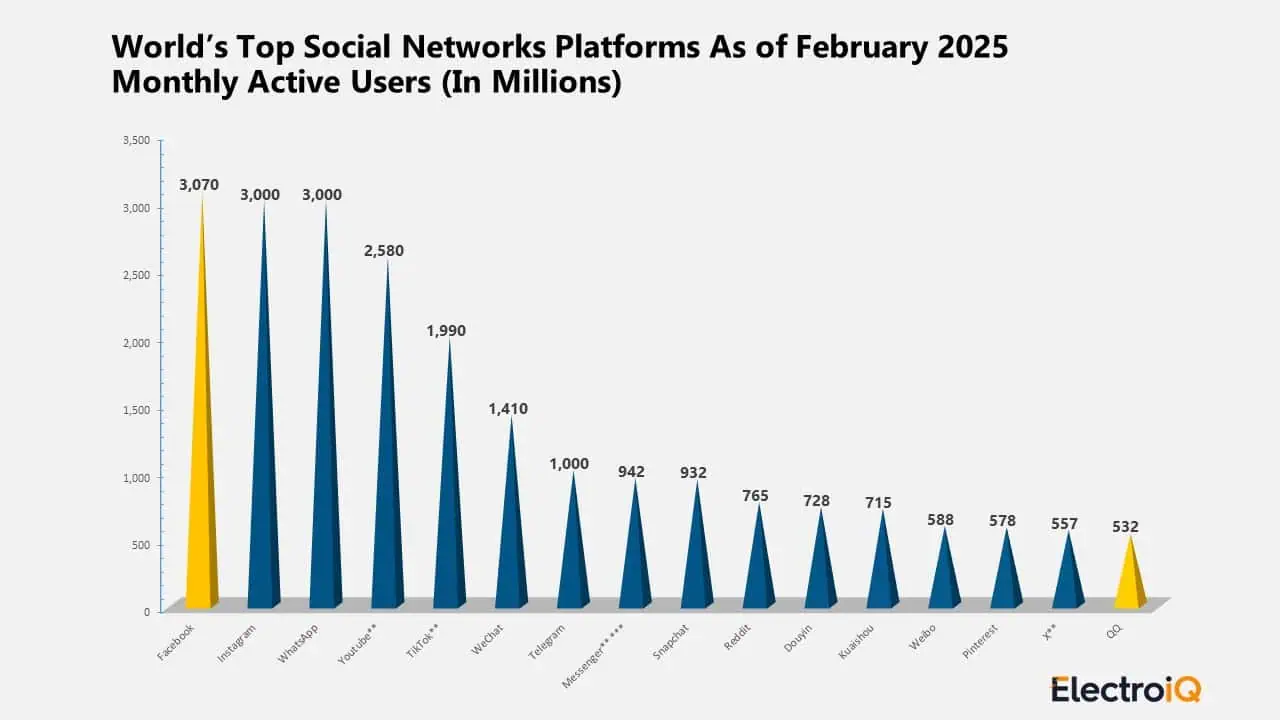
- In February 2025, Facebook led all social platforms with 3,070 million monthly active users.
- Users of Instagram and WhatsApp each accounted for 3,000 million users.
- Furthermore, other social media users are followed by YouTube (2,580 million), TikTok (1,990 million), WeChat (1,410 million), Telegram 1,000 million Messenger (942 million), Snapchat (932 million), Reddit (765 million), Douyin (728 million), Kuaishou (715 million), Weibo (588 million), Pinterest (578 million), X ( 557 million) and QQ (532 million).
Global Social Media Use Statistics
(Source: squarespace-cdn.com)
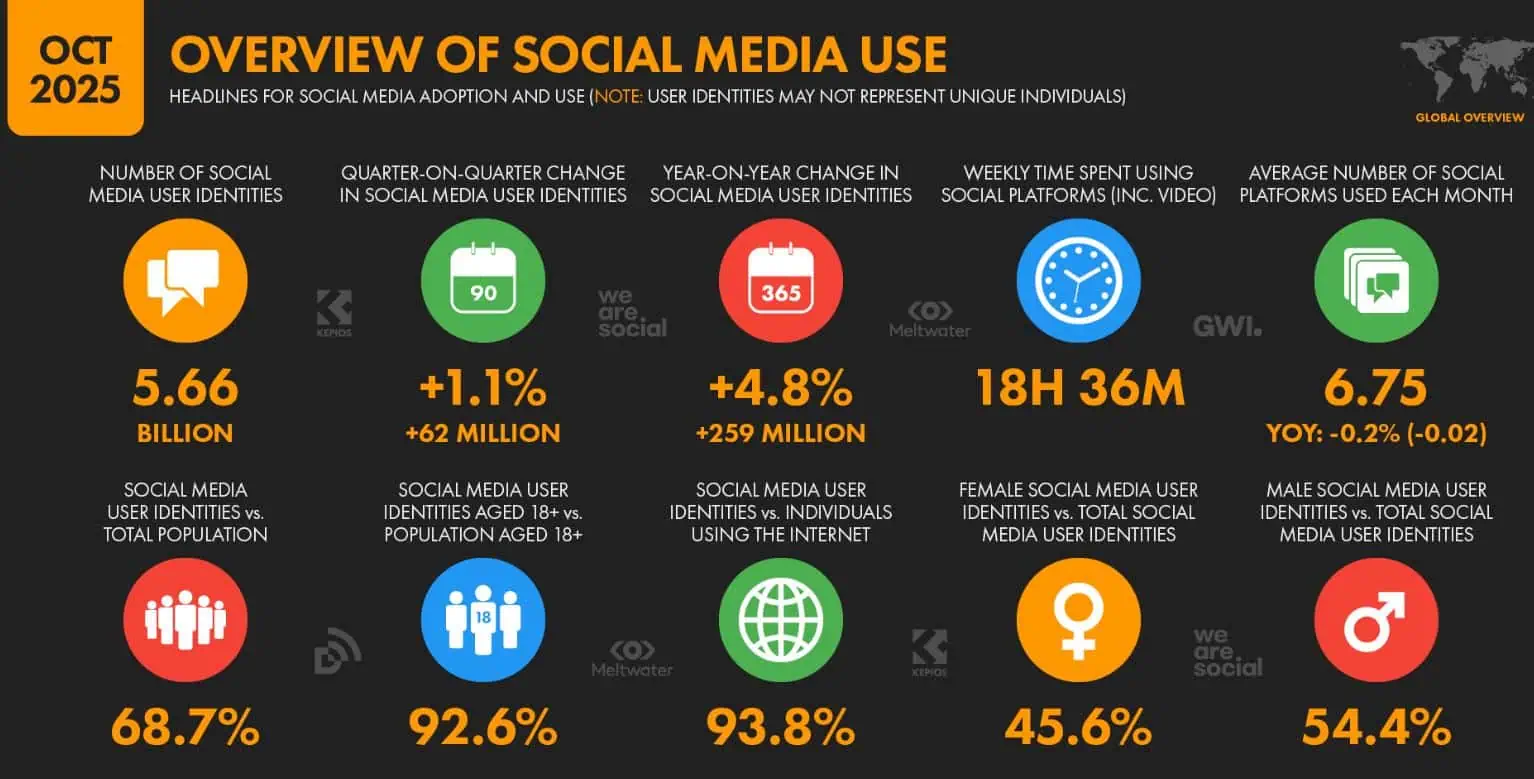
- In October 2025, the world counted 5.66 billion social media user identities.
- This total rose by 1.1% quarter-on-quarter, representing an increase of 62 million users, and by 4.8% year-on-year, adding 259 million users.
- People spent an average of 18 hours and 36 minutes per week on social platforms, and used approximately 6.75 different platforms per month, a slight year-on-year decrease of 0.2% (0.02 platforms).
- Social media identities represented 68.7% of the global population and 92.6% of adults aged 18 and above.
- They also accounted for 93.8% of all internet users.
- Females accounted for 45.6% of social media identities, whereas males accounted for 54.4%.
Self-Declared Social Media Platform Use Statistics
(Source: squarespace-cdn.com)
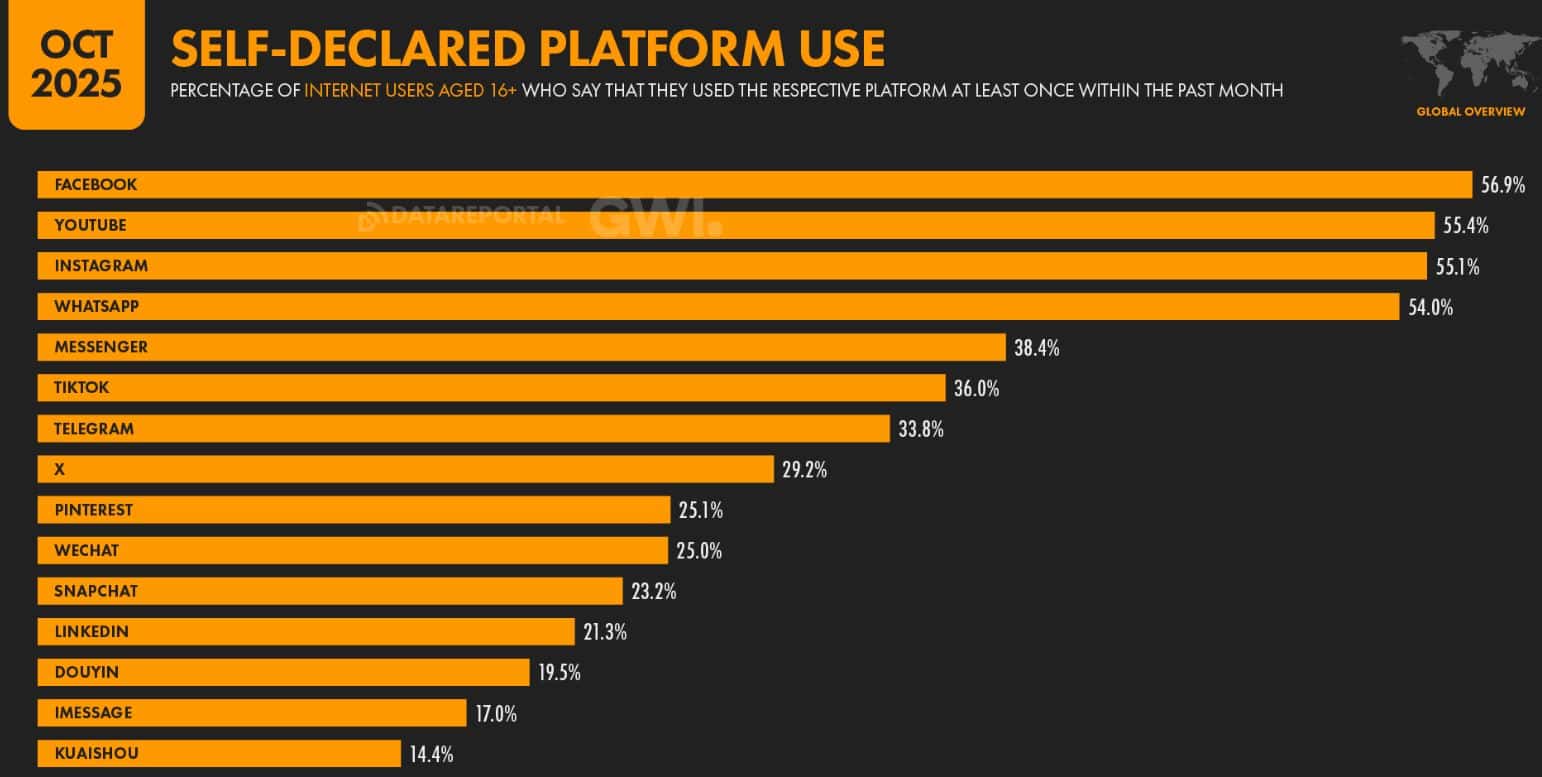
- As of October 2025, 56.9% of internet users aged 16+ reported using Facebook at least once in the past month, followed by YouTube (55.4%), Instagram (55.1%), and WhatsApp (54.0%).
- Other shares includes Messenger (38.4%), TikTok (36.0%), Telegram (33.8%), X (29.2%), Pinterest (25.1%), WeChat (25%), Snapchat (23.2%), LinkedIn (21.3%), Douyin (19.5%), iMessage (17%), and Kuaishou (14.4%).
Favourite Social Media Platforms Analysis
- According to datareportal.com, WhatsApp ranked as the top favourite platform among active social media users aged 16+, selected by 17.4% of users.
- Instagram was the next closest at 16.4%, followed by Facebook at 13.0% and WeChat at 11.4%.
- TikTok was selected by 9.1% of users, Douyin by 7.3%, X by 2.8%, Telegram by 2.5%, and Messenger by 2.1%.
- Users followed by LINE (1.7%), Pinterest (1.6%), Snapchat (1.4%), Kuaishou (1.3%), iMessage (1%), and Xiaohongshu (1%).
Total Social Media Ad Audiences Statistics (October 2025)
| Platforms | Potential Advertising Reach |
| YouTube | 2.58 billion |
| 2.35 billion | |
| TikTok | 1.99 billion |
| 1.91 billion | |
| 1.33 billion | |
| Messenger | 942 million |
| 765 million | |
| Snapchat | 738 million |
| X | 557 million |
| 351 million | |
| Threads | 142 million |
Country-Wise Social Media Brand Usage Statistics by Generation, 2024
| Social Media Platforms | Total | GenZ | Millennials/GenY | Gen X | Baby Boomers |
| United States | |||||
| 70% | 55% | 76% | 76% | 70% | |
| 50% | 66% | 55% | 39% | 26% | |
| 16% | 11% | 19% | 18% | 16% | |
| TikTok | 41% | 59% | 44% | 30% | 16% |
| X (Twitter) | 24% | 31% | 31% | 19% | 14% |
| Germany | |||||
| 58% | 37% | 64% | 64% | 59% | |
| 58% | 78% | 64% | 47% | 34% | |
| 12% | 10% | 15% | 13% | 9% | |
| TikTok | 41% | 66% | 43% | 30% | 18% |
| X (Twitter) | 15% | 16% | 18% | 12% | 10% |
| United Kingdom | |||||
| 74% | 63% | 80% | 76% | 71% | |
| 58% | 75% | 66% | 44% | 31% | |
| 23% | 22% | 28% | 21% | 15% | |
| TikTok | 42% | 68% | 47% | 27% | 14% |
| X (Twitter) | 31% | 37% | 35% | 26% | 20% |
Country-Wise Social Media Usage Frequency Statistics by Generation, 2024
| Frequency | Total | GenZ | Millennials/GenY | Gen X | Baby Boomers |
| United States | |||||
| Daily | 67% | 60% | 69% | 70% | 68% |
| Several times a week | 15% | 19% | 14% | 12% | 13% |
| Once a week | 5% | 7% | 4% | 4% | 5% |
| Several times a month | 3% | 4% | 3% | 3% | 2% |
| Once a month | 1% | 2% | 1% | 1% | 1% |
| Less often | 3% | 3% | 3% | 3% | 4% |
| Germany | |||||
| Daily | 63% | 71% | 66% | 60% | 50% |
| Several times a week | 19% | 16% | 19% | 20% | 20% |
| Once a week | 5% | 5% | 4% | 4% | 5% |
| Several times a month | 3% | 2% | 3% | 4% | 3% |
| Once a month | 1% | 1% | 1% | 1% | 2% |
| Less often | 4% | 3% | 3% | 4% | 5% |
| United Kingdom | |||||
| Daily | 70% | 65% | 73% | 71% | 68% |
| Several times a week | 16% | 20% | 16% | 15% | 12% |
| Once a week | 5% | 7% | 5% | 4% | 3% |
| Several times a month | 2% | 3% | 2% | 2% | 2% |
| Once a month | 1% | 1% | 1% | 1% | 1% |
| Less often | 2% | 2% | 1% | 2% | 3% |
Main Reasons For Using Social Media Statistics
- The top reason people used social media was to keep in touch with friends and family, chosen by 50.2% of users.
- Other major motivations included filling spare time (39.7%), reading news stories (35.4%), seeking content such as articles or videos (30.3%), and seeing what others were talking about (28.9%).
- Users also turned to social platforms to find products to purchase (27.3%), get inspiration for activities or purchases (27.1%), follow sports (23.5%), watch live streams (23.4%), and make new contacts (22.8%).
- Additional reasons included seeing brand content (22.7%), sharing opinions (22.5%), work-related research (21.5%), following influencers (20.4%), and avoiding missing out on trends (20.2%).
By Age Group
| Years | Friends & Family | Fill Spare Time | Find Content | See Trending Topics | Read News Stories | Ideas (Things to Do & Buy) |
| 16 to 24 | 48.0% | 44.3% | 33.4% | 32.2% | 30.4% | 28.4% |
| 25 to 34 | 48.3% | 40.6% | 32.5% | 31.1% | 34.7% | 28.5% |
| 35 to 44 | 49.6% | 38.6% | 30.7% | 30.0% | 36.6% | 28.3% |
| 45 to 54 | 51.8% | 38.3% | 29.0% | 27.4% | 38.9% | 27% |
| 55 to 64 | 53.7% | 36.9% | 26.6% | 24.4% | 39.5% | 24.2% |
| 65+ | 59.2% | 29.6% | 16.0% | 14.0% | 34.2% | 15.5% |
Social Media User Statistics By Platforms
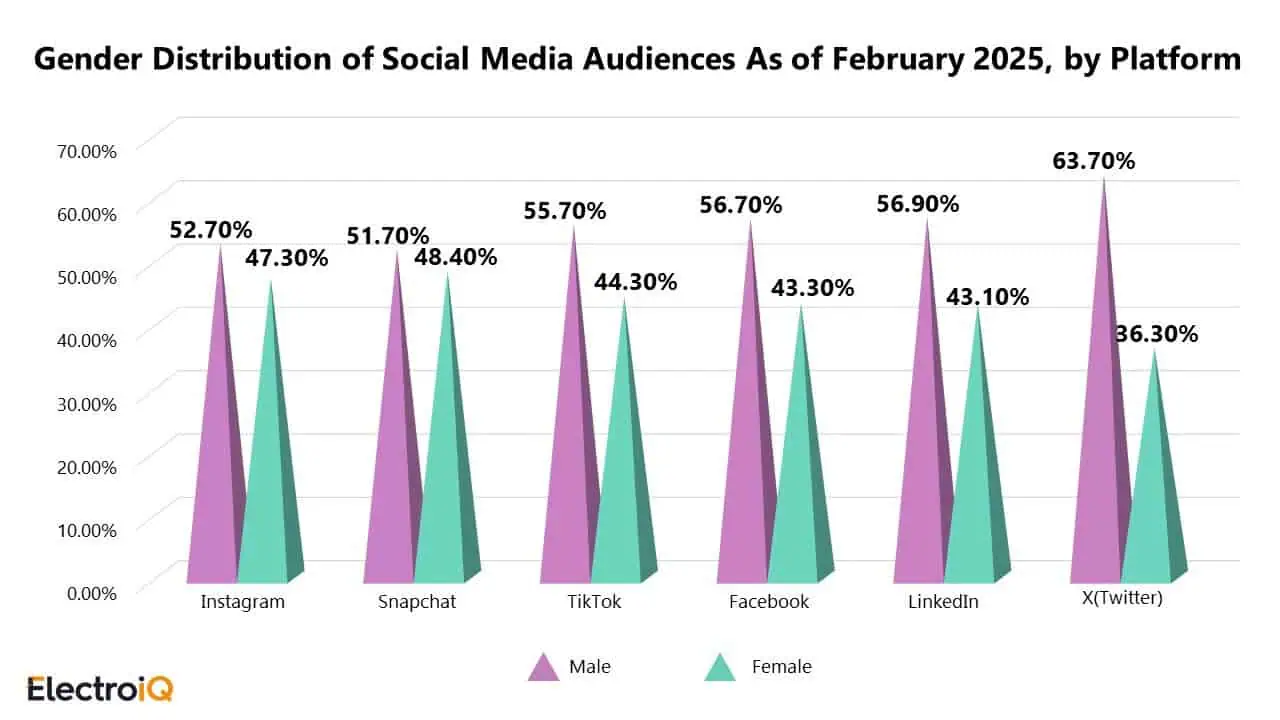
- In February 2025, the worldwide gender distribution of social media audiences shows Instagram with 52.7% male and 47.3% female users.
- Male and female user shares in other platforms are followed by Snapchat (50.7% and 48.4%), TikTok (55.7% and 44.3%), Facebook (56.7% and 43.3%), LinkedIn (56.9% and 43.1%), and X (Twitter) (63.7% and 36.3%), respectively.
Ad Spending On Social Media Advertising Statistics
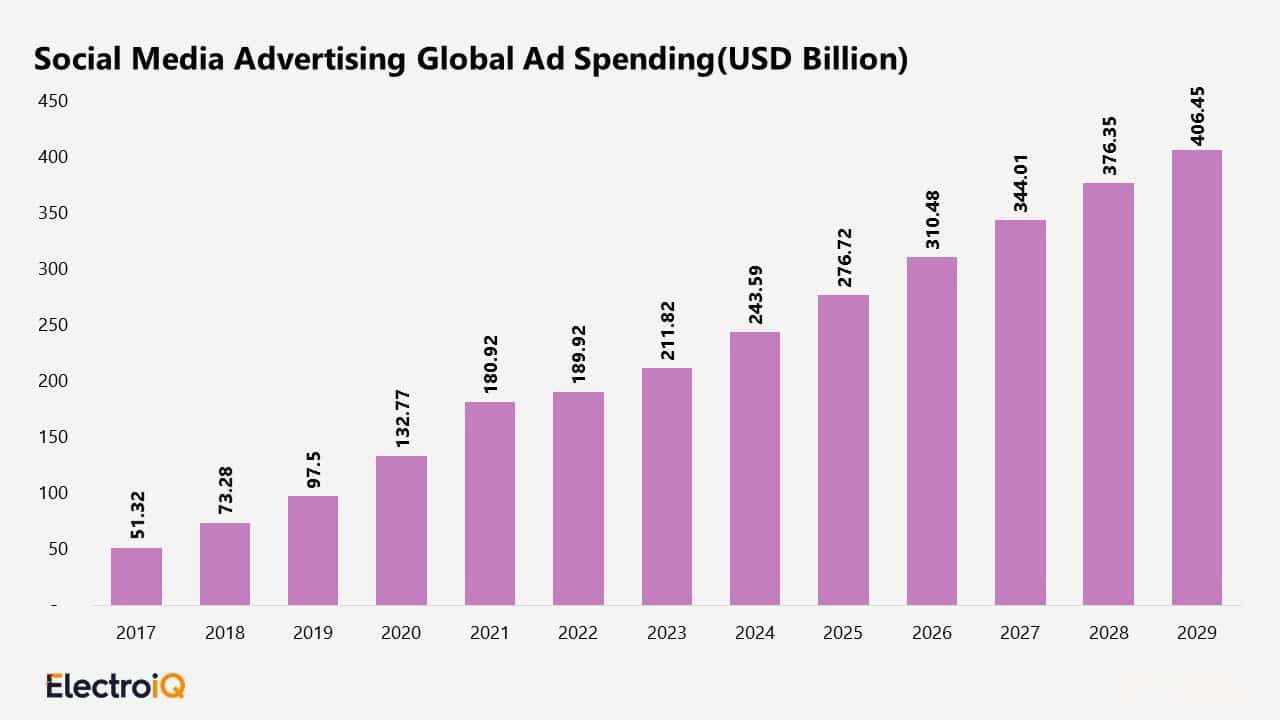
- Global social media advertising spending rose steadily from USD 51.32 billion in 2017 to USD 73.28 billion in 2018 and USD 97.5 billion in 2019.
- It reached USD 132.77 billion in 2020, USD 180.92 billion in 2021, and USD 189.5 billion in 2022. Spending then rises to 211.82 billion in 2023 and to 243.59 billion in 2024.
- The market is expected to reach USD 276.72 billion in 2025, USD 310.48 billion in 2026, USD 344.01 billion in 2027, USD 376.35 billion in 2028, and USD 406.45 billion in 2029.
Facebook Statistics
- According to DemandSage, in 2025, Facebook remains the largest social network, with approximately 3.07 billion monthly active users and 2.11 billion daily active users.
- Around 68.7% of users log in each day. India has around 581.6 million users, while the United States has 279.8 million.
- The largest age group is 25-34, accounting for 31.1% of the audience.
- Facebook’s global user base is approximately 43.2% female and 56.8% male, and users spend approximately 32 minutes per day on the platform.
- Facebook’s ad revenue in 2025 is forecast at USD 123.73 billion, an increase of approximately 1.6% over the previous year.
YouTube Statistics
- A report by Podbase states that in 2025, YouTube had approximately 2.53 billion users worldwide, representing 46% of all internet users.
- Approximately 122 million people use the platform daily, according to moodive.com.
- Globally, users spend nearly 27 hours per month on YouTube, while U.S. users average 35 minutes per day.
- Meanwhile, Indian adults watch more than 72 minutes per day, and Britons watch 51 minutes.
- In the U.S., 84% of adults report using YouTube.
- According to Tech Crunch, in the second quarter of 2025, ad revenue reached USD 9.8 billion, up from USD 8.7 billion a year earlier, and Q3 revenue climbed to USD 10.26 billion, about 15% higher than Q2.
- Other estimates place monthly users at 2.85 billion and daily viewing at more than 1 billion hours.
Whatsapp Statistics
- resourcera.com report further states that in 2025, WhatsApp remains the leading messaging app, with estimates ranging from 2.8 billion to 3.3 billion active users worldwide.
- Meta reported more than 3 billion monthly active users in May 2025.
- It is estimated that there were over 764.38 million monthly active Business users in 2025, a 2.25% increase from 747.57 million in 2024.
- Downloads of the separate WhatsApp Business app reached 170.9 million in 2025, bringing all-time downloads to approximately 1.3 billion.
- Analysts say 80% of large enterprises plan to adopt the WhatsApp Business API by 2025.
- WhatsApp’s network now carries roughly 130 billion messages per day.
Instagram Statistics
- Demand Sage’s report analysis indicates that Instagram’s user base reached 2 billion people per month in 2025 and that approximately 500 million people use it daily.
- India is the biggest market, with 413.8 million Instagram users.
- Looking at the world as a whole, 49.4% of users are women and 50.6% are men, and 62.3% are in the 18-34 age group.
- The United States has 171.7 million Instagram users.
- In the U.S., 54.8% of users are also between 18 and 34 years old, 55.4% are women, and 44.6% are men.
TikTok Statistics
- TikTok currently has about 1.59 billion monthly active users worldwide and is expected to reach 1.9 billion users in total.
- The United States is its largest market, with approximately 135.79 million users of the app.
- In 2024, TikTok generated approximately $23 billion in revenue, a 42.86% increase from the previous year.
- U.S. users spend a substantial amount of time on the app, averaging 53.8 minutes per day.
- Most TikTok creators are young adults aged 18-24.
- Meanwhile, the U.S. has the largest creator and user base, with 135.79 million users.
AI In Social Media Marketing Statistics
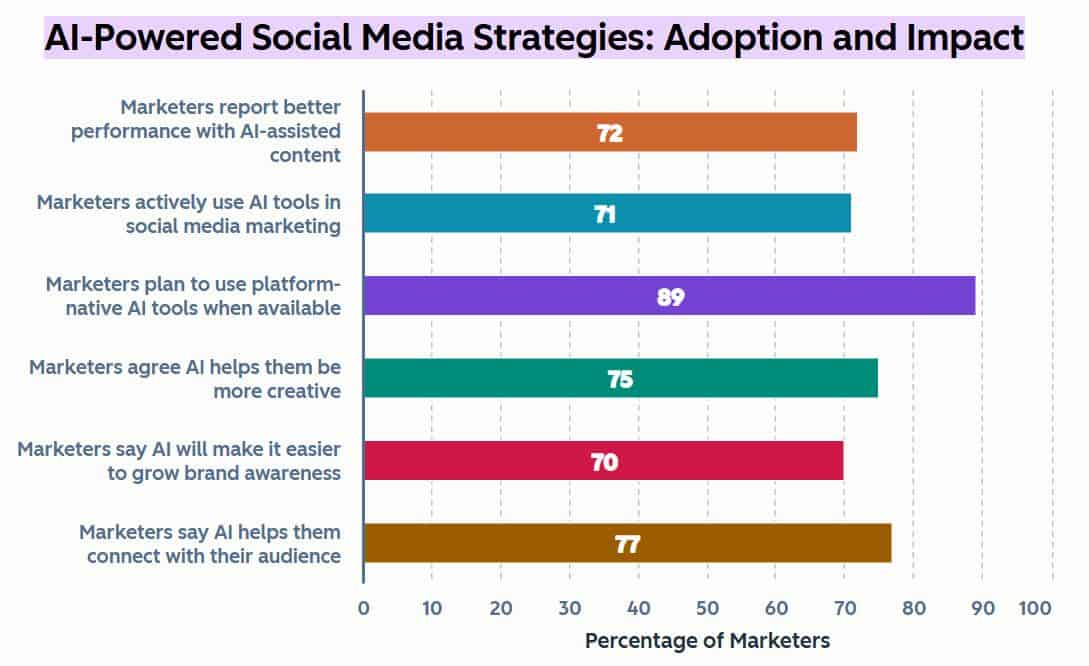
(Source: hubspot.com)
- AI is increasingly important in social media work, as 72% report better results with AI-generated content and 71% already use these tools.
- Meanwhile, 89% planned to adopt platform-native AI tools as they become available.
- Marketers also say AI boosts creativity (75%), strengthens audience connection (77%), and makes it easier to build brand awareness (70%).
Preferred Social Media Content Formats
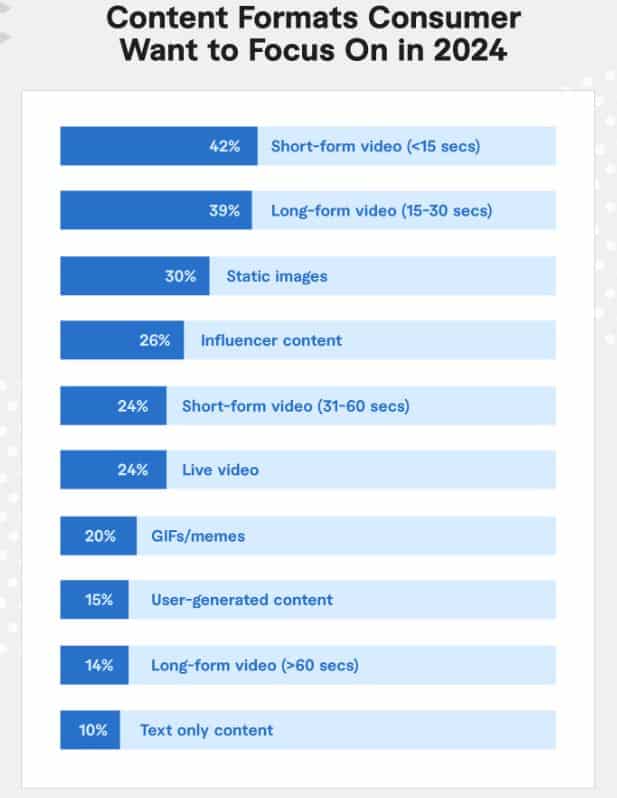
(Source: clearvoice.com)
- As of 2024, consumers showed the strongest interest in short-form videos under 15 seconds, with 42% choosing this format.
- Long-form videos lasting 15-30 seconds were preferred by 39%, whereas 30% preferred static images.
- Influencer content appealed to 26% of consumers, and both 31-60-second short-form videos and live videos were selected by 24%.
- Additionally, 20% preferred GIFs or memes, 15% favoured user-generated content, and 14% preferred long-form videos longer than 60 seconds.
- Text-only content was the least popular format, chosen by just 10% of consumers.
Conclusion
Social media metrics indicate that these platforms are now central to everyday life, not merely additional tools. They reveal rapidly growing user bases, increased use of mobile phones, and a clear preference for short, visual posts. The same data also shows how crowded social media is and why honest, fast interaction matters. People and organisations that study these statistics can plan more effectively, reach the right audience, and adapt to new online trends. In simple terms, these numbers tell the story of how we behave online.
FAQ.
Facebook, Instagram, WhatsApp, YouTube, Snapchat, X (Twitter), and TikTok.
People use social media to connect, share experiences, get news, learn, express themselves, and relax.
Social media is both beneficial and harmful, improving communication while sometimes compromising privacy and well-being.
Social media addiction is compulsive, excessive use that harms life and well-being.
Use strong passwords, limit sharing of personal information, avoid interacting with strangers, think before posting, update privacy settings, and report abuse.
A social media algorithm is a formula deciding which posts you see based on activity.

Maitrayee Dey has a background in Electrical Engineering and has worked in various technical roles before transitioning to writing. Specializing in technology and Artificial Intelligence, she has served as an Academic Research Analyst and Freelance Writer, particularly focusing on education and healthcare in Australia. Maitrayee's lifelong passions for writing and painting led her to pursue a full-time writing career. She is also the creator of a cooking YouTube channel, where she shares her culinary adventures. At Smartphone Thoughts, Maitrayee brings her expertise in technology to provide in-depth smartphone reviews and app-related statistics, making complex topics easy to understand for all readers.


