Anker Innovations Statistics By Revenue, Products and Facts (2025)
Updated · Nov 12, 2025

Table of Contents
Introduction
Anker Innovations Statistics: Anker has become the company that powers the world, basically. In 2025, the Shenzhen-based company, which had started its journey with a single tiny power bank, had expanded to become a multi-brand electronics group and was currently selling chargers, speakers, robot vacuums, projectors, and smart-home gear in dozens of countries. The present article examines the Anker Statistics for the period of 2024 to mid-2025.
Editor’s Choice
- Anker’s Earnings Per Share reached ¥3.99, indicating strong profitability per share.
- Sales per share were ¥46.41, indicating solid revenue generation across the share base.
- The Tangible Book Value per share was ¥16.79, meaning that the company has a healthy asset position compared to its liabilities.
- Operating Profit per share reached ¥3.89, which indicates that the core business is operating efficiently.
- Revenue from Charging and Energy Storage almost tripled from 2020 to 2024, reaching ¥12.67 billion.
- Intelligent Innovation’s revenue has more than doubled, reaching ¥6.34 billion in 2024.
- Smart Audio & Video revenue has increased to ¥5.69 billion, indicating strong consumer adoption.
- China remained the region with the best performance, with revenue increasing to ¥30.12 billion in 2024.
- Dividends per share increased consistently to ¥2.10 in 2024, indicating strong returns to shareholders.
- The dividend yield increased to 2.15%, accompanied by a payout ratio of 52.58%, indicating that a higher proportion of profit is being distributed.
- The market capitalization increased from ¥26.99 billion in early 2023 to ¥38.37 billion, which is a sign of investor confidence.
- The enterprise value was ¥35.63 billion, indicating that the business has been performing and growing strongly.
- The EV/EBITDA ratio of 18.95 indicates that the company is a well-run business with a healthy profit margin.
History of Anker Innovations
- 2011 → Anker Innovations was founded by Steven Yang, a former Google engineer, to make dependable charging accessories.
- 2012 → Early product expansion included the Astro Slim2 4,500 mAh power bank; Anker began building its Amazon marketplace presence.
- 2014 → PowerIQ fast-charging technology was introduced at CES; Anker also broadened into audio, with Soundcore speakers becoming Amazon bestsellers.
- 2016 → The smart-home brand eufy was launched to enter robot vacuums, security cameras, and other home IoT products.
- 2017 → The Nebula projector line debuted with the Mars model, followed by the Capsule portable projector crowdfunded on Indiegogo.
- 2018 → Soundcore was formalized as Anker’s dedicated audio sub-brand on 25 April 2018; Anker also began adopting GaN components for smaller, more efficient chargers.
- 2019 → Anker’s brand recognition rose globally, with coverage noting strong sales for portable batteries on Amazon and continued R&D around GaN charging.
- 2020 → Anker Innovations completed its IPO on the Shenzhen Stock Exchange (ticker 300866) on 24 August 2020.
- 2021 → The AnkerWork line expanded into professional webcams and conference speakers, reflecting demand for hybrid-work peripherals.
- 2022 → eufy faced scrutiny over security and privacy claims for certain cameras; public statements and policies were revised after media investigations.
- 2023 → The Anker SOLIX energy brand was launched for residential power solutions, including portable power stations and balcony solar systems.
- 2024 → Continued portfolio refreshes in GaN charging, audio, and smart-home categories under Anker, Soundcore, eufy, and AnkerWork sub-brands.
- 2025 → Anker exited consumer 3D printing, ending sales of AnkerMake M5 and M5C and shifting creation tools to eufyMake; Nebula projectors were integrated with Soundcore, unveiling the Soundcore Nebula X1 Pro with 4K triple-laser projection and up to 3,500 ANSI lumens.
Fun Facts About Anker Innovations
- Founded in 2011 by former Google engineer Steven Yang; the company later based its headquarters in Changsha, Hunan and operates 30+ offices worldwide.
- Listed on China’s Shenzhen ChiNext exchange under ticker 300866; operates as a public company.
- Products are available in 146 countries; 54 million units were sold in 2020 as the brand rose to the top of mobile charging.
- Anker positions itself as the world’s No. 1 mobile charging brand for 2020, 2021, and 2022.
- The portfolio spans multiple sub-brands, including Anker, Soundcore, Eufy, and Anker Solix, among others, serving the audio, smart home, and energy storage categories.
- The company popularized GaN fast-charging and launched its GaNPrime platform in July 2022, with chargers rated up to 150 W.
- Recognition for industrial design is robust; in April 2025 Anker secured 17 Red Dot Product Design awards.
- The scale of users is substantial, with products distributed in over 140 countries and a claimed 100 million+ users worldwide.
- Safety actions have been taken: a 2023 U.S. recall of the Anker 535 power bank and a broader 2025 recall affecting approximately 481,000 units in the U.S. were initiated to address battery overheating risks.
- The Eufy security line drew scrutiny in 2022–2023 over cloud and encryption practices, prompting public clarifications and policy changes.
- Retail presence began primarily on online marketplaces and has expanded into major global retailers, while maintaining a strong direct-to-consumer channel.
- Beyond phone accessories, Anker now markets portable power stations and home energy products under Anker Solix, reflecting a shift into broader consumer energy solutions.
(Source: wsj.com)
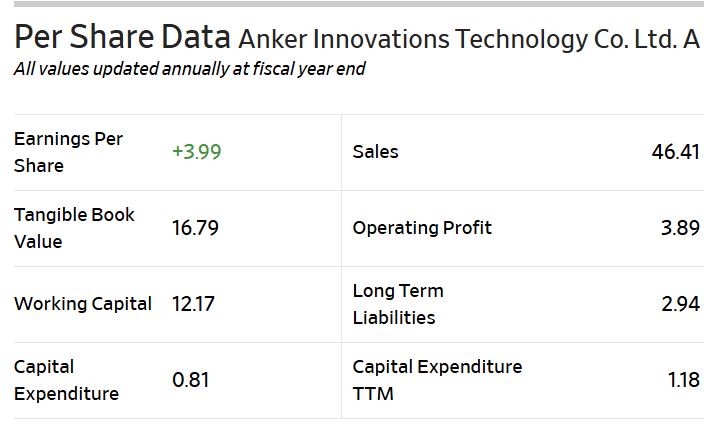
- The aforementioned data represent crucial financial metrics for Anker Innovations Technology Co. Ltd. calculated on a per-share basis; hence, they are the company’s performance and financial position divided by the total number of shares outstanding.
- The 3.99 EPS signifies that each stockholder received a profit of ¥3.99 from Anker’s fiscal year earnings for their share of the company.
- This figure indicates the amount of the company’s net income allocated to each stock. Meanwhile, EPS, being a universal standard, is frequently used to assess annual income and make comparisons between companies.
- Each share’s sales of 46.41 indicate that it represents ¥46.41 of the total sales that the company made in the fiscal year.
- It helps investors envision the company’s total income in relation to its share capital.
- The effective Book Value per share of 16.79 is the worth of Anker’s tangible possessions (e.g., plants, gear, and cash) net of debts, plus excludes the non-physical assets such as patents or trademarks.
- It is similar to saying that this is the value of the share if the company is shut down, and only its physical assets are dismantled and sold.
- The Operating Profit per share figure of 3.89 reveals the ratio of operating income (the profit generated through normal business operations before tax and interest) per share.
- The Working Capital per share of 12.17 reveals the amount of short-term assets (such as cash and receivables) available for each share of the company after deducting short-term liabilities (like accounts payable). A larger figure, in this case, indicates good financial health for the company in the short term.
- The long-term liabilities per share of 2.94 indicate that Anker has ¥2.94 worth of long-term debt or obligations for each share. Since this figure is minor in comparison to tangible book value (16.79), it powerfully implies a relatively conservative debt structure.
- A Capital Expenditure (CapEx) of 0.81 per share indicates the amount that the company invested in its physical assets, such as new equipment or buildings, during the year.
- On the other hand, the Capital Expenditure TTM (Trailing Twelve Months) of 1.18 indicates that, over the last 12 months, this figure has increased slightly, suggesting that Anker is investing more in its infrastructure and production capacity.
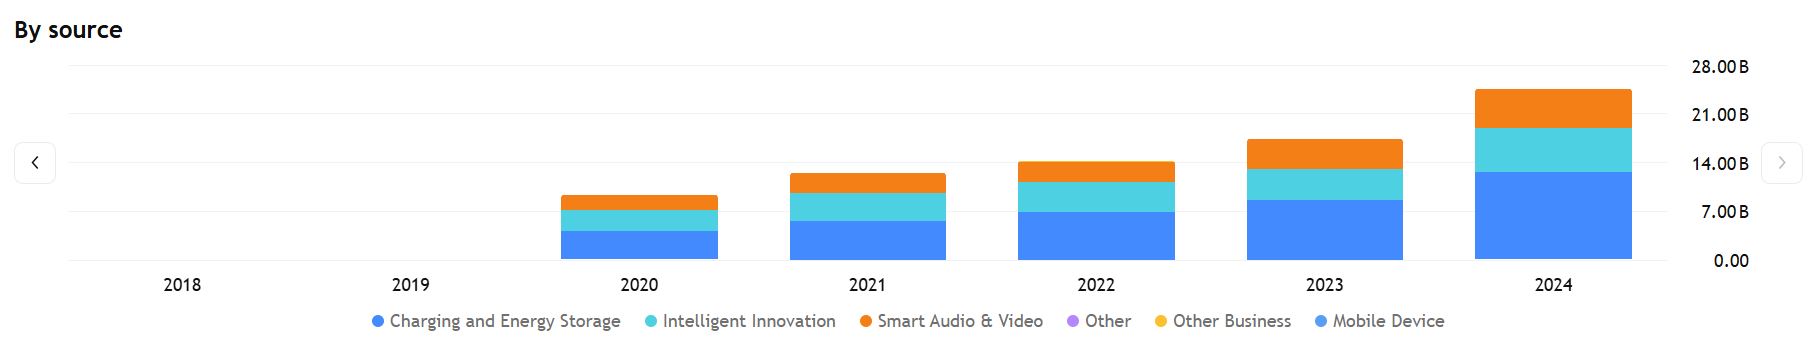
Anker Innovations Revenue By Sources
(Source: tradingview.com)
- The above numbers illustrate the growth of Anker Innovations’ revenue from 2020 to 2024, which is categorised by product types and expressed in Chinese Yuan (CNY).
- They demonstrate that the company’s focus areas have been growing over five years, and the strongest part of its business lies there.
- The Charging and Energy Storage segment is the largest and fastest-growing, and it consists of Anker’s famous chargers, power banks, and portable energy devices.
- Revenue in this segment skyrocketed from ¥4.14 billion in 2020 to ¥12.67 billion in 2024, almost tripling (+206%) in four years. This is a clear indication of Anker’s commanding position and constant growth in the charging technology business, which remains a significant revenue lifeline for the company.
- The second classification, Intelligent Innovation, signifies the latest technology products and intelligent devices—possibly encompassing home automation tools, power stations, and similar advancements.
- The revenue has experienced a rise from ¥3.06 billion in 2020 to ¥6.34 billion in 2024, representing an approximate 107% increase.
- The consistent growth indicates that this category is maturing, and it has become a substantial contributor to Anker’s overall performance.
- Smart Audio & Video, which includes products from Anker’s Soundcore and Nebula brands (such as speakers, headphones, and projectors), also experienced strong growth.
- The sales went up from ¥2.12 billion in 2020 to ¥5.69 billion in 2024, resulting in an approximate 168% increase.
- This indicates that an increasing number of consumers are becoming interested in Anker’s entertainment devices, and the company has successfully diversified its market beyond power accessories.
- The “Other” category comprises the small product lines or residual income from minor operations.
- This segment of the company has been subjected to fluctuations — it reported ¥28.08 million in 2020, with a peak of ¥77.06 million in 2023, then it dropped to ¥14.17 million in 2024. Such inconsistencies imply one-off sales or less stable business activities.
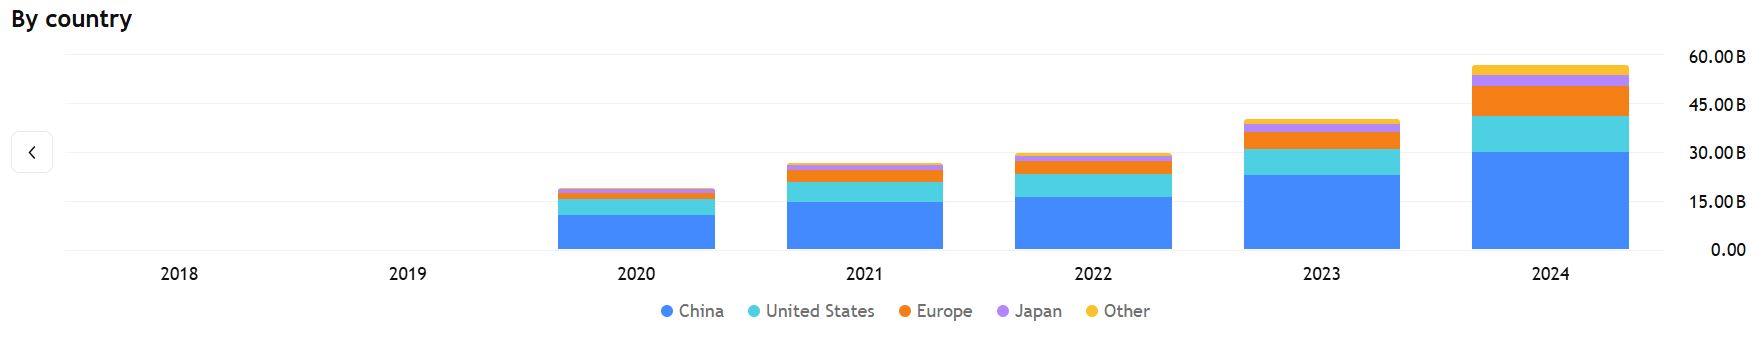
Anker Innovations Revenue By Region
(Source: tradingview.com)
- Anker’s revenue has demonstrated continuous and remarkable growth across all markets from 2020 to 2024.
- The Chinese market recorded the highest increase in revenue from ¥10.44 billion in 2020 to ¥30.12 billion in 2024, thus a clear indication of a strong domestic market.
- The U.S. market also saw a similar increase in revenue, growing from ¥4.94 billion to ¥11.22 billion over the same time period.
- The revenue in Europe increased by more than four times, from ¥1.92 billion in 2020 to ¥9.11 billion in 2024.
- The Company in Japan also had if few of the others who were continuously growing, and the increase was ₹1.37 billion to 3.47 billion.
- The rest of the world experienced the highest percentage increase, alongside the company’s successful global diversification, as revenue jumped from ¥374.51 million in 2020 to ¥3.02 billion in 2024.
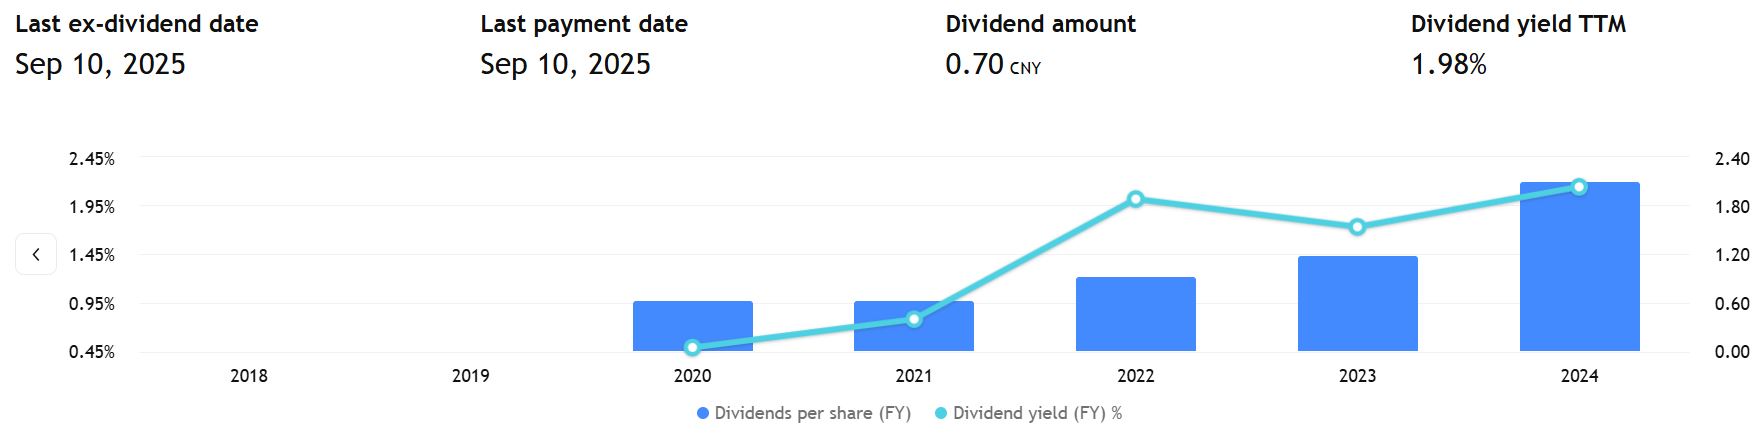
(Source: tradingview.com)
- Anker’s dividend payments over the years mirror the company’s rising profitability and its good intent towards the investors.
- The dividends per share for the company increased from ¥0.62 in 2020 and 2021 to ¥0.92 in 2022, then to ¥1.18 in 2023, and finally reached ¥2.10 in 2024, demonstrating uninterrupted growth in shareholder returns.
- The dividend yield has also increased from 0.49% in 2020 to 2.15% in 2024, albeit with some fluctuations, which means the shareholders got higher returns in relation to the stock price.
- The ratio between the company’s earnings and dividends has changed over the years, starting from 37.99% in 2020, declining slightly in 2021, and then increasing to 52.58% in 2024. This indicates that the firm is allocating a larger portion of its profits to paying dividends.
Valuation Measures
| Current | 3/31/2024 | 12/31/2023 | 9/30/2023 | 6/30/2023 | 3/31/2023 | |
| Market Cap | 38.37B | 31.41B | 36.01B | 38.11B | 35.56B | 26.99B |
| Enterprise Value | 35.63B | 29.32B | 33.92B | 36.27B | 33.38B | 25.09B |
| Trailing P/E | 24 | 20.61 | 23.63 | 27.51 | 28.5 | 23.14 |
| Forward P/E | — | — | — | — | — | — |
| PEG Ratio (5yr expected) | — | — | — | — | PEG Ratio (5yr expected) | — |
| Price/Sales | 2.08 | 1.91 | 2.18 | 2.47 | 2.42 | 1.97 |
| Price/Book | 4.59 | 4.15 | 4.76 | 5.32 | 4.98 | 4.16 |
| Enterprise Value/Revenue | 1.92 | 1.78 | 2.06 | 2.35 | 2.26 | 1.83 |
| Enterprise Value/EBITDA | 18.95 | 17.29 | 20 | 21.68 | 23.85 | 19.38 |
(Source: coolest-gadgets.com)
- The valuation data indicate a general increase in the company’s market capitalization and enterprise value over the years, thus steady growth and the presence of investor confidence.
- The market capitalization jumped from ¥26.99 billion at the beginning of 2023 to ¥38.37 billion now, and the enterprise value was in the same range and reached ¥35.63 billion.
- The P/E ratio for the past year oscillated between 20 and 28, indicating that the market was valuing the company’s earnings performance moderately.
- The price-to-sales and price-to-book ratios remained fairly even, indicating that revenue and asset valuations remained unchanged.
- Enterprise value metrics, including EV/Revenue and EV/EBITDA, pointed to healthy efficiency levels, suggesting that operational profitability had risen during the past year.
Anker Innovations Products
Series 7 – EMBRACE Future Technology
- Anker’s Series 7 is designed for users who seek the most modern technology and optimal performance. The whole series is a symbol of innovation and futuristic design.
- It features Power Delivery technology with GaN II fast charging, which is highly efficient, as well as Thunderbolt 4 for super-fast data transfers and compatibility with future VR technologies.
- The Series 7 is all about tech, and it opens up the world of performance and connectivity as never before.
Series 6 – Discover Unique Experiences
- Series 6 is designed for daring spirits who are eager to explore new, innovative, and creative tech experiences.
- The range is offered with a full range of magnetic charging accessories that are compatible with the latest iPhones, ensuring a seamless connection.
- Moreover, the series takes one step further by introducing new silicone-finished cables that not only look but also feel like premium soft.
- The Series 6 is thus both a huge leap into the digital world and a source of inspiration, catering to both practical and imaginative technological needs.
Series 5 – Enjoy Higher Quality
- Series 5 is a clear testament to Anker’s commitment to quality and durability.
- It includes best-selling Nano Pro chargers and ultra-strong cables that are rated for 30,000 bends.
- The series also features portable power stations with battery life that is 6 times longer than the industry standard.
- Through Series 5, Anker remains the gold standard for dependability and craftsmanship in the tech world.
Anker Innovations Vs JBL
- Anker Innovations reported CNY 17.51 billion in revenue for 2023, while Harman, the parent of JBL, reported USD 10.5 billion in revenue for 2024.
- Anker Innovations generated CNY 9.65 billion in revenue in the first half of 2024, after reporting CNY 7.07 billion in the first half of 2023.
- Anker Innovations had 5,034 employees as of December 31, 2024, while Harman reported 33,400 employees in 2024.
- JBL operates under Harman, which sold over 200 million headphones by 2022.
- For additional scale, Harman’s Digital Transformation Solutions unit recorded USD 314 million in revenue in 2024 and employed 5,600 people across 14 countries.
- Anker Innovations was founded in 2011, while Harman was founded in 1980 and JBL’s brand heritage traces back to 1946 through the Harman portfolio.
- Anker Innovations reported CNY 21.02 billion in revenue for the first nine months of 2024.
Conclusion
Anker Statistics: The story of Anker’s growth from a small maker of power banks to a global tech giant is one of continuous innovation and quality striving. The company’s strong financial performance — an EPS of ¥3.99 and a core charging revenue tripling — keeps Anker at the forefront of smart charging, audio, and energy solutions. Its growing regional spread, increasing dividends, and larger market capitalization are the signs of investor confidence and that the company is making money in a sustainable way.
With its Series 5, 6, and 7 products, Anker is unveiling a blend of cutting-edge technology, an excellent user experience, and long-lastingness, thus positioning itself as a future-aware brand that is driving global change in consumer tech.
Sources
FAQ.
Anker realized enormous profitability in the year 2024 when it had an Earnings Per Share (EPS) of ¥3.99 and sales per share of ¥46.41. Besides this, it also boasted a powerful asset position with a Tangible Book Value per share of ¥16.79 and an Operating Profit per share of ¥3.89, thereby indicating efficient core operations and continued financial health.
The Charging and Energy Storage segment is the powerhouse of Anker’s growth, and that is why the segment’s revenue increased threefold from ¥4.14 billion in 2020 to ¥12.67 billion in 2024. This category comprises chargers, power banks, and portable energy gadgets, which altogether contributed to the company’s global success.
Global Anker Growth was strong between 2020 and 2024. The largest market was China with revenues of ¥30.12 billion, while the U.S. contributed ¥11.22 billion. Europe’s revenue reached new heights at ¥9.11 billion, and other regions surprisingly increased their business by 8 times to reach ¥3.02 billion, all of which indicates Anker’s international presence is getting stronger.
Anker has made it a point to increase its dividends regularly, the amount going up from ¥0.62 per share in 2020 to ¥2.10 in 2024. The dividend yield also went up to 2.15%, and the payout ratio increased to 52.58%, which are indicators of high profitability and a firm and growing commitment to returning capital to shareholders.
Anker’s Series 7 is all about technology that is ready for the future; it comes with a GaN II charger and Thunderbolt 4. Series 6 is a customer experience and user-friendliness oriented with magnetic chargers and soft silicone cables. Series 5 strengthens the quality and longevity features of the company, and thus it has robust Nano Pro chargers and power stations that last long.

I hold an MBA in Finance and Marketing, bringing a unique blend of business acumen and creative communication skills. With experience as a content in crafting statistical and research-backed content across multiple domains, including education, technology, product reviews, and company website analytics, I specialize in producing engaging, informative, and SEO-optimized content tailored to diverse audiences. My work bridges technical accuracy with compelling storytelling, helping brands educate, inform, and connect with their target markets.