Expedia Statistics By Revenue, Users, Downloads and Facts (2025)
Updated · Feb 07, 2026


Table of Contents
- Introduction
- Editor’s Choice
- General Expedia Facts
- History of Expedia
- Fun Facts About Expedia
- Most Popular Travel And Tourism Websites
- Expedia Users
- Expedia Users Age Demographics
- Expedia Downloads
- Expedia Revenue
- Expedia Booking Holdings Quarterly Overview
- Expedia Operating Metrics
- Expedia Gross Bookings By Business Model
- Gross Bookings By Product
- Expedia Revenue By Product And Region
- Expedia Bookings
- Expedia Share of US Travel Spending
- Expedia Share of Sales By Brand
- Expedia Average Revenue Per Booking
- Conclusion
Introduction
Expedia Statistics: Visualise organising a vacation, getting your accommodation, flights, and maybe a rental car — now picture that by a million people doing it each minute globally. That’s exactly what the business is about, Expedia Group, the giant travel platform behind websites like Expedia, Hotels.com, and Vrbo.
Even in 2025, with changes in travel patterns and increasing prices, Expedia continues to develop—more and more bookings are being made, revenue is growing, margins are larger, and the company is striving to be the first on the market. The present article will take us to the future world of 2025 and the successes of Expedia.
Editor’s Choice
- In March 2024, Booking.com was the leader in the global travel and tourism market, accounting for more than 6.6% of the desktop traffic, and Tripadvisor was next with 1.71%.
- Booking Holdings’ gross bookings increased from USD 30.16 billion in Q1 2024 to USD 30.73 billion in Q3 2025, thus an increase of 12% year-over-year.
- The number of booked room nights for Expedia increased from 94.5 million in Q1 2023 to 108.2 million in Q3 2025, resulting in an annual increase of 11%.
- The average daily rate for bookings was consistent, with a slight increase from USD 222.7 in Q1 2023 to USD 209.8 in Q3 2025.
- The number of air tickets booked increased from 14 million to 14.4 million between 2023 and 2025, representing a 5% rise.
- The total gross bookings have risen from USD 29.4 billion in Q1 2023 to USD 30.7 billion in Q3 2025, resulting in a year-on-year growth rate of 12%.
- Air travel revenue was down by 4% during the same period, from USD 113 million to USD 101 million.
- The advertising revenue was also very good, with the company’s internal ads up by 16% and Trivago’s ad revenue growing by 34%.
- Sales in the U.S. increased by 4% to USD 2.54 billion in Q3 2025; meanwhile, revenue from outside the U.S. rose by 15% to USD 1.88 billion.
- Expedia was responsible for 9.7% of total U.S. travel expenses in early 2024, representing a slight increase from 9.5% in 2023.
- In 2024, VRBO was responsible for 41.5% of Expedia’s sales, while the Expedia brand accounted for 36%.
- In the most recent quarter, the average cost per booking at Expedia was USD 40.78, representing a 2.2% decrease compared to the same quarter last year.
- According to the first two years of the pandemic, ARPB has declined by approximately 1.7% per year; however, the total number of bookings remains on the rise.
- The number of downloads for the Expedia app in 2024 reached an impressive figure of 22.5 million, marking an increase from 21.5 million in 2023 and a tripling of the 2020 pandemic low of 7.2 million.
General Expedia Facts
- Over the past thirty years, Expedia Group has evolved from a single website, Expedia.com, to a major player in the online travel industry, acquiring well-known brands such as Vrbo, Hotels.com, and Trivago.
- The company is currently the second-largest OTA in the world, trailed only by Booking Holdings.
- The lodging segment is the most profitable among Expedia Group’s various business units, encompassing both hotel accommodations and short-term rentals.
- In 2024, the total amount generated from this segment was nearly 11 billion USD, representing about 80% of the company’s total global revenue.
- Three main revenue models are associated with the company’s operations—the merchant model, where customers pay directly to Expedia.
- The agency model, where Expedia receives commissions from partners for bookings, and the advertising model, where the income is generated from digital ad placements and promotions.
- Among them, the merchant strategy is the most important for the company’s profitability.
- The United States is still the largest and most significant market for Expedia Group, accounting for over 60% of global revenue in 2024.
- Expedia’s strong brand recognition in the U.S. is reflected in surveys where it ranks higher than Airbnb and Booking.com in terms of awareness.
- However, the company must contend with a tough competitive environment, where it faces rivals such as Booking Holdings, Airbnb, and Trip.com.
History of Expedia
- 1996: Expedia was launched as Microsoft Expedia Travel Services, debuting on the web on October 22 as one of the first online travel agencies.
- 1998: The platform reached its one-millionth ticket milestone and reported weekly travel sales above $5 million, signaling early scale in online travel.
- 1999: Microsoft filed for and completed the Expedia initial public offering. Shares priced at $14 and began trading on Nasdaq under the symbol EXPE.
- 2001: USA Networks, later IAC, agreed to acquire a controlling stake of about 75 percent in Expedia, valuing the deal at roughly $1.4 billion in stock.
- 2003: IAC acquired the remaining shares of Expedia, taking full ownership of the company.
- 2005: IAC completed the spin-off of Expedia as a separately traded company on Nasdaq, with Expedia starting to trade under the ticker EXPE.
- 2011: Expedia completed the spin-off of TripAdvisor as an independent public company after shareholder approval.
- 2012: Expedia entered a definitive agreement to acquire a 61.6 percent stake in Trivago for about €477 million (approximately $632 million).
- 2014: Expedia agreed to acquire Australia-based Wotif Group. The transaction closed in November for A$703 million.
- 2015: Expedia acquired Travelocity for $280 million and completed the acquisition of Orbitz Worldwide for about $1.6 billion in cash. It also agreed to acquire HomeAway for $3.9 billion.
- 2018: Expedia, Inc. changed its corporate name to Expedia Group, Inc., aligning the portfolio under a unified corporate identity.
- 2019: Leadership shifted when CEO Mark Okerstrom resigned. Chairman Barry Diller and Vice Chairman Peter Kern oversaw day-to-day operations while the board evaluated long-term leadership.
- 2020: Peter Kern was appointed Chief Executive Officer as the company strengthened liquidity during the pandemic period.
- 2019–2020: HomeAway’s global portfolio was consolidated under the Vrbo brand, with Vrbo named the primary alternative accommodations brand and HomeAway U.S. retired the following year.
- 2023: Expedia Group launched One Key, a unified loyalty program across Expedia, Hotels.com, and Vrbo, enabling earn and burn of OneKeyCash across brands in the United States.
- 2024: Ariane Gorin was appointed Chief Executive Officer effective May 13, succeeding Peter Kern, who became Vice Chairman.
Fun Facts About Expedia
- 1996 origin: Expedia began as an internal Microsoft project in October 1996 and was spun off in 1999 as a public company.
- IAC chapter: A controlling stake was acquired by IAC in 2001, the remainder in 2003, and Expedia was spun out again in 2005. TripAdvisor was later separated in 2011.
- Leadership milestone: Ariane Gorin was appointed Chief Executive Officer effective May 13, 2024.
- Record bookings: Annual bookings reached a record $110 billion in 2024, surpassing the pre-pandemic peak.
- Growth signals: For 2024, Expedia reported full-year gross bookings and revenue growth of 7% versus 2023, with lodging bookings up 12% year over year in Q4.
- Unified loyalty: The One Key program launched in July 2023, letting members earn and spend across Expedia, Hotels.com, and Vrbo, and making Vrbo the first major vacation-rental platform with a loyalty program.
- Brand portfolio: Expedia Group operates well-known brands including Expedia, Hotels.com, Vrbo, Orbitz, Travelocity, Hotwire, Wotif, Ebookers, CheapTickets, CarRentals, Expedia Cruises, and holds a significant stake in Trivago.
- Trivago stake: A 61.6% majority interest in Trivago was acquired for about €477 million in 2012 and completed in 2013.
- Vacation rentals bet: HomeAway, the owner of VRBO, was acquired for about $3.9 billion in 2015; the consumer brand was later consolidated under Vrbo.
- Headquarters move: The company relocated its headquarters from Bellevue to a new waterfront campus in Seattle’s Interbay in 2019.
- Founder’s legacy: Expedia’s founding executive Rich Barton later co-founded Zillow and Glassdoor, extending a strategy of giving consumers more data and choice.
- Workforce scale: Public profiles and industry trackers place Expedia Group’s global headcount at around 16,000+ employees in recent years.
Most Popular Travel And Tourism Websites
(Reference: statista.com)
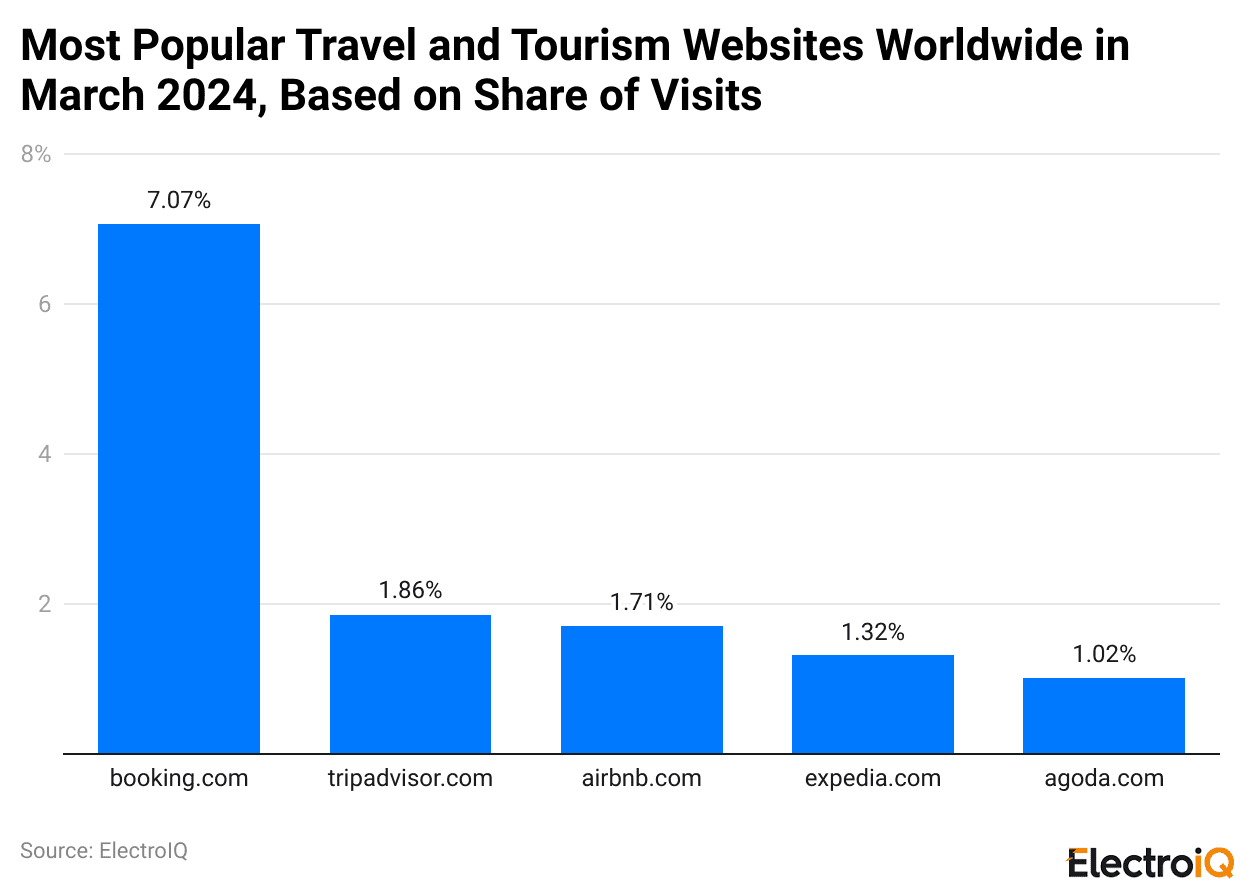
- In March 2024, Booking.com was leading the way in the global travel and tourism market online, attracting more than 6.6% of all desktop traffic in this category.
- In other words, it was the most popular website for making travel and accommodation reservations all around the globe.
- Tripadvisor.com ranked second with a global visit share of 1.71%, indicating that it remained a favoured site for those seeking reviews and planning assistance. However, Booking.com significantly outpaced it in terms of online user engagement.
Expedia Users
- Expedia reported 46 million active users in the most recent year, representing a slight decline compared to the previous period.
- The platform served 45 million users at the beginning of the period shown, and this number increased to 49 million, then to 53 million, and finally to 60 million, reflecting steady growth in adoption.
- User activity dropped sharply to 22 million during the travel slowdown, then improved to 38 million as travel activity started to recover.
- Engagement strengthened further with 48 million users, rising again to 50 million, before easing back to 46 million, indicating a stable but slightly fluctuating user base over time.
Expedia Users 2016 to 2024 (mm)
| Year | Users (mm) |
|---|---|
| 2016 | 45 |
| 2017 | 49 |
| 2018 | 53 |
| 2019 | 60 |
| 2020 | 22 |
| 2021 | 38 |
| 2022 | 48 |
| 2023 | 50 |
| 2024 | 46 |
Expedia Users Age Demographics
- About 15% of Expedia’s users are between 18 and 24 years old, showing that a smaller share of its audience comes from younger travelers who are just beginning to book trips independently.
- Around 25% of users fall in the 25 to 34 age range, making this the single largest group and reflecting strong usage among adults who travel frequently for both work and leisure.
- Nearly 20% of users are in the 35 to 44 bracket, indicating steady engagement from mid-career travelers and families who rely on online platforms for trip planning.
- Close to 17% of the audience is between 45 and 54 years old, showing that mature travelers continue to use the platform for convenience and access to deals.
- Roughly 23% of users are aged 55 and above, demonstrating sustained adoption among older travelers who value streamlined booking tools and customer support.
Expedia Age Demographics 2024
| Age bracket | Percentage of users (%) |
|---|---|
| 18-24 | 15% |
| 25-34 | 25% |
| 35-44 | 20% |
| 45-54 | 17% |
| 55+ | 23% |
Expedia Downloads
- Expedia reached 22.5 million downloads in 2024, showing steady growth in user adoption compared with earlier years. This rise reflects stronger interest in mobile travel planning and greater reliance on app-based booking.
- The platform recorded 8 million downloads in 2016, increasing to 9.5 million in the following year as more users moved toward digital travel services.
- Downloads continued to climb to 12.5 million in the next period, followed by 14.2 million, indicating consistent expansion before a temporary decline that brought downloads down to 7.2 million during a challenging phase for global travel.
- Recovery started soon after, with downloads rising to 9.4 million, and momentum strengthened further with 18 million as travel activity resumed and mobile usage accelerated.
- User interest continued to expand, pushing downloads to 21.5 million, and subsequently to 22.5 million, marking the highest level achieved in the dataset and confirming positive long-term growth for the Expedia app.
Expedia Downloads 2016 to 2024 (mm)
| Year | Downloads (mm) |
|---|---|
| 2016 | 8 |
| 2017 | 9.5 |
| 2018 | 12.5 |
| 2019 | 14.2 |
| 2020 | 7.2 |
| 2021 | 9.4 |
| 2022 | 18 |
| 2023 | 21.5 |
| 2024 | 22.5 |
Expedia Revenue
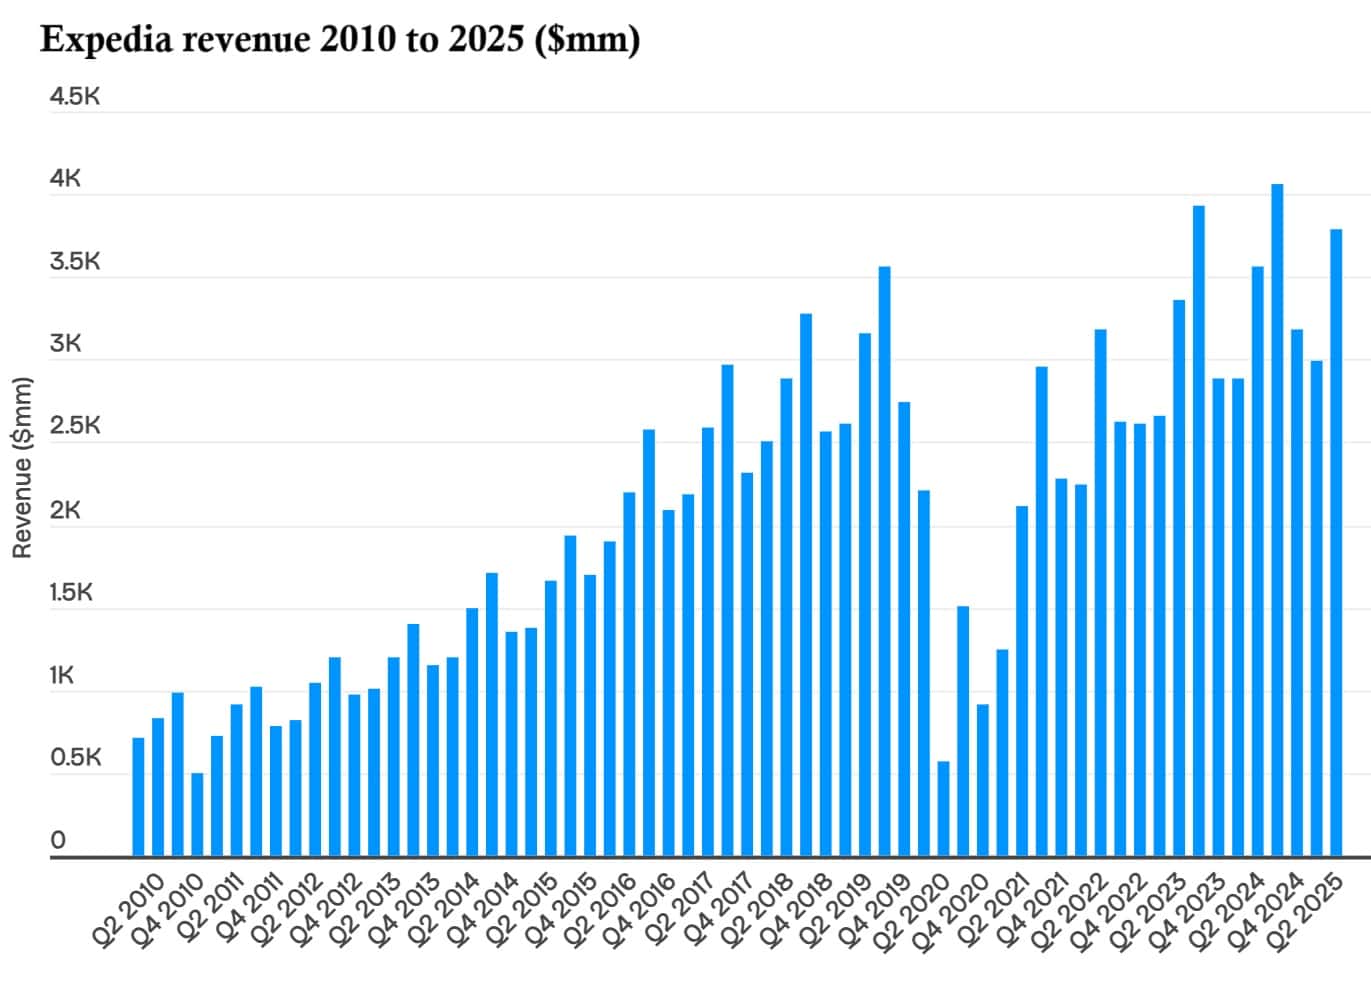
- Expedia reported USD 13.6 billion in annual revenue for 2024, representing a 6.7% increase from the previous year. This steady increase showed that the company continued to strengthen its position in the travel services market.
- Revenue increased from USD 2.74 billion in the previous period to USD 3.03 billion, demonstrating consistent growth driven by higher booking activity.
- The company reached USD 3.44 billion, followed by USD 4.03 billion, marking a clear improvement supported by strong demand for online travel services.
- Earnings rose further to USD 4.77 billion and then USD 5.76 billion, indicating that Expedia benefited from broadening its offerings and customer base.
- Revenue increased to USD 6.67 billion and then to USD 8.77 billion, reflecting significant growth in global travel engagement.
- The company generated USD 10.06 billion, followed by USD 11.22 billion, demonstrating strong performance as digital travel platforms gained widespread adoption.
- Revenue reached USD 12.06 billion before dropping sharply to USD 5.19 billion, a decline influenced by travel disruptions during that period.
- Recovery began with USD 8.59 billion, followed by USD 11.66 billion, demonstrating strong rebound momentum.
- Revenue improved again to USD 12.83 billion, and later reached USD 13.69 billion, marking the highest level in the data and confirming Expedia’s return to sustained growth.
Expedia Revenue 2010 to 2024 ($bn)
| Year | Revenue ($bn) |
|---|---|
| 2009 | 2.74 |
| 2010 | 3.03 |
| 2011 | 3.44 |
| 2012 | 4.03 |
| 2013 | 4.77 |
| 2014 | 5.76 |
| 2015 | 6.67 |
| 2016 | 8.77 |
| 2017 | 10.06 |
| 2018 | 11.22 |
| 2019 | 12.06 |
| 2020 | 5.19 |
| 2021 | 8.59 |
| 2022 | 11.66 |
| 2023 | 12.83 |
| 2024 | 13.69 |
Expedia Booking Holdings Quarterly Overview
(Source: expediagroup.com)
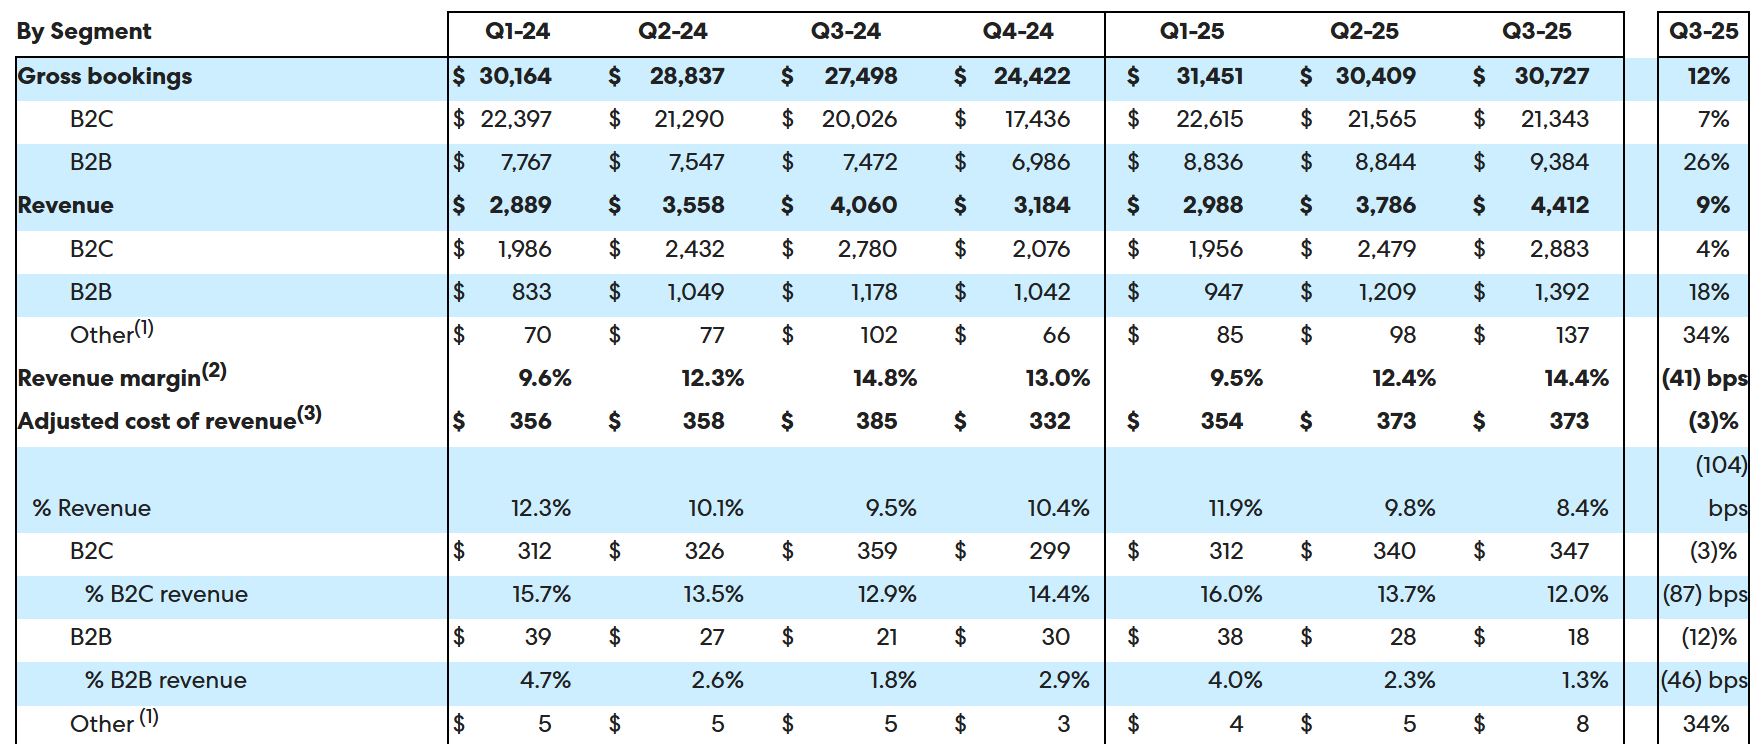
- The figures depict the quarterly financial results of Booking Holdings, presenting the patterns of gross bookings, revenues, and costs for both the B2C and B2B segments.
- Gross bookings remained consistent throughout the period, starting at USD 30.16 billion in Q1 2024 and ending at USD 30.73 billion in Q3 2025, representing a 2% year-over-year increase.
- Among the segments, B2C, which includes direct consumer transactions, accounted for the largest contribution, reaching USD 21.34 billion in Q3 2025, up 7%.
- B2B, on the other hand, which deals with business partnerships, saw faster development, swelling 26% to USD 9.38 billion in the same period.
- Total revenue was also on the rise, going up from USD 2.89 billion in Q1 2024 to USD 4.41 billion in Q3 2025, representing a 9% year-over-year increase.
- The B2C part of revenue increased rather slowly by 4%, whereas B2B revenue expanded by 18%, indicating very strong momentum in the business unit.
- Also, revenue from “Other” activities grew significantly by 34%, reflecting diversification efforts.
- The revenue margin improved from 9.6% in Q1 2024 to 14.4% in Q3 2025, though slightly lower year-over-year by 41 basis points, indicating stable efficiency.
- The adjusted cost of revenue remained under control, declining by 3% to USD 373 million in Q3 2025.
- This amount was 8.4% of total revenue, a drop of 104 basis points from the previous quarter, indicating the company had grown more efficient in its operations.
- Cost-wise, B2C accounted for 12% of the segment’s revenue, with a slight decrease of 3%, while the B2B side also saw a 12% drop, resulting in operational leverage in the business.
Expedia Operating Metrics
(Source: expediagroup.com)
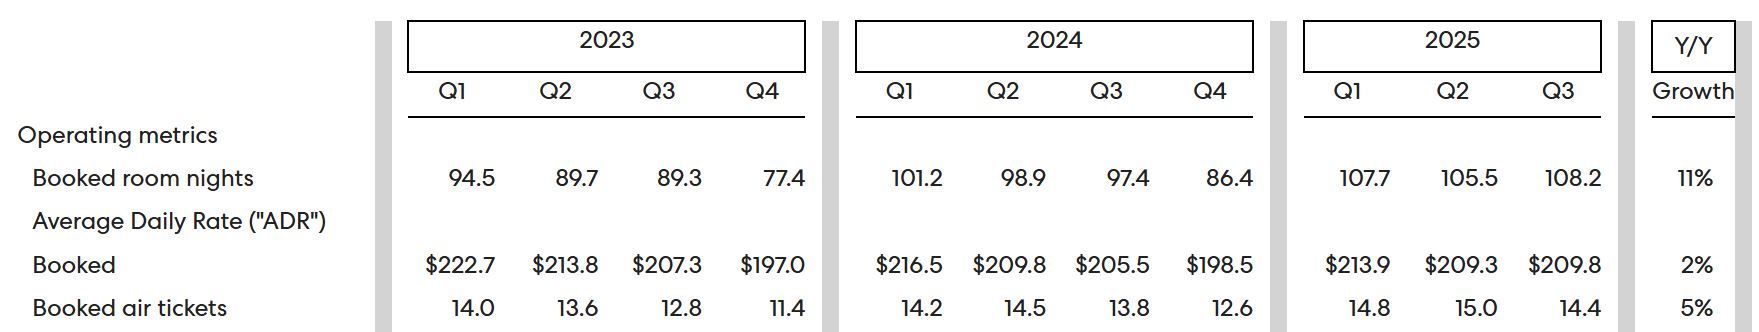
- The numbers highlight Expedia’s operating performance during the years 2023-2025, showcasing a steady rise in hotel night bookings, average daily rates, and the number of booked air tickets, which were the company’s key travel metrics.
- Expedia’s total number of booked hotel nights grew steadily, starting at 94.5 million in Q1 2023 and ending at 108.2 million in Q3 2025, representing an overall year-on-year growth of 11%.
- The average daily rate (ADR) booked—that is, the average amount a customer pays for each room—remained relatively unchanged, increasing from USD 222.7 in Q1 2023 to around USD 209.8 in Q3 2025, with a slight year-on-year increase of only 2%.
- This situation implies that, notwithstanding the increase in booking volumes, prices remained quite stable; thus, industry inflation might have been moderate, or competitors probably engaged in price wars.
- On the other hand, there was also a growth in booked air tickets from 14 million in Q1 2023 to 14.4 million in Q3 2025, which translates to a 5% annual increase.
- The increase indicates the continued attraction of consumers to air travel, which is in line with the increase in hotel bookings.
- In sum, this data proves that Expedia is on the path of continued post-pandemic growth, which is predominantly driven by the increased number of travellers in terms of both accommodation and air flights.
Expedia Gross Bookings By Business Model
(Source: expediagroup.com)
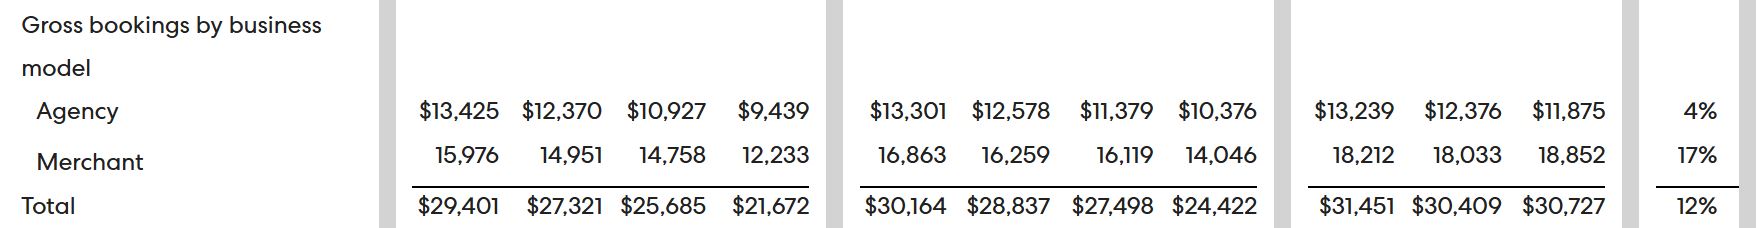
- The presented data encompasses the gross bookings performance of Expedia from 2023 to 2025, categorized into two main types of models—merchant and agency—and emphasizing the overall growth rate on a year-over-year basis.
- The overall gross bookings of Expedia increased gradually by USD 1.3 billion over the three-year period starting in 2023, reaching USD 30.7 billion in Q3 2025 and representing an annual increase of 12%.
- Such growth is indicative of a gradual yet certain travel demand recovery worldwide, as well as a rising number of Expedia users.
- The agency model, in which Expedia earns money by charging travel partners directly for the services rendered to their customers, underwent slight changes during the same period.
- However, with no major ups and downs, bookings in this case increased from USD 13.4 billion in Q1 2023 to USD 11.9 billion in Q3 2025, revealing a 4% yearly growth rate.
- This indicates that the bookings managed by the third party were not at all affected by the market fluctuations and were stable instead.
- Notably, the merchant model, where Expedia sells travel products and retains the full transaction value, was experiencing stronger business operations growth.
- The bookings under this model amounted to rose from USD 16.0 billion in Q1 2023 to USD 18.9 billion in Q3 2025, which, in turn, was reflected in a 17% annual growth rate.
- This was a result of Expedia being able to effectively market its direct sales operations and extract more revenue per transaction.
- To sum up, the data indicates very strong company-wide movement, with the merchant sector nearly single-handedly pushing the growth of the entire company, which is being further strengthened by the fact that travelling and lodging services are still in high demand across the entire worldwide network of outlets.
Gross Bookings By Product
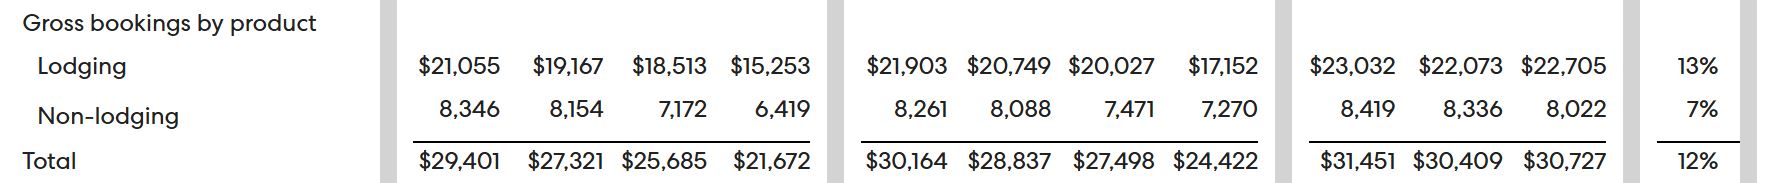
(Source: expediagroup.com)
- The visualization of the data reveals a steady increase in Expedia’s gross bookings performance, categorized by lodging and non-lodging, from the years 2023 to 2025.
- Air lodging, comprising hotel and other accommodation services, booked USD 21.1 billion in Q1 2023 and steadily grew to USD 22.7 billion in Q3 2025, showing a year-over-year rise of 13%.
- The company enjoys a strong position in a market that is constantly expanding, driven by people worldwide seeking to stay in hotels, as well as the availability of numerous alternatives in the booking process.
- Non-lodging bookings, which include flights, car rentals, and other travel services, also increased, albeit at a slower pace than lodging bookings—the rise was from USD 8.3 billion in Q1 2023 to USD 8.0 billion in Q3 2025, representing a 7% annual growth.
- As a result, Expedia’s gross bookings climbed up by USD 29.4 billion in Q1 2023 to USD 30.7 billion in Q3 2025, which is equivalent to a percentage increase of 12% year over year.
- The data indicate that both divisions contributed to the growth, but the demand for lodging was the primary reason for Expedia’s expanding revenue base.
Expedia Revenue By Product And Region
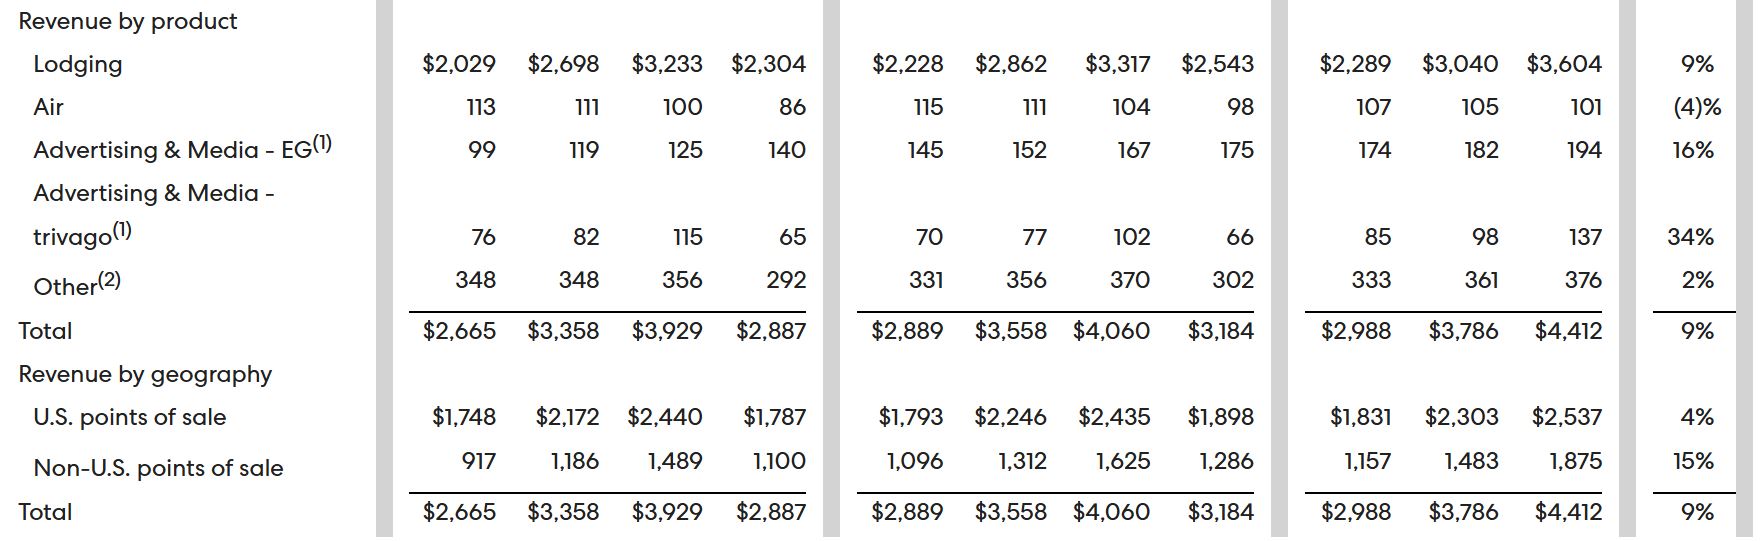
(Source: expediagroup.com)
- The data points to the different channels and regions of Expedia’s revenues during the years 2023-2025 as the main factor contributing to the steady overall growth, with some differences among categories.
- Lodging remained the major revenue source, with revenues rising from USD 2.03 billion in Q1 2023 to USD 3.6 billion in Q3 2025, representing a 9% year-over-year growth.
- The gradual increase signifies the continued strong demand for hotel and accommodation bookings through the site.
- On the other hand, air revenue dipped slightly, going from USD 113 million in Q1 2023 to USD 101 million in Q3 2025, a 4% decrease, possibly because of lower ticket margins or intense competition in the flight market.
- The internal advertising section of the Expedia Group increased from USD 99 million in Q1 2023 to USD 194 million in Q3 2025, representing a 16% rise. Meanwhile, Trivago’s revenue in the same category jumped from USD 76 million to USD 137 million, accounting for a remarkable 34% growth.
- The other sources of revenue were not significantly affected and stayed in a range of around USD 330–USD 370 million per quarter, adding very little to the overall revenues.
- Looking at the revenue by regions, the U.S. revenue had a slight increase from USD 1.75 billion in Q1 2023 to USD 2.54 billion in Q3 2025, a 4% year-on-year growth, while the non-U.S. revenue boomed from USD 917 million to USD 1.88 billion, which means a 15% annual growth rate that is stronger.
Expedia Bookings
- Expedia’s total bookings reached USD 110.9 billion in the most recent year, marking the highest level ever recorded by the company and moving beyond its earlier peak.
- The company reported USD 78.4 billion in bookings at the beginning of the period, which grew steadily to USD 88.4 billion and then to USD 99.7 billion, showing consistent expansion in travel demand.
- Bookings continued to rise to USD 107.8 billion, reflecting strong consumer activity before a major downturn that brought the figure down to USD 36.7 billion, driven by weakened global travel conditions.
- A recovery started afterward, lifting bookings to USD 72.4 billion, followed by another increase to USD 95 billion, supported by improving travel confidence.
- The upward trend continued with bookings rising to USD 104 billion, eventually reaching USD 110.9 billion, confirming Expedia’s return to strong growth and improved market activity.
Expedia Bookings 2016 to 2024 ($bn)
| Year | Bookings ($bn) |
|---|---|
| 2016 | 78.4 |
| 2017 | 88.4 |
| 2018 | 99.7 |
| 2019 | 107.8 |
| 2020 | 36.7 |
| 2021 | 72.4 |
| 2022 | 95 |
| 2023 | 104 |
| 2024 | 110.9 |
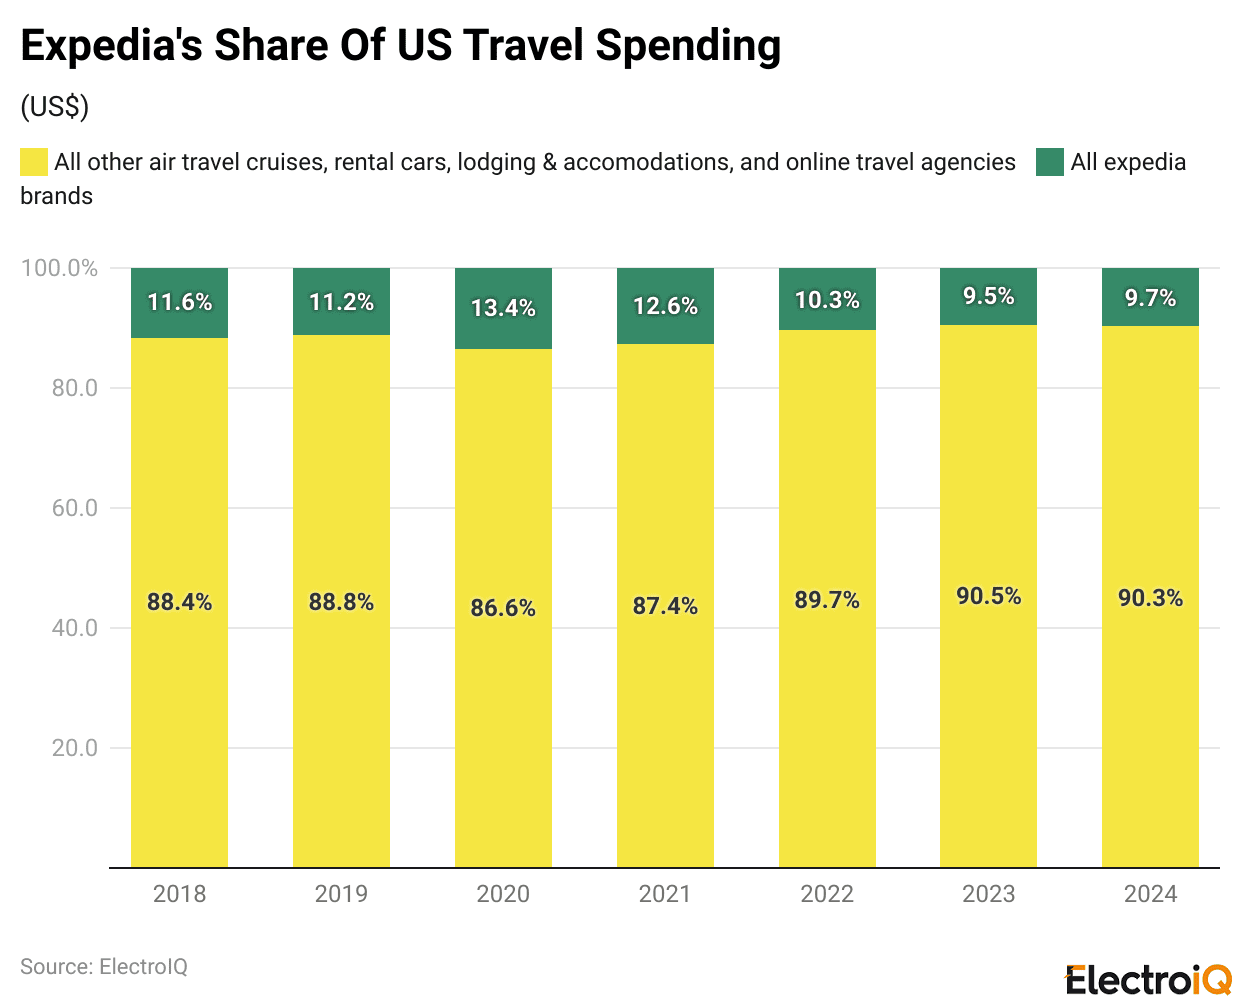
(Reference: earnestanalytics.com)
- According to Earnest credit card data, between January and July 2024, Expedia accounted for 9.7% of total U.S. travel spending in the main categories like airlines, cruises, hotels, and online travel agencies, which is a little better than the 9.5% market share in 2023, indicating that the company might be regaining its momentum after three years of losing market share.
- The slight increase indicates the potential for Expedia to recover in the travel sector, which is highly competitive and likely contributes to its strong multi-brand strategy and extensive service line-up.
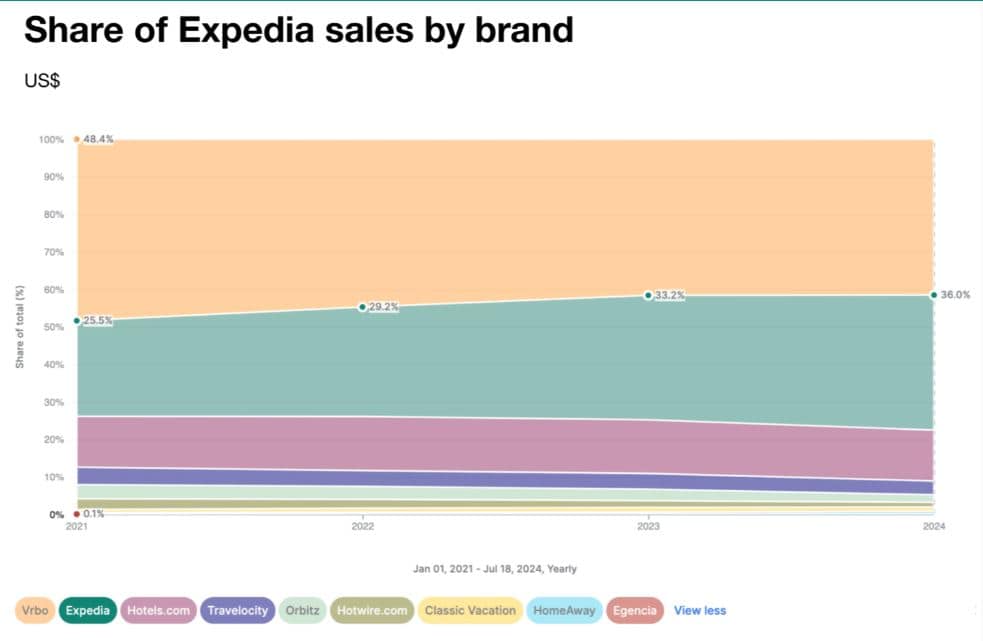
(Source: earnestanalytics.com)
- VRBO, a division of Expedia that specialises in vacation rentals, was responsible for the largest share of the group’s total sales, accounting for 41.5% of the sales in 2024.
- The Expedia brand alone represented 36.0% of total sales.
- Nonetheless, despite VRBO’s leading share, the home rental sector has been slowly losing its appeal and demand as customers shift to traditional lodging and hotel bookings.
- In fact, this trend has been seen as one of the reasons for the declining share of VRBO in the overall portfolio of Expedia.
Expedia Average Revenue Per Booking
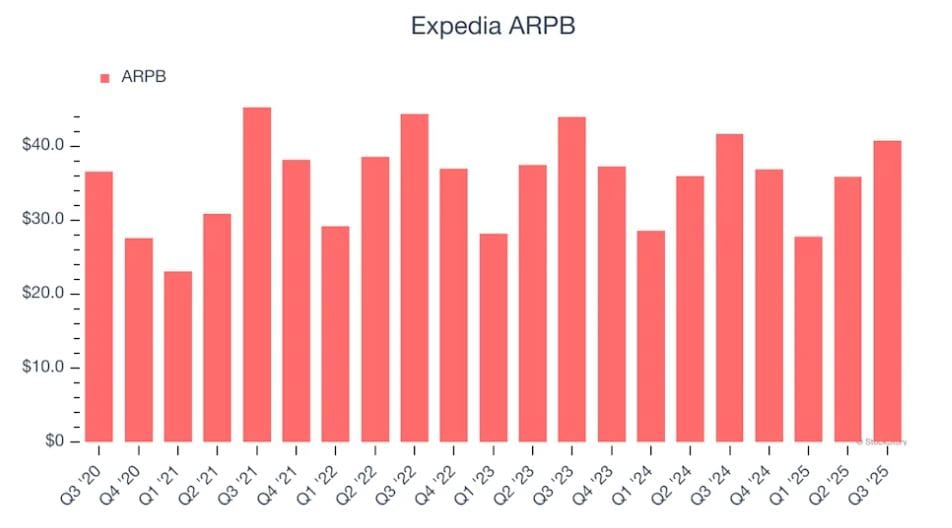
(Source: yahoo.com)
- The average revenue per booking (ARPB) represents the income generated by each booking for Expedia, including its commissions.
- This has been a negative trend, as the figure has dropped by an average of 1.7% over the last two years.
- However, on the positive side, the demand for room nights has been increasing, which is a promising indication of the potential for long-term growth.
- For the last quarter, ARPB at USD 40.78 represented a 2.2% reduction compared to the same period last year.
- In fact, this decrease was greater than the reduction in total room nights, implying that the company is earning slightly less on each booking, yet simultaneously increasing the volume of bookings.
- The million-dollar question is whether Expedia can continue its growth in bookings if it resorts to increasing prices or commissions to offset the losses.
Conclusion
Expedia Statistics: Based on the company’s performance in 2025, it is gradually regaining its lost strength after a period of market instability. The company’s growth in bookings, particularly in lodging, is a strong indicator of the recovery in global travel demand. The merchant model is the primary factor driving profits, alongside the growth of the advertising market and international markets.
Although the average revenue per booking has decreased slightly, the volume of transactions and customer engagement are increasing. VRBO is capturing a significant portion of the market, and app downloads are increasing, which is why Expedia is demonstrating its strength in a competitive market. Ongoing innovation and global diversification will be key determinants of the company’s future growth path.
FAQ.
Lodging is the major source of revenue for Expedia Group. It includes both hotels and short-term rentals, and in 2024, this segment brought in almost US$11 billion—around 80% of the company’s total global revenue—thus, it is the most lucrative segment for the group.
Expedia Group’s largest market by far is the United States, which constituted more than 60% of total revenue in 2024. However, international markets are growing at a faster pace; by 2025, revenue from non-U.S. markets will have increased by 15% on a yearly basis.
Expedia’s share of U.S. travel spending increased over the period from January to the middle of July 2024, reaching 9.7%, which is a slight increase from last year’s 9.5%. This minor increase is an indication that the company might be slowly recovering from the downfall of the previous years.
There has been a tremendous increase in the downloads of the Expedia app post-pandemic, with the number going up from 7.2 million in 2020 to reaching 22.5 million in 2024. This is a strong recovery and a sign of increasing customer involvement with the digital travel booking process.
Over the last two years, Expedia’s ARPB has been going down at an annual rate of approximately 1.7%, dropping to US$40.78 for the latest quarter. This represents a year-over-year decrease of 2.2%. Nevertheless, overall bookings are still increasing, which indicates a very strong long-term business potential.

I hold an MBA in Finance and Marketing, bringing a unique blend of business acumen and creative communication skills. With experience as a content in crafting statistical and research-backed content across multiple domains, including education, technology, product reviews, and company website analytics, I specialize in producing engaging, informative, and SEO-optimized content tailored to diverse audiences. My work bridges technical accuracy with compelling storytelling, helping brands educate, inform, and connect with their target markets.