Rainfall Statistics By Damage, Years, Forecast and Facts
Updated · May 15, 2026

Table of Contents
- Introduction
- Editor’s Choice
- Types Of Rainfall
- General Rainfall Statistics
- Projected Frequency Of Decadal Heavy Precipitation By Temperature Increase
- Change In Economic Damage Due To Floods In Commercial Buildings In The USA
- Change In Economic Damage Due To Floods In Commercial Buildings In The USA By 2052 By State
- Highest Rainfall Anomalies In The USA By States
- Annual Precipitation Change By 2050
- Wet Season Precipitation Change By 2050
- Rainfall Statistics By Country
- Annual Precipitation In The USA In 2023 By State
- Countries With The Highest Flood Risk In 2023
- Growth In Global Population Exposure To Flooding By Scenario
- Economic Losses From Natural Disasters By Type
- The Most Expensive Flood Disasters Worldwide Between 1990 And 2023 By Economic Losses
- Top 10 Wettest Places On Earth
- Rainfall And Flood Problems
- Regional Impacts Of Rainfall And Floods
- Future Weather Prediction
- Conclusion
Introduction
Rainfall Statistics: Floods and extreme rainfall are the leading causes of natural disasters around the world. In recent years, due to global warming, such events have significantly increased, leading to thousands of innocent lives and economic losses. Rainfall is important in terms of economic, social, scientific, and cultural development across the world.
However, in recent years, rainfalls have become irregular; they either fall in slight or extreme numbers. Although our technology helps us to understand the patterns, impacts, and mechanisms, the safety of people remains the biggest concern. Let’s take a look at Rainfall Statistics to understand worldwide insights.
Editor’s Choice
- In the United Kingdom in 2023, the average annual rainfall was 1,381.4 millimeters, which is almost similar to 2022.
- Rainfall Statistics predict that by 2050, rain will become more frequent but shorter in duration in significant parts of the USA.
- By the predicted year, the rain will be longer and could last more than one day in states like Tennessee, Atlanta, Charlotte, and some parts of the South Atlantic Gulf.
- Rainfall Statistics have predicted that heavy rainfall is 2.7x more likely to occur once every ten years at an increased global warming temperature of 4.0°C.
- Louisiana is likely to experience the highest economic cost increase due to floods by 2052, resulting in 192.4%.
- Due to global warming in the coming years, extreme weather cases, including flooding, are forecast to become more frequent and intense.
- Between 2022 and 2052, the direct impact will increase from 26.8% to 34%, while the indirect effect is predicted to account for 29.1% from 23%.
- In the USA, Connecticut, New Hampshire, and Massachusetts recorded the wettest precipitation anomalies, with 14.31, 13.05, and 13.04 inches, respectively.
- Most parts of the world are likely to experience a 2% to 15% increase in the wet season; however, eastern Europe, southern Asia, and Northern Africa are anticipated to record the highest rate of precipitation, between 15% and 60%.
- According to Precipitation Statistics 2023, Connecticut recorded the highest, contributing 61.18 inches.
Types Of Rainfall
- Cyclonic Rainfall – Cyclonic rainfall is most likely to form when humidity, temperature, and density are met. The layers that separate these masses are called fronts. The rainfall takes place on the fronts of the cyclone and may last from a few hours to a few days.
- Convectional Rainfall – When air is heated and becomes light, it rises to the level of convection currents. Clouds are formed due to the expansion of air and a reduction in temperature. In this type, thunder and lightning take place but may not last long.
- Orographic Rainfall – Once the saturated air mass is formed across mountain areas, the temperature is forced to rise. The air then expands, causing the temperature to turn cold. Orographic Rainfall falls more on windward slopes.
General Rainfall Statistics
- Rainfall Statistics predict that by 2050, rain will become more frequent but shorter in duration in significant parts of the USA. In addition, in states like Tennessee, Atlanta, Charlotte, and some parts of the South Atlantic Gulf, rain will be longer and could last more than one day.
- In the United Kingdom in 2023, the average annual rainfall was 1,381.4 millimeters, which is almost similar to 2022.
- >Every year, Brazil records the most rainfall by volume, with 13,299 cubic kilometers of water.
- The yearly average rainfall in the Amazon rainforest is projected to be 2,300 mm.
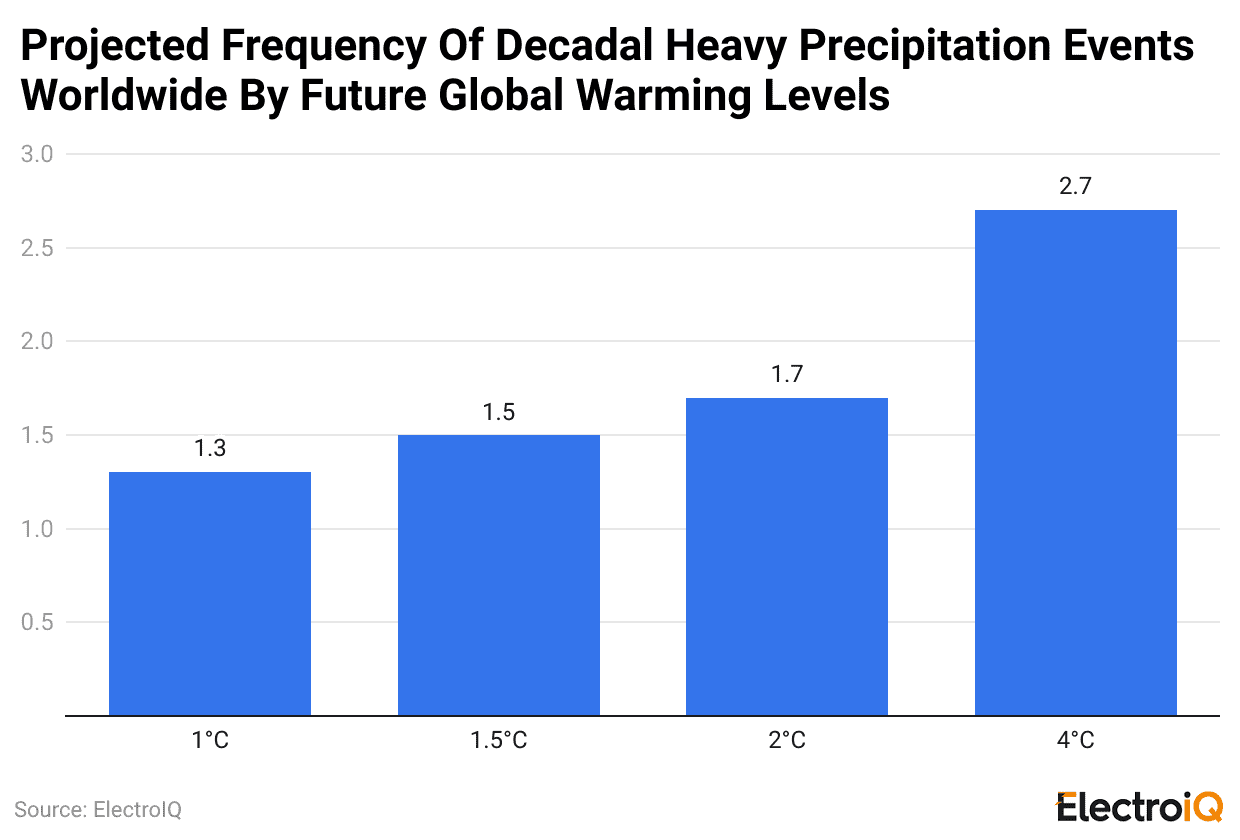
Projected Frequency Of Decadal Heavy Precipitation By Temperature Increase
 (Reference: statista.com)
Rainfall Statistics have predicted that heavy rainfall is 2.7x more likely to occur once every ten years at an increased global warming temperature of 4.0°C. Due to global warming in the coming years, extreme weather cases, including flooding, are forecast to become more frequent and intense.
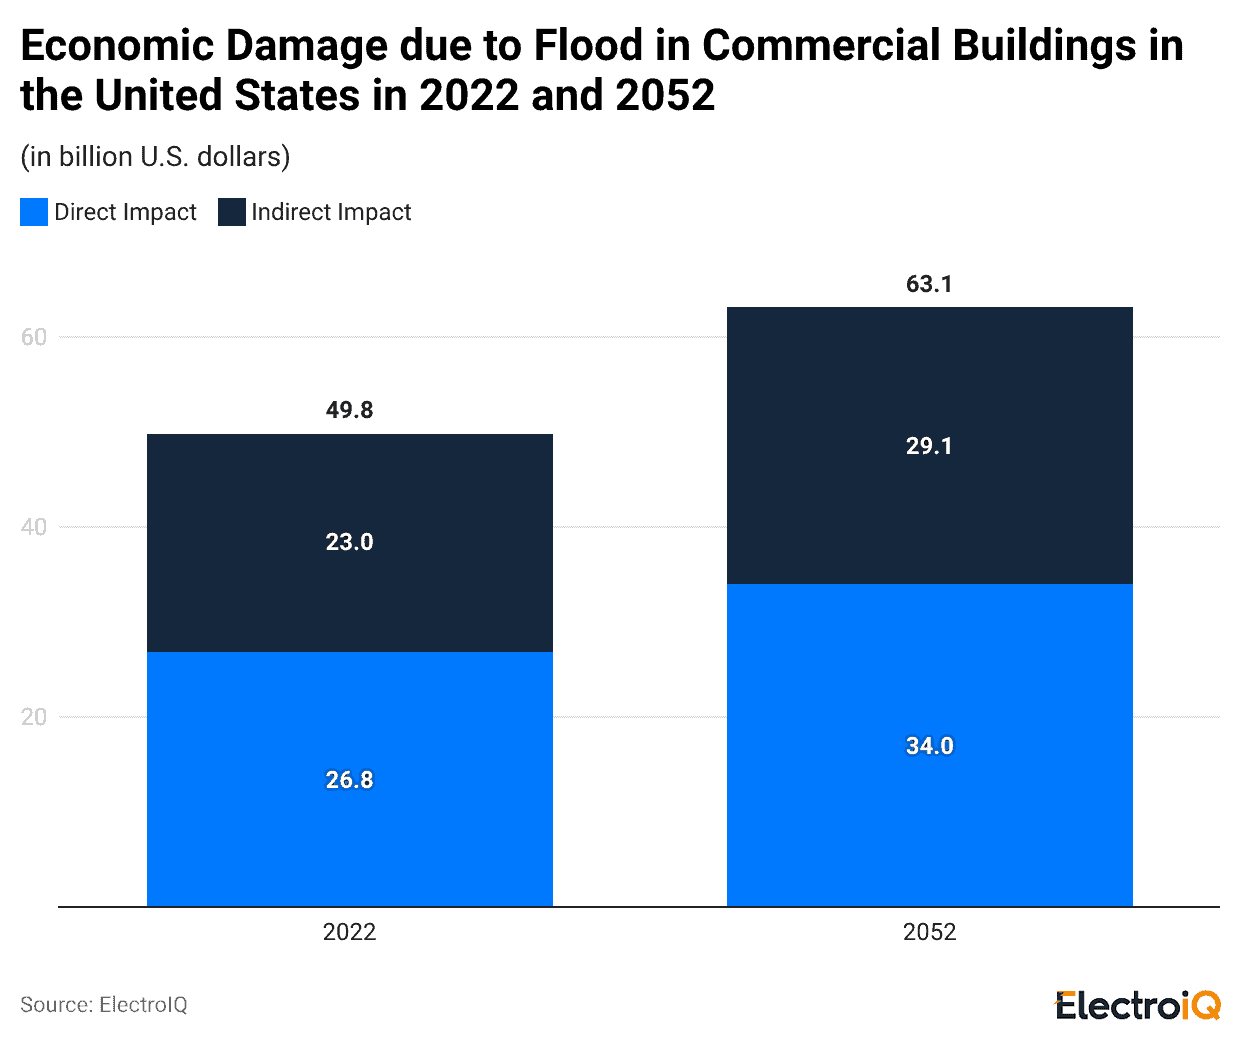
Change In Economic Damage Due To Floods In Commercial Buildings In The USA
 (Reference: statista.com)
As Rainfall Statistics forecasted an increased level of flood in the coming years, the economic damage due to floods to buildings in the USA has significantly increased. Between 2022 and 2052, the direct impact will increase from 26.8% to 34%, while the indirect effect is predicted to account for 29.1% from 23%. Overall, the damage will reach $63.1 billion, which was merely 49.8 billion in 2022.
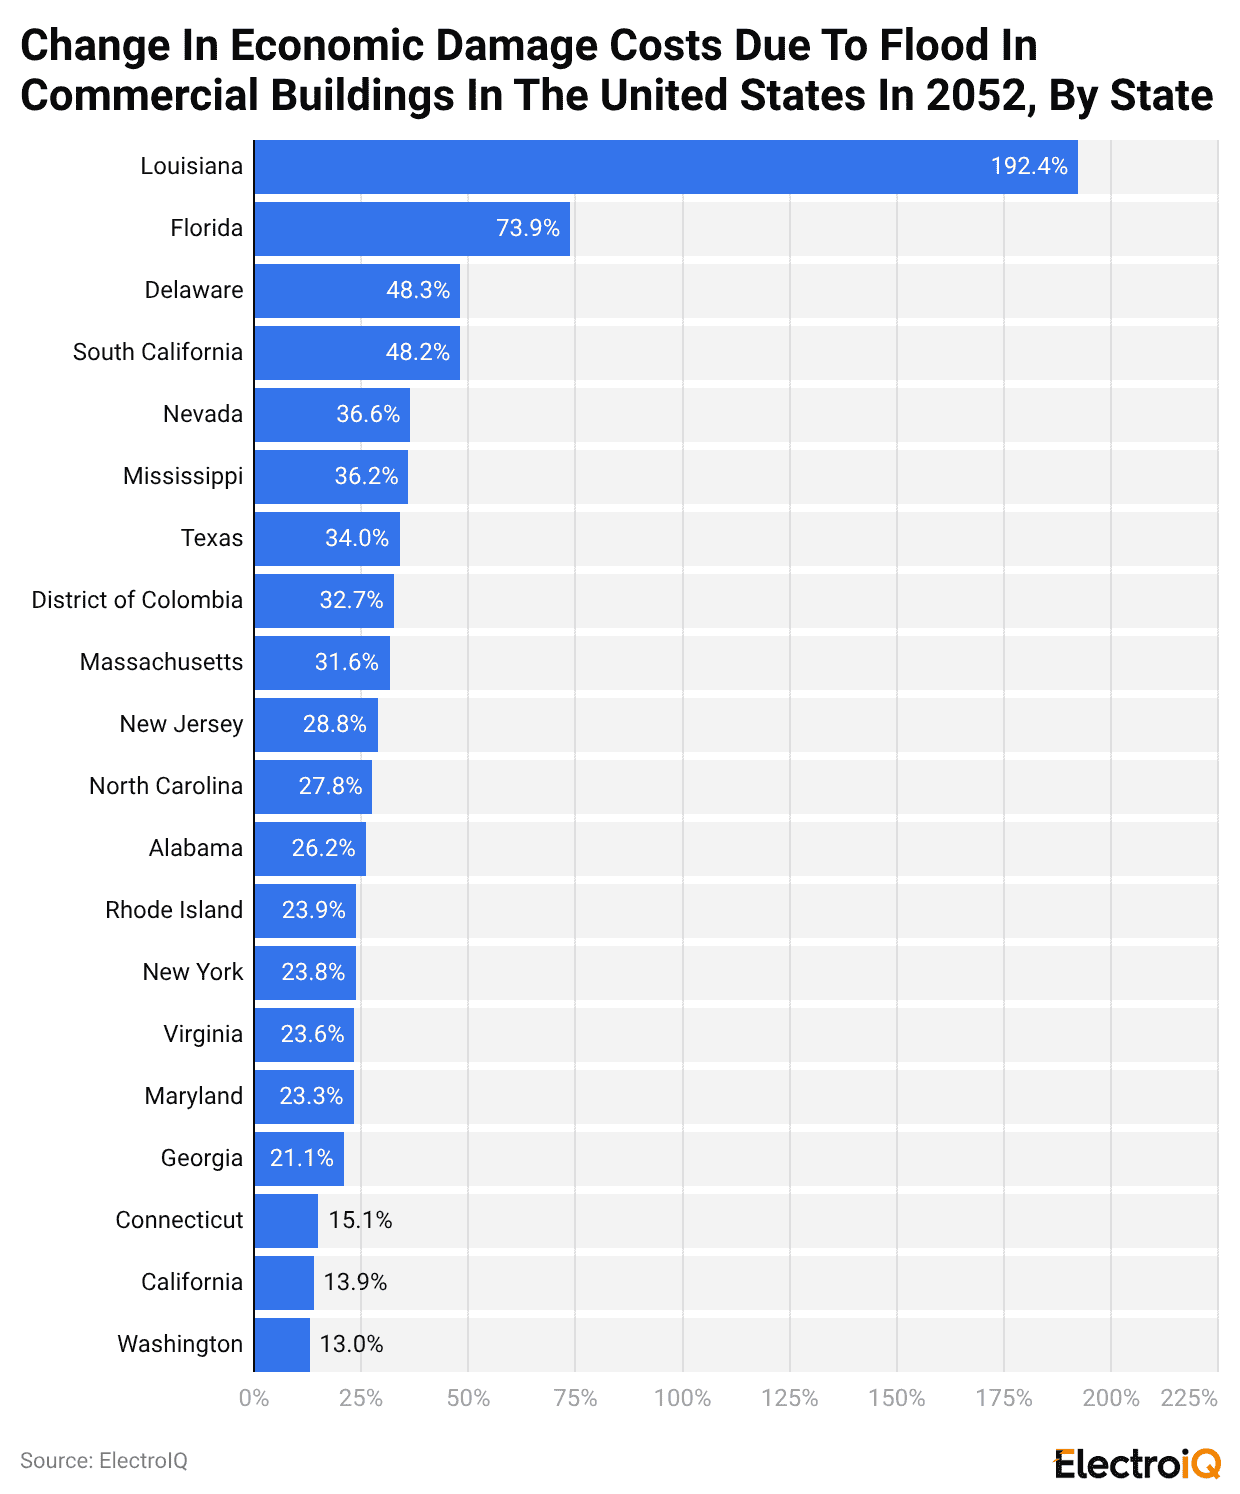
Change In Economic Damage Due To Floods In Commercial Buildings In The USA By 2052 By State
 (Reference: statista.com)
Louisiana is likely to experience the highest economic cost increase due to floods by 2052, resulting in 192.4%. Florida and Delaware are likely to increase the cost by 73.9% and 48.3%. Over the next 30 years, each state in the USA will incur significantly more damage costs.
Highest Rainfall Anomalies In The USA By States
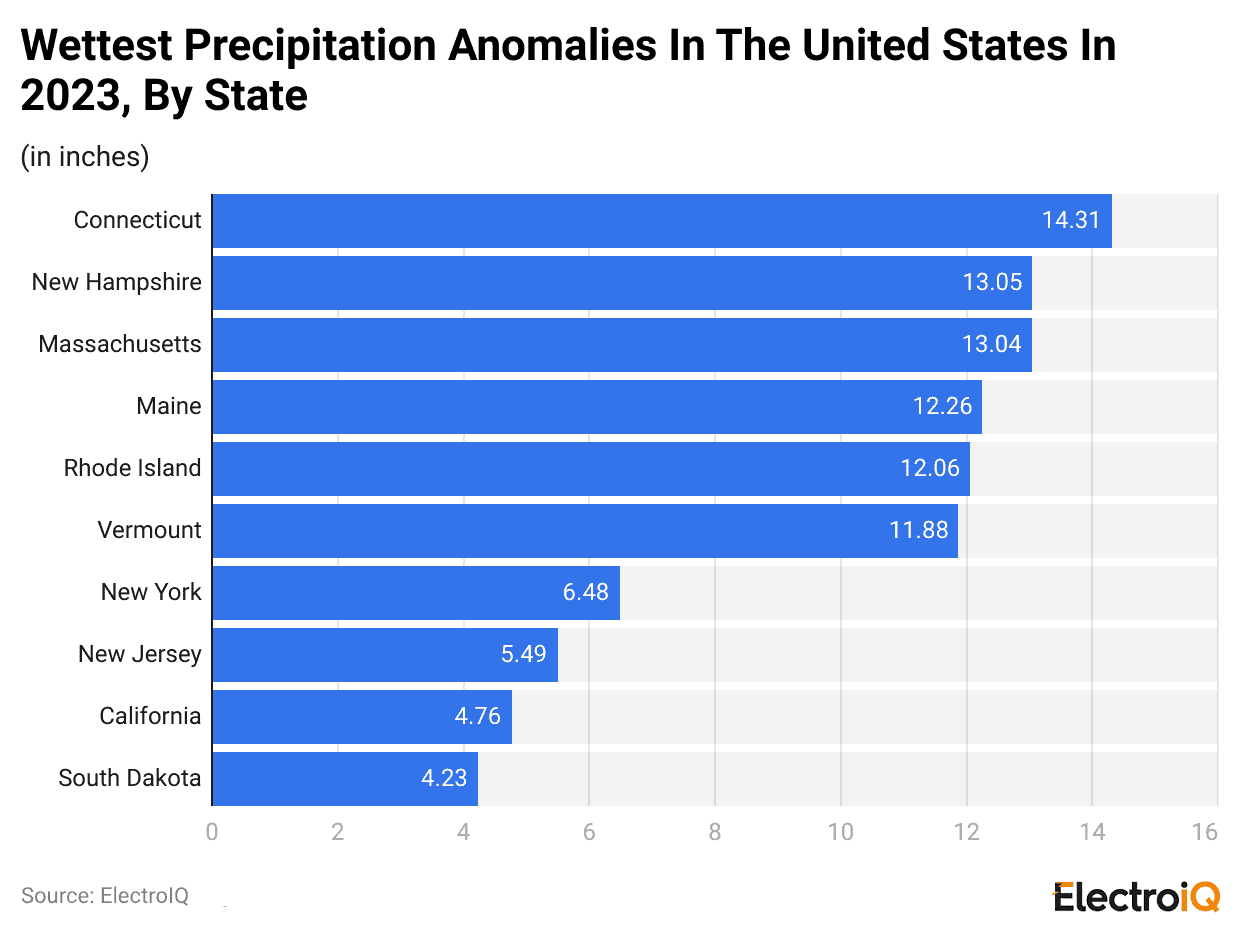 (Reference: statista.com)
Rainfall Statistics 2023 show that in the USA, Connecticut, New Hampshire, and Massachusetts recorded the wettest precipitation anomalies at 14.31, 13.05, and 13.04 inches. Maine, Rhode Island, and Vermont were other states with the highest precipitation, while New York, New Jersey, California, and South Dakota recorded comparatively the lowest.
Annual Precipitation Change By 2050
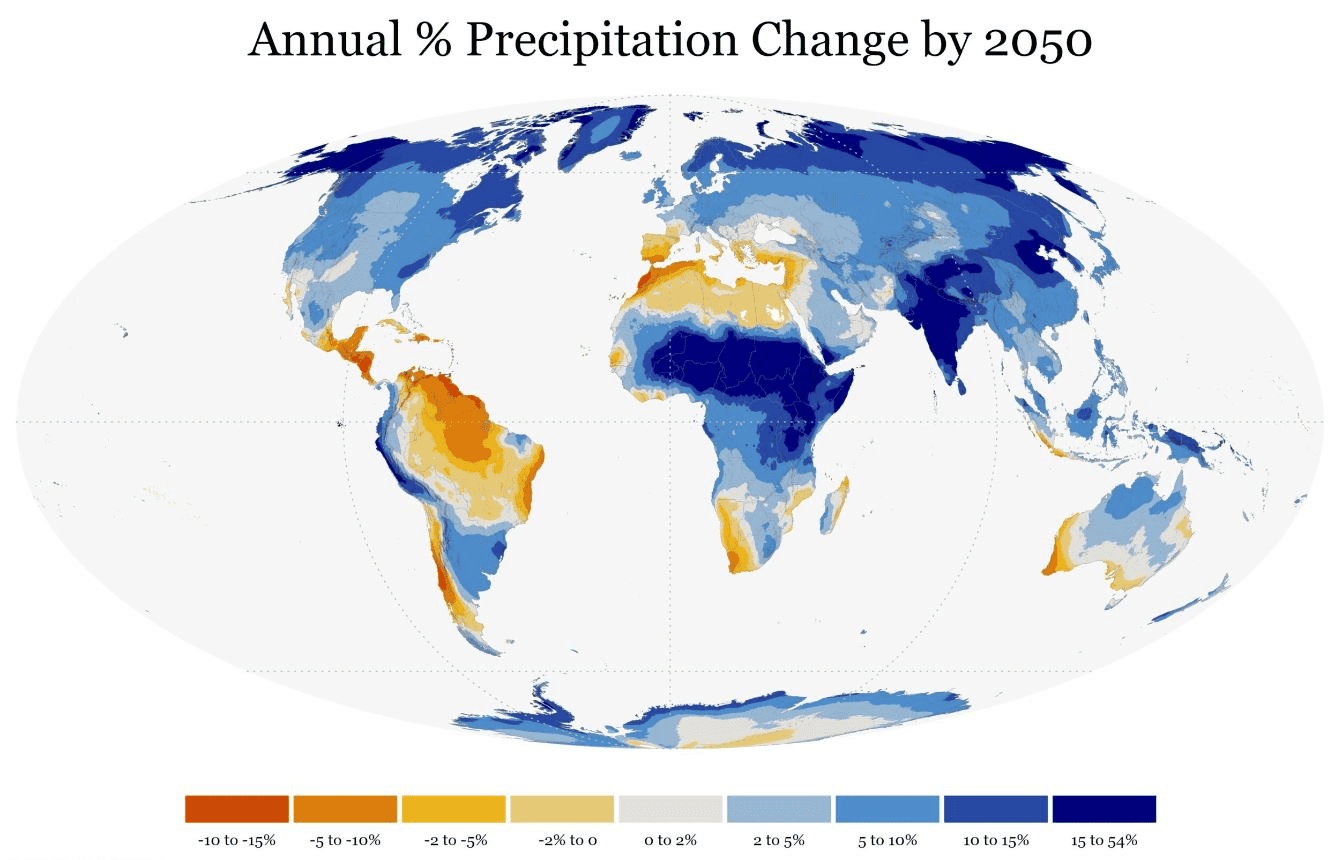
(Source: esri.com)
In the next 30 years, precipitation is likely to increase significantly in many parts of the world. Southern Asia, eastern Europe, northern Africa, and Northern America will see a significant difference of 15 to 54%. Central America, Western Europe, and Southern Europe will see comparatively minor changes in precipitation.
Wet Season Precipitation Change By 2050
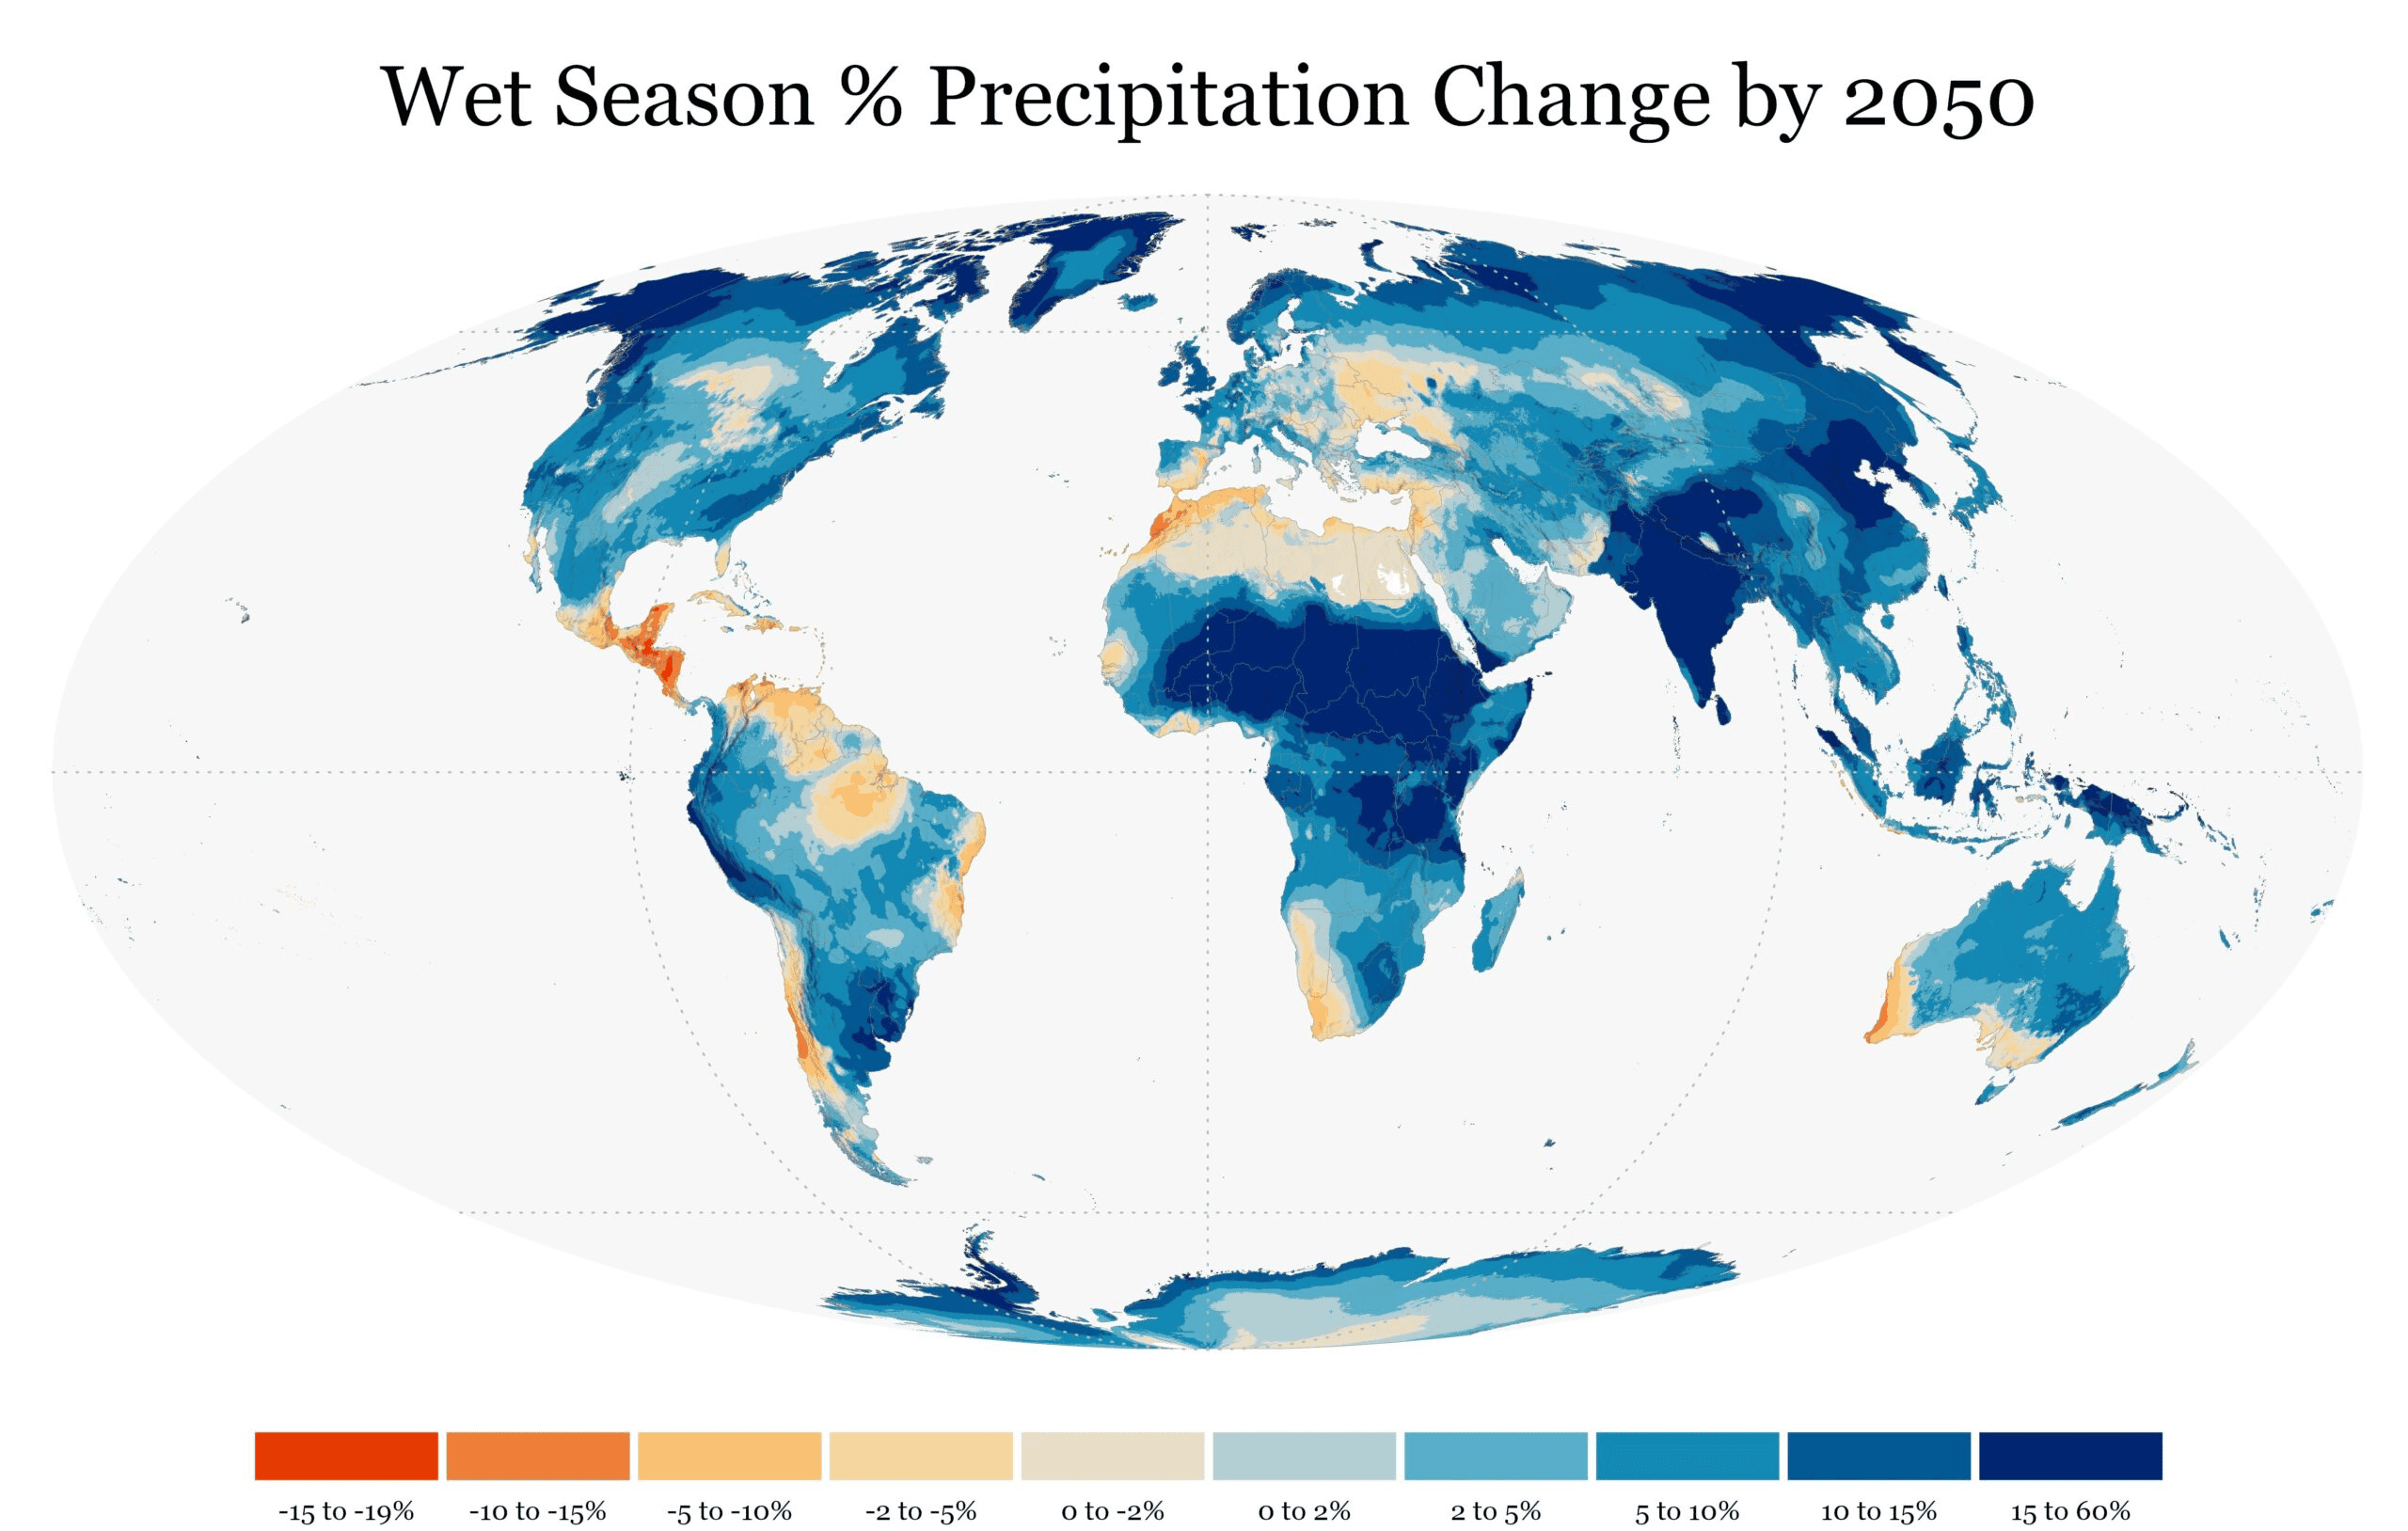
(Source: esri.com)
Most parts of the world are likely to experience a 2% to 15% increase in the wet season; however, eastern Europe, southern Asia, and Northern Africa are anticipated to record the highest precipitation rate, between 15% and 60%.
Rainfall Statistics By Country
United Kingdom
(Reference: statista.com)
In the United Kingdom, compared to other countries in the UK, Scotland recorded comparatively more rain. However, In 2023, Wales experienced higher rainfall, contributing 1,700 millimeters.
Annual Precipitation In The USA In 2023 By State
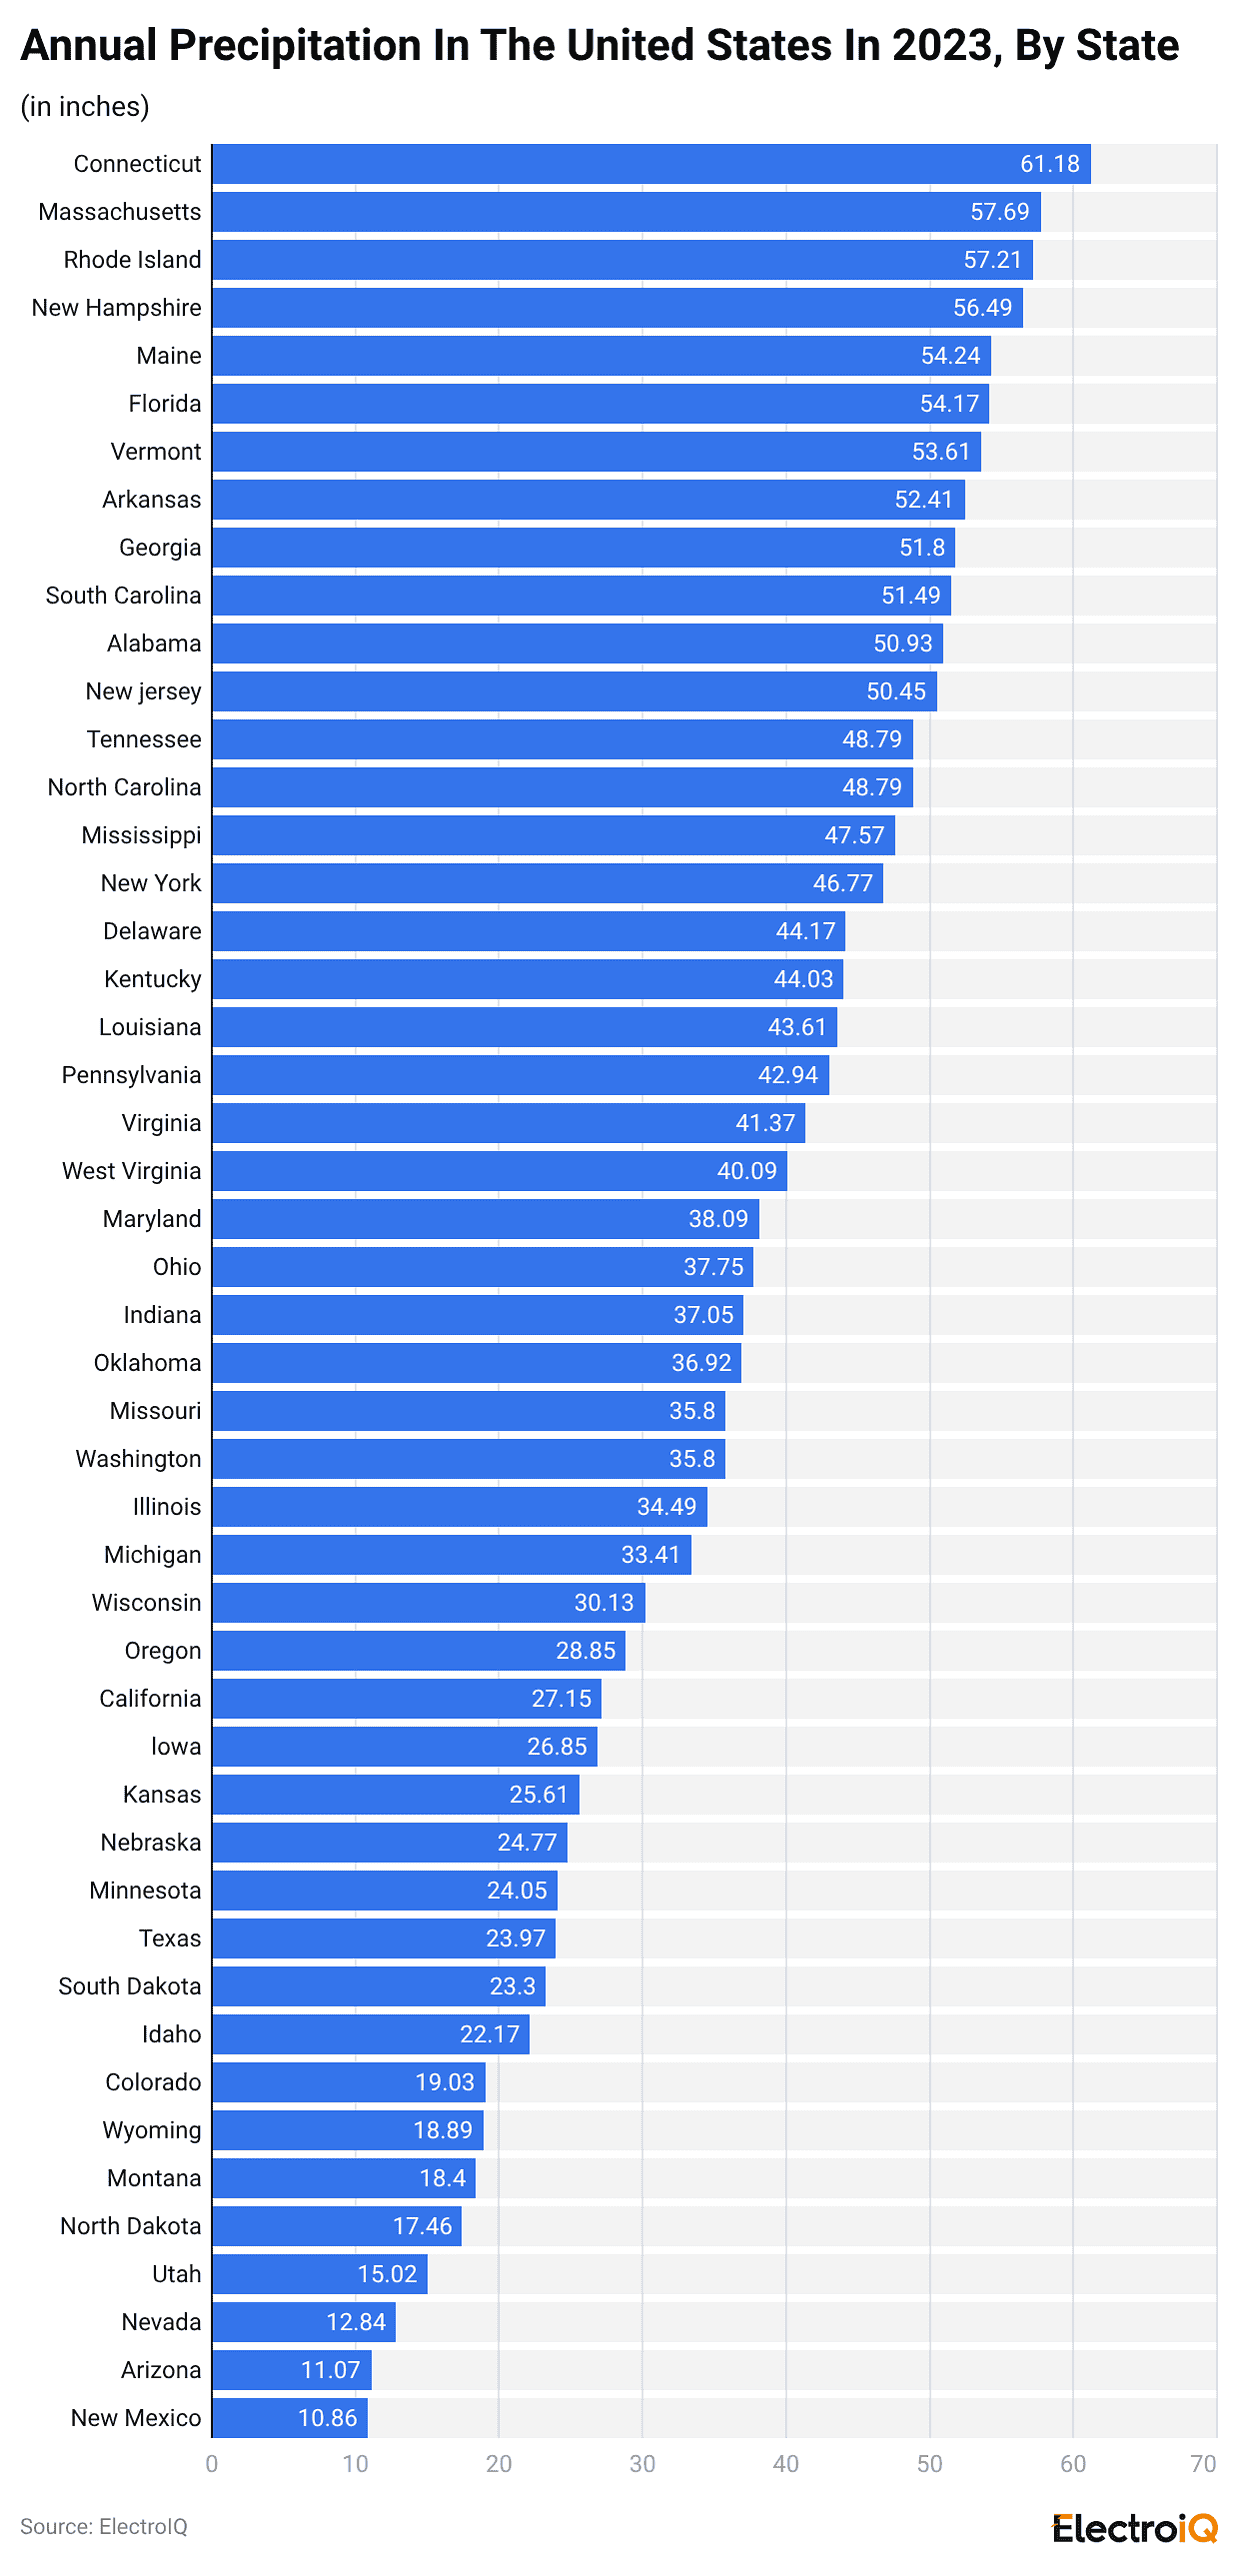 (Reference: statista.com)
According to Precipitation Statistics 2023, Connecticut recorded the highest, contributing 61.18 inches. In addition, the states with the highest precipitation are Massachusetts, Rhode Island, New Hampshire, and Maine.
Countries With The Highest Flood Risk In 2023
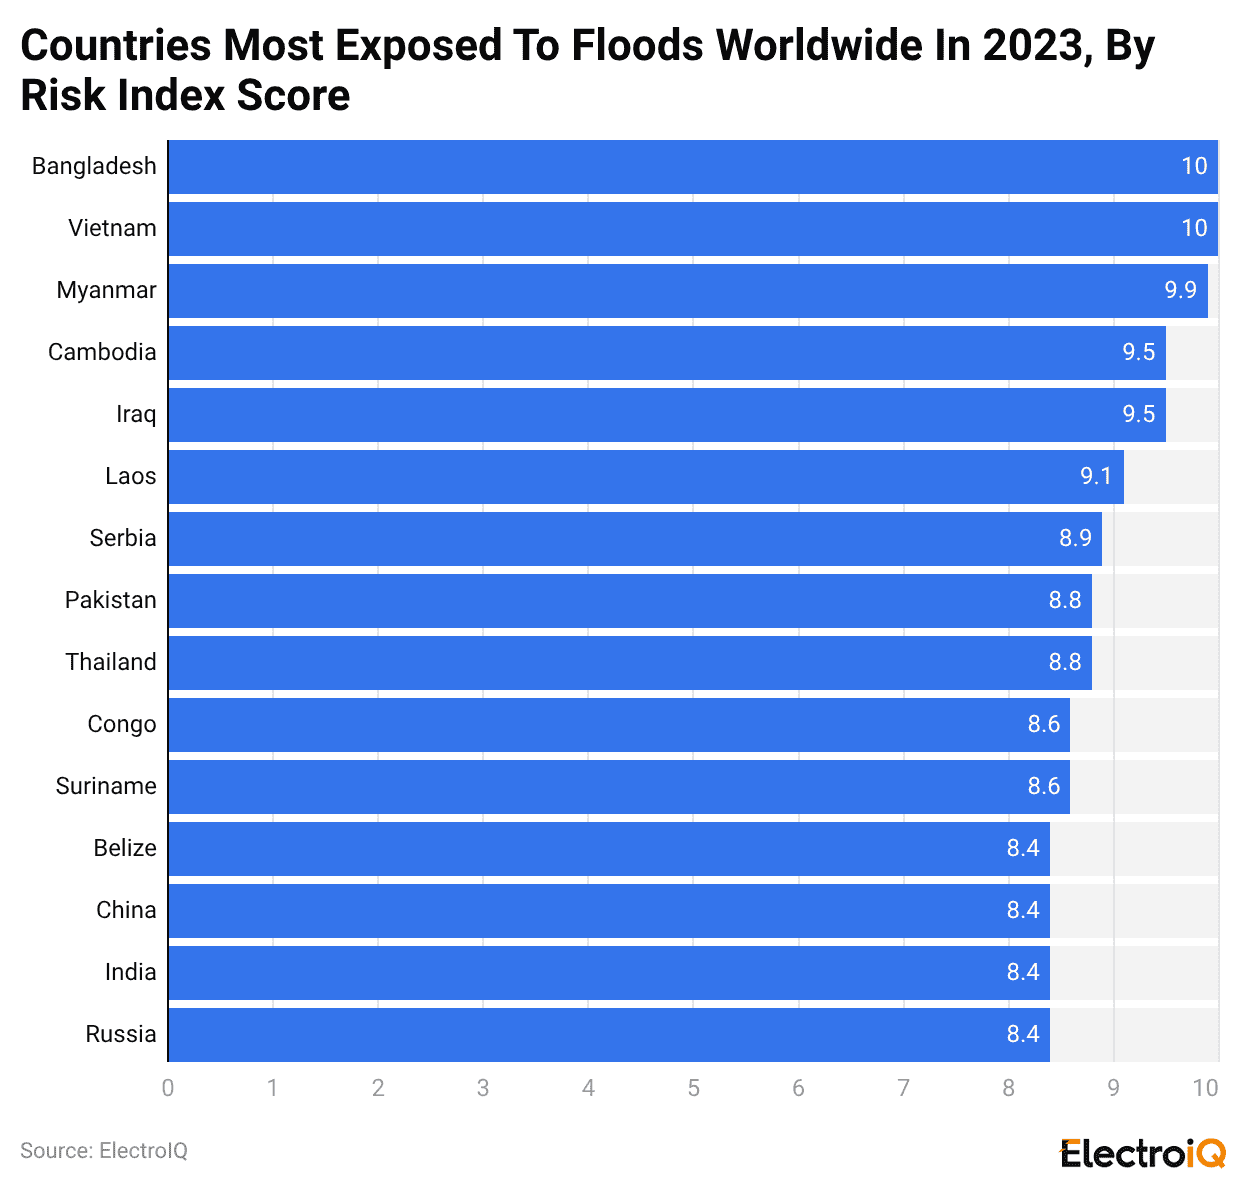 (Reference: statista.com)
As of 2023, Rainfall Statistics showed that Bangladesh, Vietnam, and Myanmar were the top 3 countries with highly exposed flood rates by risk. On the other hand, Belize, China, India, and Russia recorded the lowest risk of floods comparatively.
Growth In Global Population Exposure To Flooding By Scenario
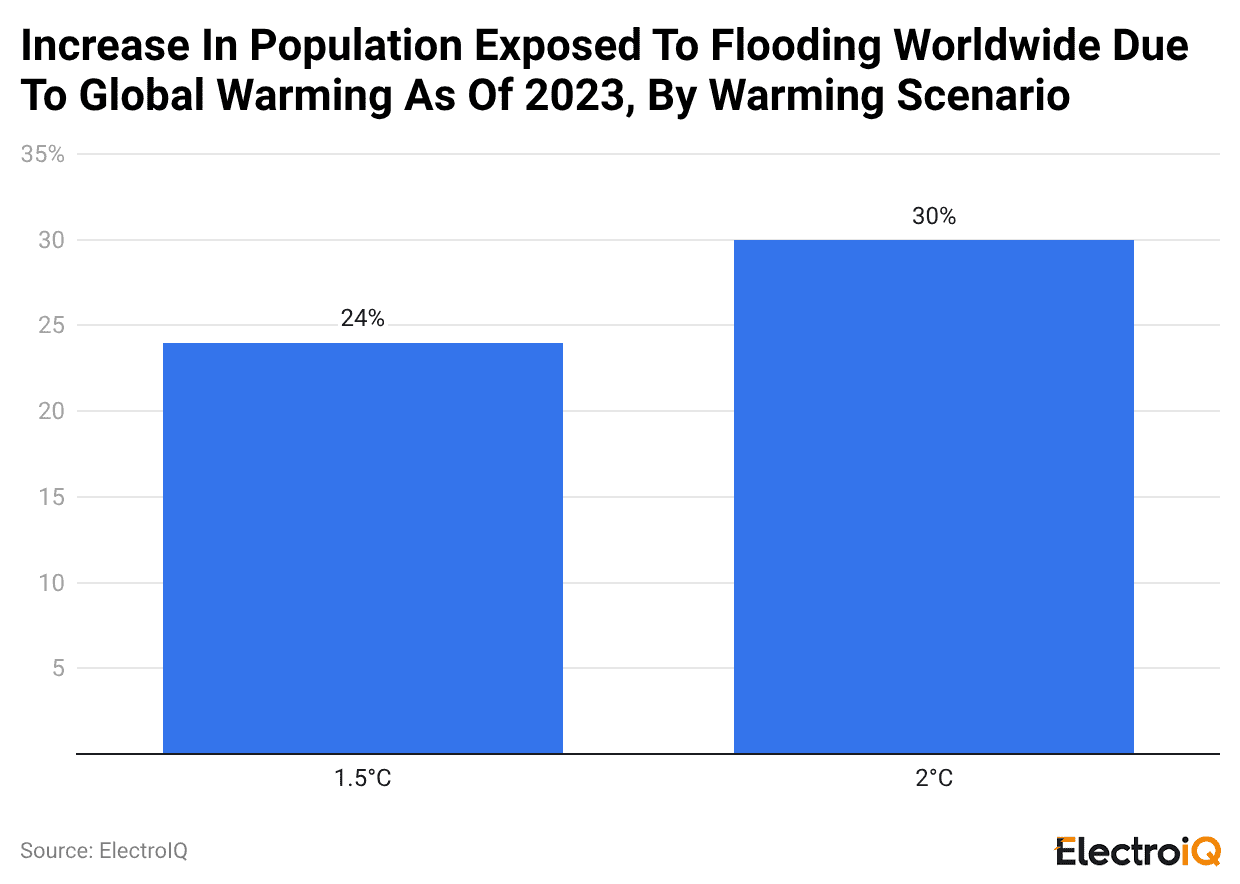 (Reference: statista.com)
For a temperature under 1.5 degrees Celsius, the global population will likely increase by 24%, and people will be more exposed to flooding events. On the other hand, when it reaches 2 degrees Celsius, the exposure will be around 30%.
Economic Losses From Natural Disasters By Type
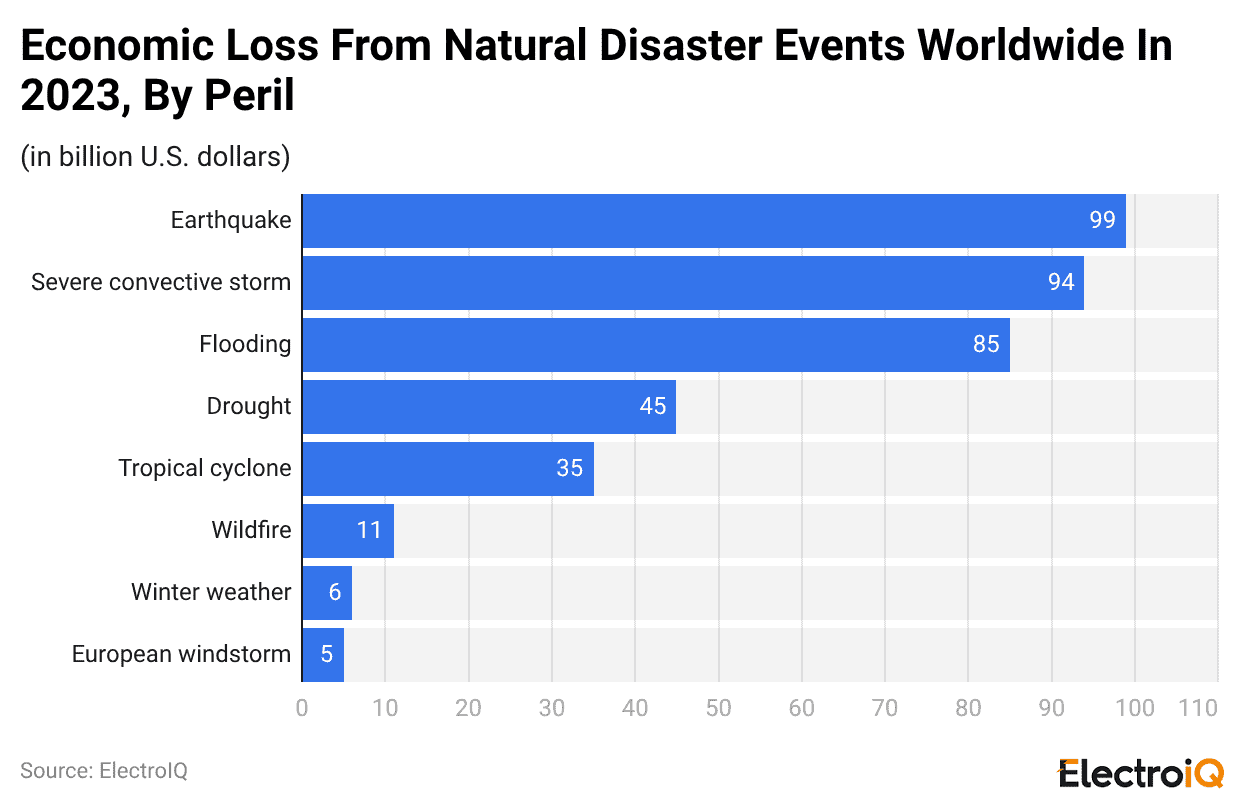 (Reference: statista.com)
According to the Rainfall Statistics 2023, flooding caused by extreme weather events is the third largest cause of global economic losses from natural disasters, contributing $85 billion. Earthquakes and severe convective storms are the leading types of natural disasters globally, with the highest economic losses representing $99 billion and $94 billion.
The Most Expensive Flood Disasters Worldwide Between 1990 And 2023 By Economic Losses
- China Seasonal Floods, China, 2021 – $35 billion
- Yangtze River Floods, China, 2016 – $36 billion>
- Japan Floods, Japan, 1953 – $37 billion
- Yangtze River Floods, China, 1931 – $41 billion
- China Seasonal Floods, China, 2020 – $42 billion
- Western Europe Floods, Europe, 2021, $52 billion
- Yangtze River Floods, China, 2010, $55 billion
- Yangtze River Floods, China, 1998 – $59 billion
- Thailand Floods, Thailand 2011 – $61 billion
Top 10 Wettest Places On Earth
- Emei Shan, Sichuan Province, China – average annual rainfall: 8,169 mm
- Kukui, Maui, Hawaii – average annual rainfall: 9,293 mm
- Mount Waialeale, Kauai, Hawaii, average annual rainfall: 9,763 mm
- Big Bog, Maui, Hawaii, average annual rainfall: 10,272 mm
- Debundscha, Cameroon, Africa, average annual rainfall: 10,299 mm
- San Antonio de Ureca, Bioko Island, Equatorial Guinea, average annual rainfall: 10,450 mm
- Cropp River, New Zealand, average annual rainfall: 11,516 mm
- Tutunendo, Colombia, South America, average annual rainfall: 11,770 mm
- Cherrapunji, Meghalaya, India, average annual rainfall: 11,777 mm
- Mawsynram, Meghalaya, India, 11,872
Rainfall And Flood Problems
Rainfall is a vital component of the Earth’s water cycle, sustaining life and ecosystems. However, excessive or insufficient rainfall can lead to various problems, including floods, droughts, and disruptions to agriculture and infrastructure. Across the world, communities face challenges in managing rainfall patterns, exacerbated by climate change and urbanization.
The Global Flood Challenge
Floods are one of the most destructive natural disasters, affecting millions of people worldwide each year. According to the World Bank, floods cause an average of $100 billion in damages annually. Developing countries are particularly vulnerable, with over 90% of flood-related deaths occurring in low and middle-income countries.
Rainfall Variability And Climate Change
Climate change is altering rainfall patterns, leading to increased variability and extreme weather events. Warmer temperatures intensify the water cycle, resulting in more intense rainfall in some regions and prolonged droughts in others. The frequency and severity of floods are expected to rise as climate change continues.
Regional Impacts Of Rainfall And Floods
In Southeast Asia, monsoon rains bring both relief and devastation. Countries like Bangladesh and India experience annual monsoon floods, displacing millions and causing extensive damage to crops and infrastructure. In the United States, hurricanes and tropical storms frequently trigger flash floods along coastal areas, endangering lives and property
Africa faces its challenges with rainfall variability. Countries like Kenya and Somalia grapple with recurrent droughts, leading to food shortages and water scarcity. When rain does come, they often arrive in heavy downpours, causing flash floods and soil erosion.
Latin America also contends with rainfall extremes. Countries like Brazil and Colombia experience seasonal floods and landslides, impacting communities and ecosystems. Deforestation exacerbates these issues, reducing the land’s ability to absorb rainfall and increasing the risk of flooding
Future Weather Prediction
Advancements in technology and data analysis offer hope for better weather prediction and flood management. Meteorological agencies use satellites, radar systems, and computer models to forecast rainfall patterns with increasing accuracy. High-resolution weather models can now provide detailed forecasts at local scales, enabling communities to prepare for impending floods or droughts.
Machine learning and artificial intelligence (AI) are revolutionizing weather forecasting. These technologies analyze vast amounts of data to identify patterns and predict future weather conditions more precisely. By incorporating data from diverse sources such as social media and sensor networks, AI-powered models can enhance the accuracy and timeliness of weather forecasts.
Probabilistic forecasting is another promising approach. Instead of providing a single forecast, probabilistic models estimate the likelihood of different weather outcomes, helping decision-makers assess uncertainty and risk. This enables governments, businesses, and communities to make informed choices and implement adaptive strategies to mitigate the impacts of extreme weather events.
Investments in early warning systems and disaster preparedness are crucial for reducing the human and economic toll of floods. By providing timely alerts and evacuation plans, early warning systems can save lives and minimise property damage. International cooperation is also essential, as floods often transcend national borders, requiring coordinated responses and resource sharing.
Rainfall variability and floods pose significant challenges across the world, impacting communities, economies, and ecosystems. Climate change exacerbates these problems, making proactive adaptation measures imperative. Through advancements in technology and data analysis, there is hope for more accurate weather prediction and effective flood management. By investing in early warning systems, disaster preparedness, and sustainable development practices, we can build resilience and mitigate the impacts of rainfall-related disasters on a global scale.
Conclusion
Natural disasters are unavoidable. Despite technological advancement, we have yet to find solutions to severe natural disasters that lead to huge economic losses. Extreme rainfalls have become frequent in the last few years. Global Warming is the cause of everything. Around the world, sewage systems do not have any capacity to hold heavy falls.
Moreover, we have flooded the sewage with garbage, water bottles, plastic, etc, which blocks water flow. All of these lead to uneven distribution of water management and turn into natural disasters. These Rainfall Statistics warn us about the dangerous levels in the next 30 years. Thus, it is time to act for a sustainable future by reducing global warming.

Maitrayee Dey has a background in Electrical Engineering and has worked in various technical roles before transitioning to writing. Specializing in technology and Artificial Intelligence, she has served as an Academic Research Analyst and Freelance Writer, particularly focusing on education and healthcare in Australia. Maitrayee's lifelong passions for writing and painting led her to pursue a full-time writing career. She is also the creator of a cooking YouTube channel, where she shares her culinary adventures. At Smartphone Thoughts, Maitrayee brings her expertise in technology to provide in-depth smartphone reviews and app-related statistics, making complex topics easy to understand for all readers.


