Table of Contents
- Introduction
- Editor’s Choice
- Online Gaming Statistics
- General Cloud Gaming Statistics
- Cloud Gaming Market Size
- Cloud Gaming Comparison by Top Countries
- Cloud Gaming Market Key Players
- Cloud Gaming Statistics by User Adoption and Penetration Rate
- Top 5 Leading Cloud Gaming Platforms in 2025
- Cloud Gaming User Penetration Statistics by Region
- Cloud Gaming Usage Frequency Statistics
- Cloud Gaming Statistics by Preferred Devices
- Popular Cloud Gaming Platforms
- Key Insights of Cloud Gaming Statistics
- Conclusion
Introduction
Cloud Gaming Statistics: Cloud gaming lets a player enjoy video games without a powerful console or PC. The game actually runs on strong computers stored in remote data centres. The player needs a device with a screen, such as a phone, laptop, or smart TV, and a good internet connection. The servers stream the game’s video and audio, while the player’s button presses and movements are sent back to the server almost instantly. Because of this, they can play new, high-quality games on cheaper or older devices. Cloud gaming also reduces the need to buy costly hardware and download large files. It gives quick access to many games and makes online, cross-platform play easier to enjoy.
This article on Cloud Gaming Statistics includes several current analyses from different sources that will help effectively understand the overall market.
Editor’s Choice
- According to Statista, the global cloud gaming market is forecast to earn about USD 10.46 billion by 2025.
- From 2025 to 2030, it may grow at about 22.28% per year, reaching USD 28.60 billion in 2030.
- In the same period, the market could have roughly 505.13 million users.
- Meanwhile, the user share might be 5.83% in 2025 and increase to 6.22% by the end of
- The average revenue per user is expected to be about USD 22.97.
- In 2025, the United States is likely to be the largest revenue source, accounting for USD 2.90 billion.
- According to Precedence Research Analysis, in 2024, the Asia Pacific region accounted for the largest share of the cloud gaming market at 46%.
- From 2025 to 2034, the market will grow at a CAGR of 44.03%.
- In the global cloud gaming market, NVIDIA Corporation leads with 21%, followed by Intel Corporation at 16% and Microsoft Corporation at 14%.
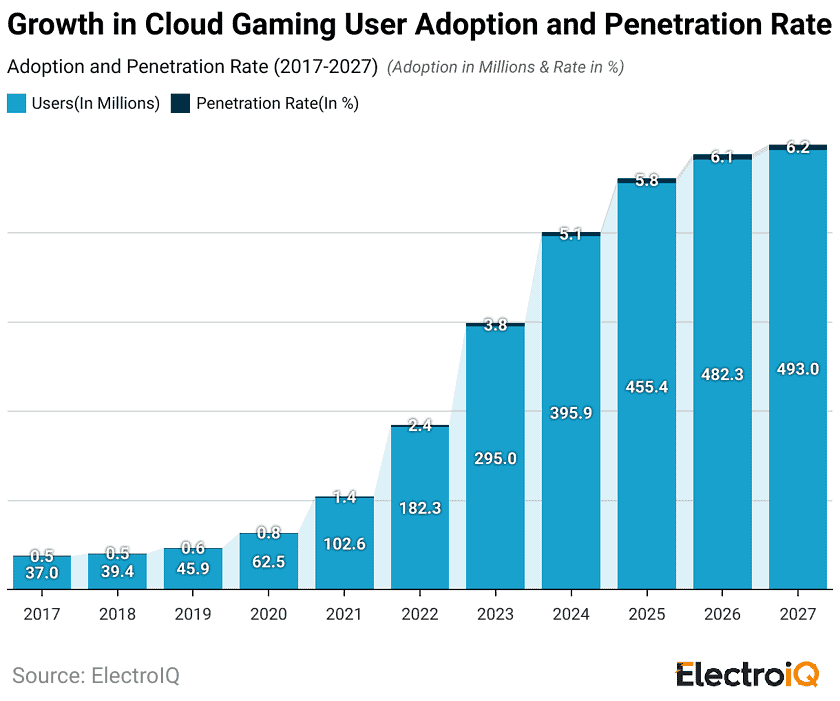
- As of 2025, the adoption of cloud gaming is expected to increase by around 455.4 million, with a penetration rate of 5.8%.
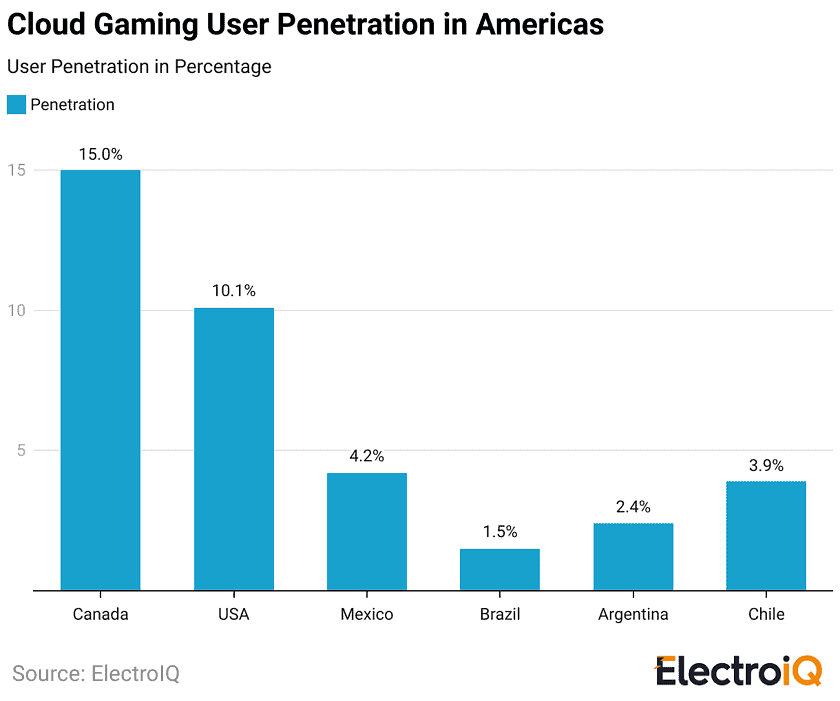
- Cloud gaming’s higher user penetration in the Americas varies widely, with Canada at 15% and the United States at 10.1%.
Online Gaming Statistics
- 77% of Millennials and 81% of Gen Z consumers actively play video games, and this indicates that gaming remains a core part of entertainment behavior among younger cohorts. Gen Z gamers record an average weekly playtime of 7 hours and 20 minutes, while Millennials report 6 hours and 50 minutes, showing slightly lower engagement.
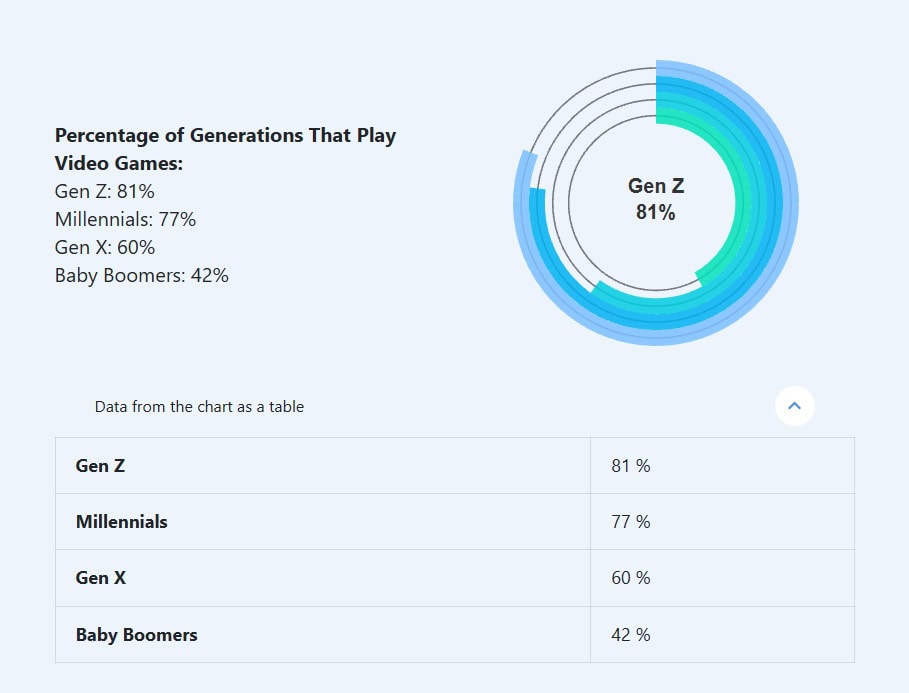
(Source: cloudwards.net)
- 78% of gamers in the U.S. state that online gaming supports the formation of new friendships and relationships, and this reflects the strong social function of digital play. These interactions occur both through meeting new people online and strengthening bonds with existing friends.
- 90% of gamers in the U.S. report experiencing joy from gaming, and 87% agree that video games provide meaningful mental stimulation. This demonstrates that emotional and cognitive rewards are strongly associated with gaming activities.
- More than 30% of teen gamers say that gaming has supported their mental health, while only 8% report negative impacts, and this suggests a generally positive psychological influence. In addition, 56% of teen gamers acknowledge improvements in problem-solving skills due to gaming, highlighting cognitive development benefits.
- 67% of adults and 76% of children under 18 in the U.S. play video games, indicating broad adoption across households and supporting the role of gaming as a key leisure activity.
- The average gamer in the U.S. is 31 years old, and the 18 to 34 age group accounts for 38% of all players, representing the largest share. Players younger than 18 make up 20% of the gaming population, while individuals aged 65 and above form the smallest group at 7%.
General Cloud Gaming Statistics
- Cloud gaming refers to game streaming where titles run on remote servers and players receive video and audio output over the internet.
- The global cloud gaming market is projected to reach USD 18.71 billion in 2027, rising from USD 4.34 billion in 2022.
- Cloud gaming increases accessibility because high-end hardware is not required and players only need a stable connection to interact with remote servers.
- The concept has existed since the early 2000s, but early limitations in network speeds and computing infrastructure restricted adoption.
- Growth in high-speed connectivity and cloud computing has supported market expansion, although the activity remains far from mainstream.
- Technical complexity, latency concerns, and operational costs continue to be cited by major gaming companies as challenges for long-term business sustainability.
- Leading cloud gaming services include NVIDIA GeForce Now, Boosteroid, Microsoft Xbox Cloud Gaming, and Amazon Luna which is limited to select countries.
- Market entry remains difficult because many platforms struggle to gain a strong user base that can justify ongoing operating expenditure.
- Sony merged its PlayStation Now service into PlayStation Plus Premium in 2022 as part of a strategic shift in its subscription model.
- Google Stadia, launched in 2019, was discontinued in 2021 and fully closed in 2023 due to limited consumer traction and high operating costs.
- Consumer awareness has grown rapidly, rising from 14% in 2020 to 43% in 2022 among online users in the United States.
- In early 2023, 24% of U.S. gamers reported being very interested in cloud gaming subscriptions and another 24% expressed moderate interest.
- Subscription rates for dedicated cloud gaming services remain lower than general gaming subscription adoption levels across major markets.
- Cloud gaming emerged as a major regulatory factor in the proposed Microsoft acquisition of Activision Blizzard, delaying approval processes.
- Microsoft has signed several 10-year agreements with Nvidia GeForce Now, Boosteroid, Ubitus, and Nware to distribute Xbox PC titles.
- The global online gaming industry generated USD 27.97 billion in revenue in 2024.
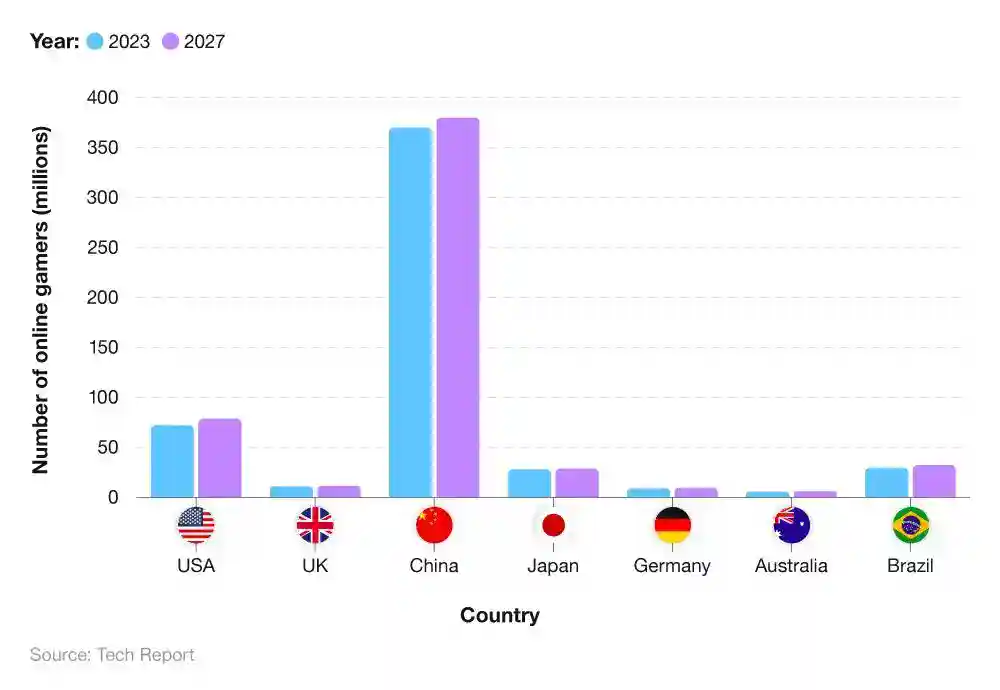
- The number of online gamers in the UK is forecast to increase from 10.84 million in 2023 to 11.56 million in 2027, reflecting 6.64% growth.
- In 2024, 80% of UK gamers aged 16 to 24 played online.
- Among gamers aged 65 and above, 48% engaged in online play despite being the lowest-use age group.
- In the UK, 50% of women consider themselves gamers compared to 57% of men.
- Mobile phones are the leading gaming device, with 34% of UK players using them as their primary access point.
- Around six in ten UK gamers state that gaming improves their overall happiness and emotional wellbeing.
- The global esports market is projected to reach USD 10.91 billion by 2032.
- Dota 2 is the top global esports title with USD 6.84 million in cumulative prize pool earnings between January and June 2025.
- Esports players from China have earned more than USD 320 million in combined winnings, making them the highest-earning player base.
- Fortnite leads global online game popularity with 12.50 million weekly Twitch viewer hours.
- Apex Legends ranks second with more than 4.9 million weekly viewer hours, which is less than half of Fortnite’s viewership.
- Call of Duty is the only franchise with two titles among the top nine global battle royale games.
- Call of Duty Warzone ranks third with over 4.7 million weekly Twitch viewer hours.
- Call of Duty Modern Warfare ranks fifth with just under 1.9 million weekly weekly viewer hours, which is less than half of Warzone’s total.
Cloud Gaming Market Size
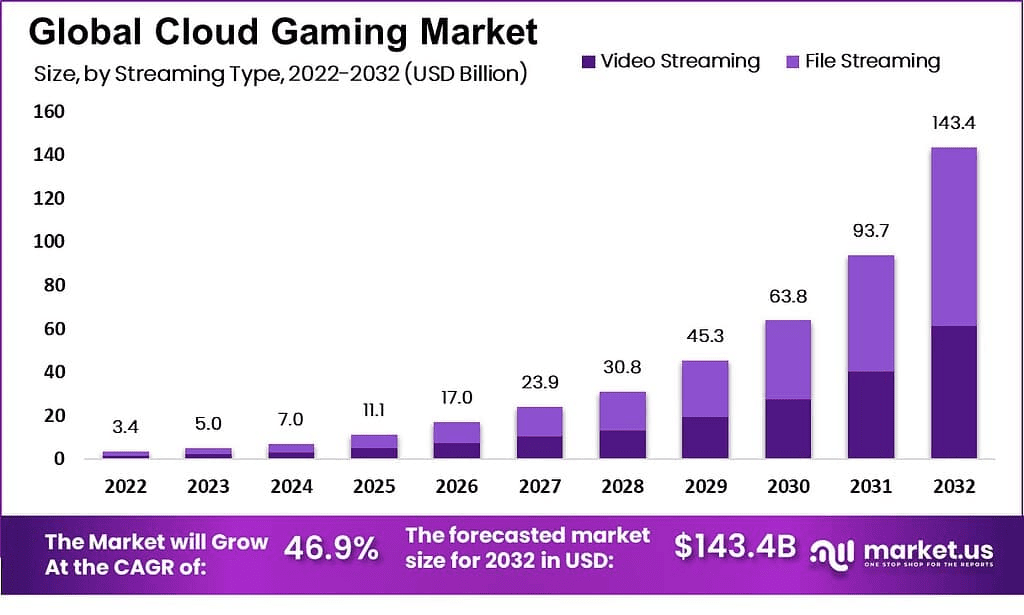
(Source: market.us)
- The Global Cloud Gaming Market is expected to reach USD 143.4 Billion by 2032, rising from USD 5.0 Billion in 2023, with a strong CAGR of 46.9% during 2023 to 2032.
- Global cloud gaming users in 2024 are estimated at 29.8 million, reflecting rapid growth and wider acceptance across regions.
- North America leads the global user distribution with 17.3 million users, representing more than 50% of the total user base.
- Europe records 8 million cloud gaming users in 2024, supported by strong digital infrastructure and high adoption rates.
- Asia Pacific accounts for 3.6 million users, showing rising traction driven by large gaming populations and improving internet access.
- The rest of the world contributes 0.9 million users, indicating growing interest in early-stage cloud gaming markets.
- Mobile cloud gaming represents 12.2 million users, equal to 41% of total cloud gamers, supported by widespread smartphone usage and the expansion of 5G networks.
- Casual cloud gamers account for 14.2 million users, reflecting strong interest in easy and accessible gaming experiences.
- Core and enthusiast cloud gamers represent 15.6 million users, showing demand for high-quality and immersive gameplay without expensive hardware.
- Cloud gaming is projected to grow rapidly due to advancing mobile networks, lower device costs, and increasing demand for flexible gaming models.
- File streaming leads the market’s streaming type segment as it reduces production costs and supports faster content delivery for developers.
- Asia Pacific shows the largest market share globally, driven by strong gaming communities in China, India, and Japan.
- Major companies active in cloud gaming include NVIDIA, Amazon Inc., Apple Inc., Google Inc., Intel Corporation, IBM Corporation, Microsoft Corporation, and Sony Interactive Entertainment.
Cloud Gaming Comparison by Top Countries
- The cloud gaming market in the United States is expected to generate about USD 2.90 billion in 2025. With an annual growth rate of 21.94% from 2025 to 2030, the market is projected to reach nearly USD 7.83 billion by 2030. User numbers are anticipated to rise to 59.12 million, and user penetration is expected to increase from 15.50% in 2025 to 16.79% by 2030. Each user may generate about USD 54.52 in revenue.
- • In China, revenue is estimated at USD 2.35 billion in 2025 and projected to reach USD 6.76 billion by 2030 with a 23.51% CAGR. The country is expected to have 245.19 million users by 2030, while user penetration may grow from 15.47% to 17.23%. ARPU is expected to be around USD 10.61.
- • In Japan, cloud gaming revenue is projected at USD 829.82 million in 2025 and may reach USD 2.18 billion by 2030 with a 21.31% CAGR. User numbers are expected to hit 25.56 million by 2030. User penetration may increase from 18.31% in 2025 to 21.57% by 2030, with an ARPU of USD 37.17.
- • In the United Kingdom, revenue is estimated at USD 447.88 million in 2025 and projected to reach USD 1.17 billion by 2030 with a 21.14% CAGR. The country may reach 13.72 million users by 2030. Penetration is expected to grow from 18.15% to 19.83%, with an ARPU of USD 36.20.
- • In Germany, cloud gaming revenue is projected at USD 418.24 million in 2025 and may increase to USD 1.11 billion by 2030 with a 21.66% CAGR. User numbers may reach 11.17 million by 2030, while penetration may rise from 12.15% to 13.49%. ARPU is expected to be around USD 41.36.
Furthermore other four countries for Cloud Gaming market analysis are stated in the table below:
| Country | Revenue 2025 | Revenue 2030 (projected) | CAGR
(2025 to 2030) |
Users 2030 (projected) | User penetration 2025 | User penetration 2030 (projected) | Average revenue per user (ARPU) |
| China | USD 2.35 billion | USD 6.76 billion | 23.51% | 245.19 million | 15.47% | 17.23% |
USD 10.61 |
|
Japan |
USD 829.82 million | USD 2.18 billion | 21.31% | 25.56 million | 18.31% | 21.57% | USD 37.17 |
| United Kingdom | USD 447.88 million | USD 1.17 billion | 21.14% | 13.72 million | 18.15% | 19.83% |
USD 36.20 |
|
Germany |
USD 418.24 million | USD 1.11 billion | 21.66% | 11.17 million | 12.15% | 13.49% |
USD 41.36 |
Cloud Gaming Market Key Players
(Reference: market.us)
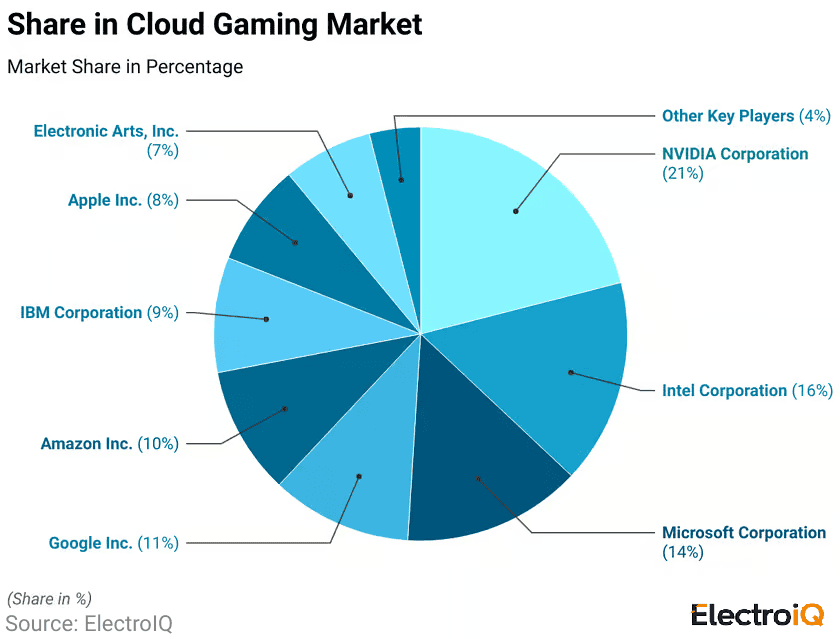
- In the global cloud gaming market, key participants are shaping a highly competitive environment through strong technology capabilities and user reach.
- NVIDIA Corporation holds 21%, which reflects its strong position supported by advanced GPU and streaming technologies.
- Microsoft Corporation accounts for 14%, indicating steady growth driven by its cloud ecosystem and gaming services.
- Google Inc. secures 11%, supported by its infrastructure strength and ongoing platform improvements.
- Intel Corporation maintains 16%, showing continued relevance through hardware and cloud optimization initiatives.
- IBM Corporation records 9%, reflecting its focus on enterprise cloud solutions that support gaming workloads.
- Amazon Inc. contributes 10%, supported by its large USD investments in cloud infrastructure and global streaming capacity.
- Electronic Arts Inc. holds 7%, driven by its expanding digital distribution and cloud-ready game portfolio.
- Apple Inc. captures 8%, indicating increasing activity through service integration and device-based cloud gaming strategies.
- The remaining 4% is shared by other companies that continue to influence the market through niche solutions and regional offerings.
Cloud Gaming Statistics by User Adoption and Penetration Rate
(Reference: market.us)
- As of 2025, the adoption of cloud gaming is expected to rise by 455.4 million users, and the overall penetration rate is projected to reach 5.8%, indicating steady acceptance of streaming-based gaming services.
- The total number of cloud gaming users is expected to reach 482.3 million in 2026, followed by 493 million in 2027, reflecting a consistent upward trend in global demand.
- The penetration rate is estimated to increase to 6.1% in 2026 and 6.2% in 2027, suggesting improving availability of high-speed internet and broader platform accessibility.
- User satisfaction for Battle.net indicates 57% very satisfied, 23% somewhat satisfied, 15% neutral, 3% not satisfied, and 2% not at all satisfied, reflecting strong platform confidence.
- User responses for Slack show 38% very satisfied, 22% somewhat satisfied, 20% neutral, 8% not satisfied, and 12% not at all satisfied, indicating mixed perceptions from gaming and communication users.
- Satisfaction levels for Roblox show 47% very satisfied, 23% somewhat satisfied, 19% neutral, 8% not satisfied, and 3% not at all satisfied, driven by strong engagement among younger audiences.
- Feedback for Apple Arcade includes 55% very satisfied, 20% somewhat satisfied, 22% neutral, 3% not satisfied, and no recorded share for not at all satisfied, highlighting stable acceptance of curated gaming content.
- Reported satisfaction for Google Stadia shows 58% very satisfied, 29% somewhat satisfied, 7% neutral, 3% not satisfied, and 3% not at all satisfied, reflecting the influence of performance and service stability.
- Responses for Amazon Luna include 69% very satisfied, 23% somewhat satisfied, 4% neutral, 2% not satisfied, and 2% not at all satisfied, supported by strong integration with the Amazon ecosystem.
- Satisfaction for Discord indicates 46% very satisfied, 30% somewhat satisfied, 20% neutral, 2% not satisfied, and 2% not at all satisfied, showing its role as a core communication tool for gamers.
- User ratings for Steam show 43% very satisfied, 33% somewhat satisfied, 19% neutral, 3% not satisfied, and 2% not at all satisfied, supported by its extensive content library.
- Feedback for Xbox Live includes 46% very satisfied, 26% somewhat satisfied, 17% neutral, 4% not satisfied, and 7% not at all satisfied, reflecting performance expectations in console-based cloud gaming.
- Satisfaction for PlayStation Network (PSN) records 46% very satisfied, 26% somewhat satisfied, 18% neutral, 5% not satisfied, and 5% not at all satisfied, demonstrating consistent user engagement across Sony’s gaming ecosystem.
By User Satisfaction Analysis
| Platforms | Very Satisfied | Somewhat Satisfied | Neutral | Not satisfied | Not at all satisfied |
| Battle.net | 57% | 23% | 15% | 3% |
2% |
|
Slack |
38% | 22% | 20% | 85 | 12% |
| Roblox | 47% | 23% | 19% | 8% |
3% |
|
Apple Arcade |
55% | 20% | 22% | 3% | – |
| Google Stadia | 58% | 29% | 7% | 3% |
3% |
|
Amazon Luna |
69% | 23% | 4% | 2% | 2% |
| Discord | 46% | 30% | 205 | 2% |
2% |
|
Steam |
43% | 33% | 19% | 3% | 2% |
| Xbox Live | 46% | 26% | 17% | 4% |
7% |
|
PlayStation Network (PSN) |
46% | 26% | 18% | 5% |
5% |
By Gamer Type
(Reference: precedenceresearch.com)
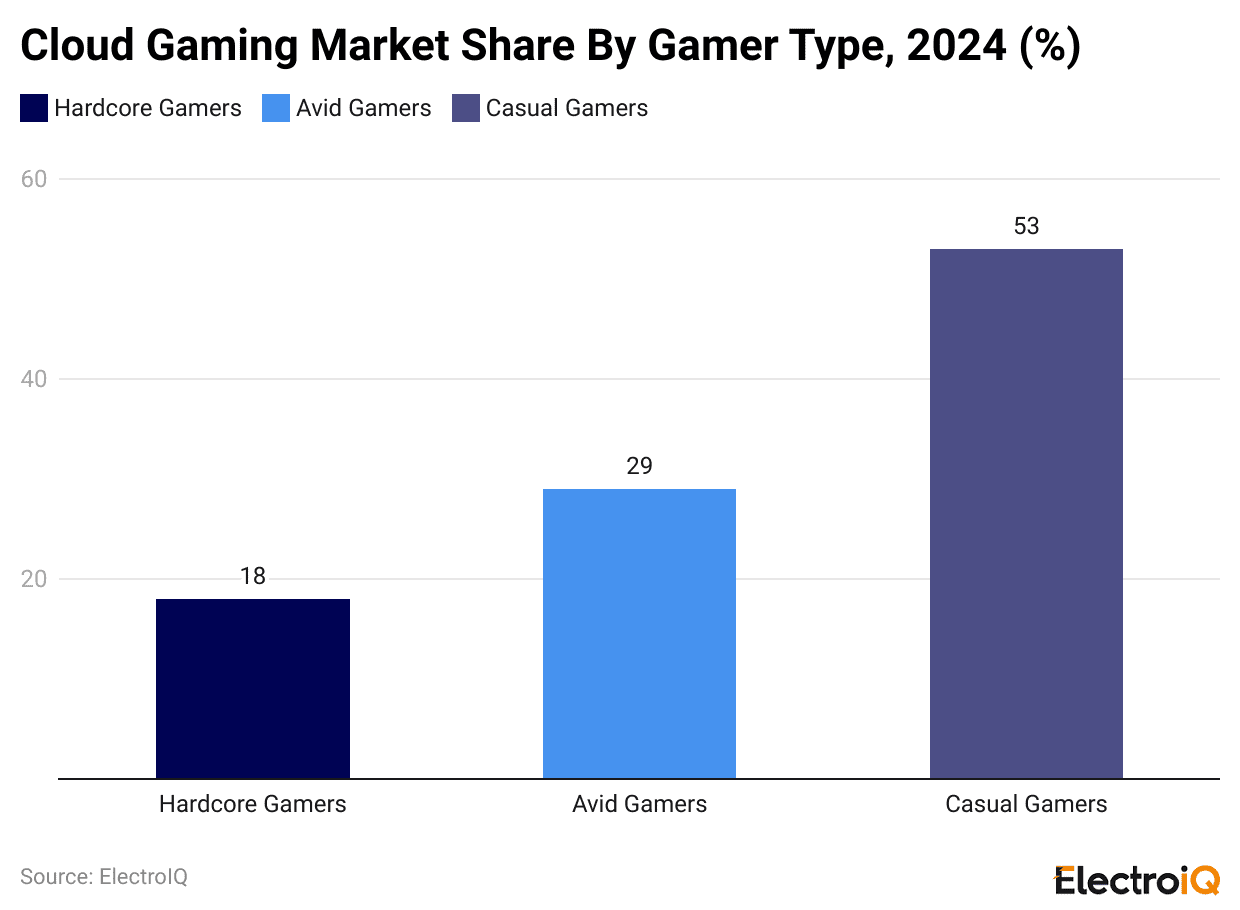
- In 2024, casual gamers held the highest share of the Cloud Gaming market at 53%.
- Others are followed by avid gamers (29%) and hardcore gamers (18%).
Top 5 Leading Cloud Gaming Platforms in 2025
| Platforms | Streaming Quality | Library/Access Model |
Approx. Monthly Price |
|
NVIDIA GeForce NOW (Ultimate) |
Up to 5K @ 120 FPS, up to 360 FPS at 1080p on RTX 5080-class GPUs | Stream more than 4,000 to 4,500 PC games you already own from Steam, Epic, etc. | USD 19.99/month Ultimate, USD 9.99/month Performance; USD 199.99/year option. |
| Xbox Game Pass Ultimate (Xbox Cloud Gaming) | Typically 1080p @ 60 FPS; select devices now support up to 1440p streaming | Cloud access to approximately 450+ titles in the Game Pass library (first-party + third-party). |
USD 29.99/month for Ultimate. |
|
PlayStation Plus Premium (Cloud Streaming) |
Up to 4K @ 60 FPS (PS5 titles), with lower caps for PS4/PS3 streams | Streams hundreds of games, incl. approximately 300+ classic titles (PS1 to PS5) via catalogue. | Around USD 18/month internationally; regionally also listed as ₹849/month for Deluxe/Premium tier. |
| Amazon Luna (Luna Premium) | Generally, 1080p @ 60 FPS on supported devices. | Subscription library of 100+ games, with extra channels (e.g., Ubisoft+) for more content. |
USD 9.99/month for Luna Premium; some access bundled with Amazon Prime |
|
Boosteroid |
Standard plan: 1080p @ 60 FPS; higher tiers offer up to 4K streaming | Bring your own games model using your existing PC store libraries; popular for global coverage. |
€9.89/month Standard (USD 10.50); annual drops to €7.49/month; Ultra/Ultra Pro from €14.89/month |
Cloud Gaming User Penetration Statistics by Region
In America
(Reference: market.us)
- In the Americas, cloud gaming use has shown varied adoption, with Canada recording 15%, the United States at 10.1%, Mexico at 4.2%, Chile at 3.9%, Argentina at 2.4%, and Brazil at 1.5%, indicating different levels of readiness for cloud-based gaming across the region.
- In Europe, Norway reported 22.7%, Ireland reached 22.2%, Finland stood at 21.4%, Sweden recorded 21%, the United Kingdom reached 11.6%, France marked 9.1%, Spain and Portugal each reported 7.9%, Greece reached 4%, Poland recorded 3.2%, Romania and Latvia each reached 2.9%, Russia marked 2.6%, and Ukraine reported 0.9%, which reflects a clear concentration of higher penetration in Northern Europe.
- In Asia Pacific, the Middle East, and Oceania, Australia recorded 18%, Japan reached 11.6%, China marked 9.9%, Saudi Arabia reported 2.6%, Morocco reached 2.5%, and India stood at 1.2%, showing that adoption levels vary based on digital infrastructure and cloud service availability across these markets.
Furthermore, other regional Cloud Gaming User Penetration is mentioned in the table below:
| Europe | Asia Pacific, the Middle East, and Oceania |
|
|
Cloud Gaming Usage Frequency Statistics
(Source: cloudbase.gg)
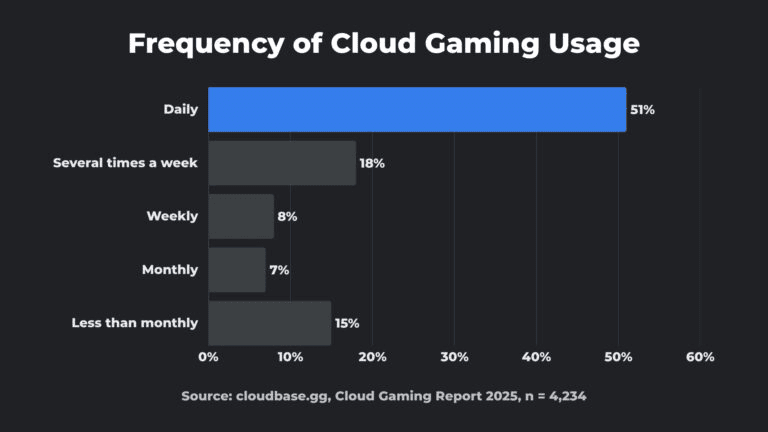
- As of 2025, about 51% of cloud gaming users play every day, 18% several times a week, and 8% about once a week.
- Only 7% are supposed to play monthly, and 15% less than once a month.
Cloud Gaming Statistics by Preferred Devices
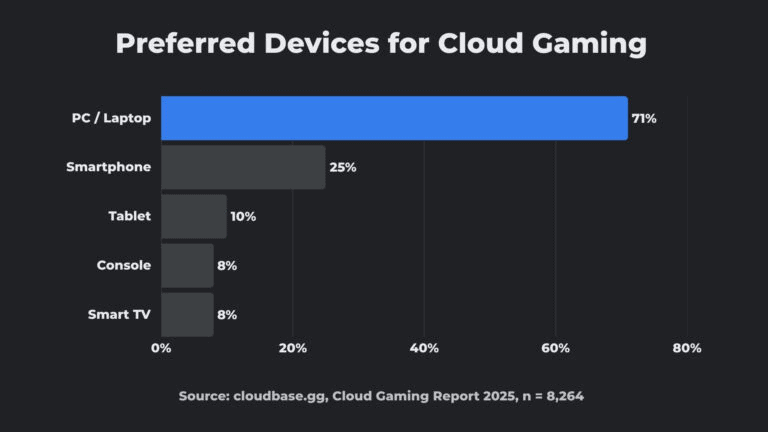
(Source: cloudbase.gg)
- In 2025, most cloud gamers prefer to play on a PC or laptop, with 71% choosing this option.
- Meanwhile, Smartphones are used by 25% of players, tablets by 10%, and both consoles and smart TVs by 8%.
By Users Spending Breakdown
- Cloud Gaming Statistics further states that in 2025, almost 33% of paying cloud gaming users spend less than USD 10 per month, while the largest group, 40%, spends between USD 10 and USD 20.
- Moreover, 12% of users will spend between USD 20 and USD 30, and 14% will pay over USD 30 each month.
Popular Cloud Gaming Platforms
NVIDIA GeForce NOW Statistics
- During the beta phase, NVIDIA GeForce NOW had about 300,000 active users while roughly 1 million additional players were on the waiting list, showing strong early demand for the service.
- After its commercial launch, GeForce NOW passed 1 million registered users in February 2020, indicating rapid initial adoption.
- By April 2021, the platform had reached about 10 million subscribers, reflecting a tenfold increase in a little more than one year.
- As of August 2022, NVIDIA GeForce NOW had grown further to about 20 million subscribers, effectively doubling its user base in roughly sixteen months.
- Overall, GeForce NOW is reported to have more than 25 million registered users globally, confirming its position among the largest cloud gaming services.
- NVIDIA’s own usage data show that in 2020 players streamed more than 175 million hours on GeForce NOW, including about 100 million hours in multiplayer titles and around 16 million hours in indie games.
- In the same year, users streamed the night city of Cyberpunk 2077 with ray tracing enabled for about 4 million hours, and captured roughly 130 million gaming highlights using Nvidia Highlights on GeForce NOW.
- During 2020, the service added around 800 titles to its catalog, including about 80 free to play games, with Fortnite ranked as the leading free game on the platform.
- NVIDIA indicates that GeForce NOW now supports over 4,000 titles overall, including more than 2,000 streamable “Ready to Play” games and at least 2,200 additional Steam games accessible through its Install to Play feature.
- A recent review notes that before the latest upgrade, the highest performance tier in GeForce NOW was comparable to a system running a local RTX 3080 GPU, and that select premium tiers now deliver “RTX 4080-level” or higher performance in the cloud.
- With the RTX 4080 based Ultimate tier, GeForce NOW can stream games at up to 4K resolution and 120 frames per second, while supporting up to 240 frames per second at 1080p on supported displays.
- The newer RTX 5080 Ultimate upgrade enables streaming at 1080p with up to 360 frames per second and at 1440p with up to 240 frames per second, with measured end to end latency in one test of about 28 milliseconds for a 1440p stream.
- In Cinematic mode, the RTX 5080 tier is optimized for 4K streaming at 60 frames per second and uses 4:4:4 color sampling to improve visual quality compared with the typical 4:2:0 sampling used in standard streams.
- According to NVIDIA’s system requirements, a minimum connection of 15 Mbps is recommended for 720p at 60 frames per second, 25 Mbps for 1080p at 60 frames per second, 35 Mbps for 1440p at 120 frames per second and 45 Mbps for 4K at 120 frames per second, with network latency to an NVIDIA data center kept below 80 milliseconds.
- The same guidance indicates that a GeForce NOW Premium membership is required to unlock 5K and 4K streaming resolutions, NVIDIA RTX effects, HDR, Cloud G Sync and higher frame rate modes up to 360 frames per second on supported devices.
- Pricing information from recent reviews shows that the Performance tier is commonly offered at about USD 10 per month, while the Ultimate tier is positioned around USD 20 per month, alongside a free basic tier with more limited features.
- Earlier reports highlight that subscribers paying roughly USD 19.99 per month for the high end plan received the upgraded RTX 4080 level hardware without an additional fee when that tier launched.
- NVIDIA’s Install to Play model gives Performance and Ultimate users about 100 GB of single session storage for installing large titles, and offers optional persistent storage at 200 GB, 500 GB and 1 TB levels priced at about USD 3, USD 5 and USD 8 per month respectively.
- A newer GeForce NOW Fast Pass for Chromebooks allows users to stream more than 2,000 Ready to Play games, with access limited to 10 hours of cloud gaming per month and up to 5 unused hours rolling over to the following month.
Xbox Cloud Gaming Statistics
- Xbox Cloud Gaming recorded 710,000 subscribers in 2019, and this base increased to 2 million in the second quarter of 2020, reflecting significant early adoption.
- The platform achieved a 91% higher growth rate than Google Stadia Pro during this period, highlighting its competitive advantage.
- Subscriber numbers continued to grow, reaching 4.4 million in the fourth quarter of 2020, which was 87% higher than the combined total of Google Stadia Pro, Facebook Gaming, and Amazon Luna.
- By April 2020, Xbox Cloud Gaming reported 10 million subscribers, and this increased to 15 million by September 2020, showing strong user expansion within a short timeframe.
- The subscriber count climbed to 18 million in January 2021, reflecting continued momentum driven by service improvements and ecosystem integration.
- In the second quarter of 2021, the platform reached 7.5 million subscribers when measured within specific reporting periods, representing a 68% lead over the combined counts of Google Stadia Pro, Facebook Gaming, and Amazon Luna.
- By the end of 2021, Xbox Cloud Gaming had 13.2 million subscribers, maintaining a 55% advantage over leading competitors combined.
- In January 2022, subscriber volume rose to 25 million, marking a key milestone for the service’s global reach.
- Xbox Cloud Gaming generated revenue above USD 450 million in 2021, although PS Now remained the highest earning cloud gaming service that year.
- Industry forecasts indicate strong market expansion, with cloud gaming revenue expected to rise from USD 400 million to USD 1.05 billion, representing growth of 300%.
- By 2026, Xbox Cloud Gaming is expected to become the world’s largest cloud gaming platform based on sustained user growth and broader service penetration.
Amazon Luna Statistics
- Amazon Luna entered early access in October 2020 and reached full public launch in the United States in March 2022, making it a relatively recent but established cloud gaming platform.
- Across all channels, Amazon Luna now offers a catalog of more than 300 cloud games, while the core Luna+ subscription typically provides access to 100+ titles.
- As of 2025, Amazon Luna is available in 14 countries across North America and Europe, including the United States, Canada, Germany, France, the United Kingdom, Spain, Italy, the Netherlands, Poland, Austria, Belgium, Portugal, Sweden, and Luxembourg.
- Third-party estimates indicate that Amazon Luna had around 270,000 active users in 2021, and that its share of the global cloud gaming market in 2022 was in the 0–5% range.
- Earlier tracking showed that Luna offered about 227 playable games around 2022, with the library expanding toward and beyond the 300-title mark by 2025 as new content deals were added.
- For Prime members, the latest redesign brings a cloud library of more than 50 games at no additional cost, alongside GameNight, which alone contributes over 25 local multiplayer and party games.
- Historically, founder pricing set Luna+ at USD 5.99 per month, but current offers position Luna+ around USD 9.99–10 per month in major markets, while add-on channels such as Family, Retro, Jackbox, and Ubisoft+ have been priced in the range of USD 4.99 to USD 17.99 per month.
- Official network guidance indicates that Amazon Luna recommends at least 10 Mbps for 1080p streaming and around 35 Mbps for planned 4K support, with a lower tier at 5 Mbps for 720p play.
- Data-usage testing shows that streaming at 1080p on Luna can consume about 10 GB of data per hour, while switching to 720p reduces this to roughly 5 GB per hour, which is significant for users with monthly data caps.
- The platform supports at least 6 major device families, including Windows PCs, macOS, ChromeOS, Fire TV devices, Fire tablets, Samsung and LG smart TVs and monitors, and mobile devices via web apps on iOS, iPadOS, and Android.
PlayStation Plus Premium Statistics
- As of March 2023, PlayStation Plus had 47.4 million subscribers, of which about 8 million users were on the PlayStation Plus Premium tier, representing 17% of the total subscriber base.
- In the same period, Premium and Extra together accounted for 14.1 million users, meaning roughly 30% of PlayStation Plus subscribers had already upgraded to higher tiers.
- Sony reported that in fiscal year 2024, the share of subscribers on higher tiers continued to rise, with about 22% of PlayStation Plus users on Premium and 16% on Extra, indicating that nearly 38% of the base was using expanded catalog and streaming benefits.
- In the quarter ending September 2025, PlayStation Plus monthly active users increased from 116 million to 119 million, showing that the service remains deeply integrated with the wider PlayStation ecosystem where Premium is the top tier.
- As of December 2024, PlayStation Network overall recorded about 129 million monthly active users, which suggests that roughly 9 in 10 PSN users are also active within the PlayStation Plus environment across Essential, Extra, and Premium tiers.
- At launch of the new three tier model in 2022, Sony communicated that PlayStation Plus Extra and Premium together would provide access to 700+ titles across the Game Catalog and Classics Catalog, positioning Premium as the most content rich option.
- By late 2025, the official PlayStation Plus game finder was listing around 615 catalogued titles across Game Catalog and Classics Catalog, indicating that hundreds of those games remain fully accessible to Premium users at any given time, even as titles rotate.
- The Classics Catalog, which is exclusive to Premium in streaming enabled regions, has been reported to include 400+ classic games across platforms such as PS1, PS2, PSP, and PS3, providing one of the largest retro libraries available in a console subscription.
- A 12 month PlayStation Plus Premium subscription in Europe is officially priced around EUR 151.99, while public pricing data for 2025 indicates a typical North American monthly Premium fee around USD 17.99, compared with about USD 9.99 for the Essential tier.
- For cloud streaming, Sony specifies a minimum broadband requirement of 5 Mbps upload and download to start a session, with recommended bandwidth of about 52 Mbps for 4K streaming, 38 Mbps for 1440p, 23 Mbps for 1080p, and 13 Mbps for 720p, which defines the technical entry point for Premium streaming quality.
- When PS5 cloud streaming for Premium launched, Sony stated that “hundreds” of PS5 titles would support streaming, including major releases, and that these would run at up to 4K resolution with 60 FPS, multi channel surround sound, and Tempest 3D audio, aligning Premium with high end console performance delivered from the cloud.
- By November 2025, Sony confirmed that Premium members could stream “thousands” of PS5 titles on devices such as PlayStation Portal and PS5, with reports indicating a library of over 2,000 cloud streamable games when combining owned titles with the Game Catalog and Classics Catalog.
- Recent monthly updates show that Extra and Premium tiers continue to receive new content, with examples such as 9 new Game Catalog titles added in November 2025, plus at least 1 exclusive classic each month reserved for Premium, which underlines a steady refresh cycle for high value users.
- Internal Sony data shared in 2023 identified PlayStation Plus Premium as more popular than the mid tier Extra, with Premium holding about 8 million members compared with 6.1 million for Extra, which signals that a significant part of the subscriber base is willing to pay for cloud streaming, trials, and classics access.
Google Stadia Statistics
- Google Stadia launched on 19 November 2019 and was discontinued on 18 January 2023, giving it an active life of a little over 3 years as a commercial cloud gaming service.
- At launch, Stadia was available in 14 countries, including the US, UK, Canada, Germany and other European markets, before later expansions.
- The service launched with 22 games and added 4 more titles in December 2019. By the end of 2020, the catalog exceeded 130 games.
- Over the calendar year 2021, Google added more than 100 new games to Stadia, and by the time of shutdown in January 2023 the platform listed 280 titles, including 5 Stadia-exclusive games.
- Google Stadia was reported to “boast” a library of more than 100 games during its growth phase, before the catalog expanded to several hundred titles.
- During the first quarter of 2021, Stadia recorded over 3 million mobile app downloads; Sensor Tower later estimated about 3.2 million downloads across Android and iOS in total.
- Of these mobile downloads, about 1.6 million were from the United States, around 380,000 from the United Kingdom, and roughly 262,000 from Germany, while approximately 73% of all downloads occurred on Android devices.
- As of October 2021, the Stadia app had received more than 180,000 reviews on Google Play, with an average rating of about 4.1 stars, indicating moderate user satisfaction.
- In the first quarter of 2021, Google Stadia was estimated to account for 8.69% of installations among game-streaming services, reflecting a mid-tier share within the cloud gaming ecosystem.
- Stadia Pro subscribers could stream games at up to 4K resolution and 60 frames per second with HDR and 5.1 surround sound, while the free tier was limited to 1080p at 60 frames per second with stereo audio.
- Google specified internet speed requirements of 10 Mbit/s for 720p streaming, 20 Mbit/s for 1080p HDR with 5.1 surround sound, and 35 Mbit/s for 4K HDR streaming with 5.1 surround sound.
- In October 2020, Stadia’s data consumption was reported in the range of roughly 7 GB to 20 GB per hour, depending on the resolution selected by the user.
- As of September 2021, Stadia supported more than 30 device types, including Chromecast, Android TV, Chrome browser on PC, Chromebooks, and compatible Android smartphones.
- Measured latency for Stadia could reach a maximum of around 188 ms, compared with about 40 ms typical latency on local hardware, which illustrates the network-related delay inherent in cloud gaming.
- Based on a 2020 survey, approximately 16.1% of Stadia users identified as female, providing an indication of gender distribution within the user base.
- Stadia offered two main consumer price tiers: a free “Base” tier at USD 0 per month and the Pro subscription at about USD 9.99 per month, which unlocked higher resolution streaming and a rotating catalog of claimable games.
- At the hardware level in Google’s data centers, Stadia instances used a custom x86 processor clocked at 2.7 GHz, paired with a custom AMD GPU rated at 10.7 teraflops, 56 compute units, and 16 GB of shared RAM supporting bandwidth up to 484 GB/s.
- The original “Founder’s Edition” and “Premiere Edition” bundles were both priced at around USD 129, including a Stadia controller and a Chromecast Ultra, together with limited periods of Stadia Pro access.
- When Google announced Stadia’s closure in September 2022, it committed to refunding 100% of hardware purchases made through the Google Store and all game and add-on content bought on the Stadia store, with most refunds targeted for completion by mid-January 2023.
Key Insights of Cloud Gaming Statistics
- According to gg, around 47% of gamers in 2025 reported playing all their games in the cloud.
- Approximately 51% use cloud gaming every day, and over three-quarters play this way at least once a week.
- Additionally, 71% connect via PC or laptop, while 25% prefer smartphones.
- 73% of paying users spend less than USD 20 per month on cloud gaming.
- 58% say free trials are more important than price or game library size.
- As of 2025, around 29% of players consider themselves hardcore cloud gamers, while a larger 41% identify as casual cloud gamers.
Conclusion
Current analysis indicates that the cloud gaming market is growing rapidly, as more people are using it, companies are earning more money, and investors are investing heavily. Faster internet, cheaper data plans, and stronger cloud systems make game streaming smoother and more reliable.
However, there are still problems, such as slow response times (latency) and weak internet connections in villages or remote areas. In general, the data indicates that cloud gaming will not replace regular console or PC gaming soon, but it will stand beside them as a major way to play.