BigCommerce Statistics By Market Share And Trends (2025)
Updated · Sep 15, 2025

Table of Contents
- Introduction
- Editor’s Choice
- BigCommerce Market Revenue Statistics
- BigCommerce Daily Order Volume Statistics
- Sales Performance of BigCommerce Statistics
- User Demographics of BigCommerce Statistics
- Active Stores of BigCommerce Statistics by Quarter
- BigCommerce Store Statistics By Top Country
- By Top Categories
- By Employees
- BigCommerce Usage Statistics in Top Industries
- In Top Countries
- Company Size Breakdown of BigCommerce Users Statistics, 2025
- Company Revenue Breakdown of BigCommerce Users, 2025
- BigCommerce Stores Statistics by Top Companies
- By Top Shipment Carriers
- By Top-level Domain
- Social Media Trends Among BigCommerce Merchants
- Contact Information Available on BigCommerce Stores
- Product Listings Across BigCommerce Stores
- Stores Switching to BigCommerce Statistics From Other Platforms
- To Other Platform
- BigCommerce Website Traffic Statistics
- By Country
- By User Demographics
- By Marketing Channels Distribution
- By Social Media
- By Device
- Conclusion
Introduction
BigCommerce Statistics: BigCommerce Inc., listed on NASDAQ, is an e-commerce platform offering software-as-a-service solutions for retailers. Founded in 2009 in Sydney, Australia, by Eddie Machaalani and Mitchell Harper, who first connected in an online chatroom in 2003, and now has its headquarters in Austin, Texas, USA. The platform helps all sizes of businesses to create online stores, improve SEO, host websites, run marketing campaigns, secure data, accept payments, manage multiple currencies, and handle online or mobile sales easily.
This article explores the latest BigCommerce statistics, trends, and market developments, offering a clear view of its growth and role in the e-commerce industry in recent years and the future.
Editor’s Choice
- BigCommerce.com’s report analysis stated that BigCommerce generated USD 82.4 million in total revenue in the first quarter of 2025.
- As of March 31, 2025, enterprise accounts, which include customers with at least one large-scale plan, contributed USD 263.8 million to the ARR (Annual Recurring Revenue).
- Red Stag Fulfilment report also shows that the BigCommerce platform handled an estimated 110,000 to 125,000 orders every day in 2024.
- A 2025 report by Coalition Technologies found that BigCommerce merchants have an average order value of USD 137.
- More than half of BigCommerce merchants are under 44 years old.
- In 2025, the number of active stores in BigCommerce decreased accordingly, as it recorded around 42,033 in the first quarter.
- As per the Store Lead App report analysis in August 2025, the majority of BigCommerce stores, 67.4%, are located in the United States, totaling 27,566 stores.
- The largest number of stores is available in Home & Garden with 6,869, followed by Apparel at 5,691, and Autos & Vehicles have 3,161 stores.
- An analysis of BigCommerce customers by industry shows that in 2025, the platform is most widely used in the Retail sector, which accounts for 18% of its customer base, resulting in 7,386.
- As of 2025, Cloudflare is the most popular third-party tool, used by 93.3% of BigCommerce stores (38,186), boosting security and performance.
- Around 68% of BigCommerce websites display a phone number, totalling 27,657 stores, in 2025.
- According to Similarweb, as of July 2025, the total number of visits to bigcommerce.com accounted for 4.8 million, representing a 5.86% increase from the previous month.
BigCommerce Market Revenue Statistics
- investors.bigcommerce.com report analysis stated that BigCommerce generated USD 82.4 million in total revenue in the first quarter of 2025.
- The company’s annual revenue run-rate reached USD 350.8 million at the end of March 2025.
- Moreover, revenue from subscription services grew slightly to USD 62.1 million.
- As of March 31, 2025, enterprise accounts, which include customers with at least one large-scale plan, contributed USD 263.8 million to the ARR (Annual Recurring Revenue).
- At the same time, enterprise clients accounted for 75% of the total ARR, up from 73% last year.
- The GAAP gross margin has increased to 79% and the non-GAAP margin at 80%, both higher than the first quarter of the previous year.
Furthermore, other financial metrics of BigCommerce in Q1 2025 are stated in the table below:
| Metrics | Valuation |
| Enterprise Accounts |
5,825 |
|
ARPA |
USD 45,290 |
| GAAP Loss from Operations |
USD 2.4 million |
|
Non-GAAP Operating Income |
USD 7.6 million |
| GAAP Net Loss |
USD 0.4 million |
|
Non-GAAP Net Income |
USD 5.7 million |
| Non-GAAP Basic Net Income per Share |
USD 0.07 |
|
Adjusted EBITDA |
USD 8.8 million |
| Cash & Equivalents |
USD 121.9 million |
|
Net Cash from Operations |
USD 0.4 million |
| Free Cash Flow |
USD 2.9 million |
BigCommerce Daily Order Volume Statistics
 (Source: redstagfulfillment.com)
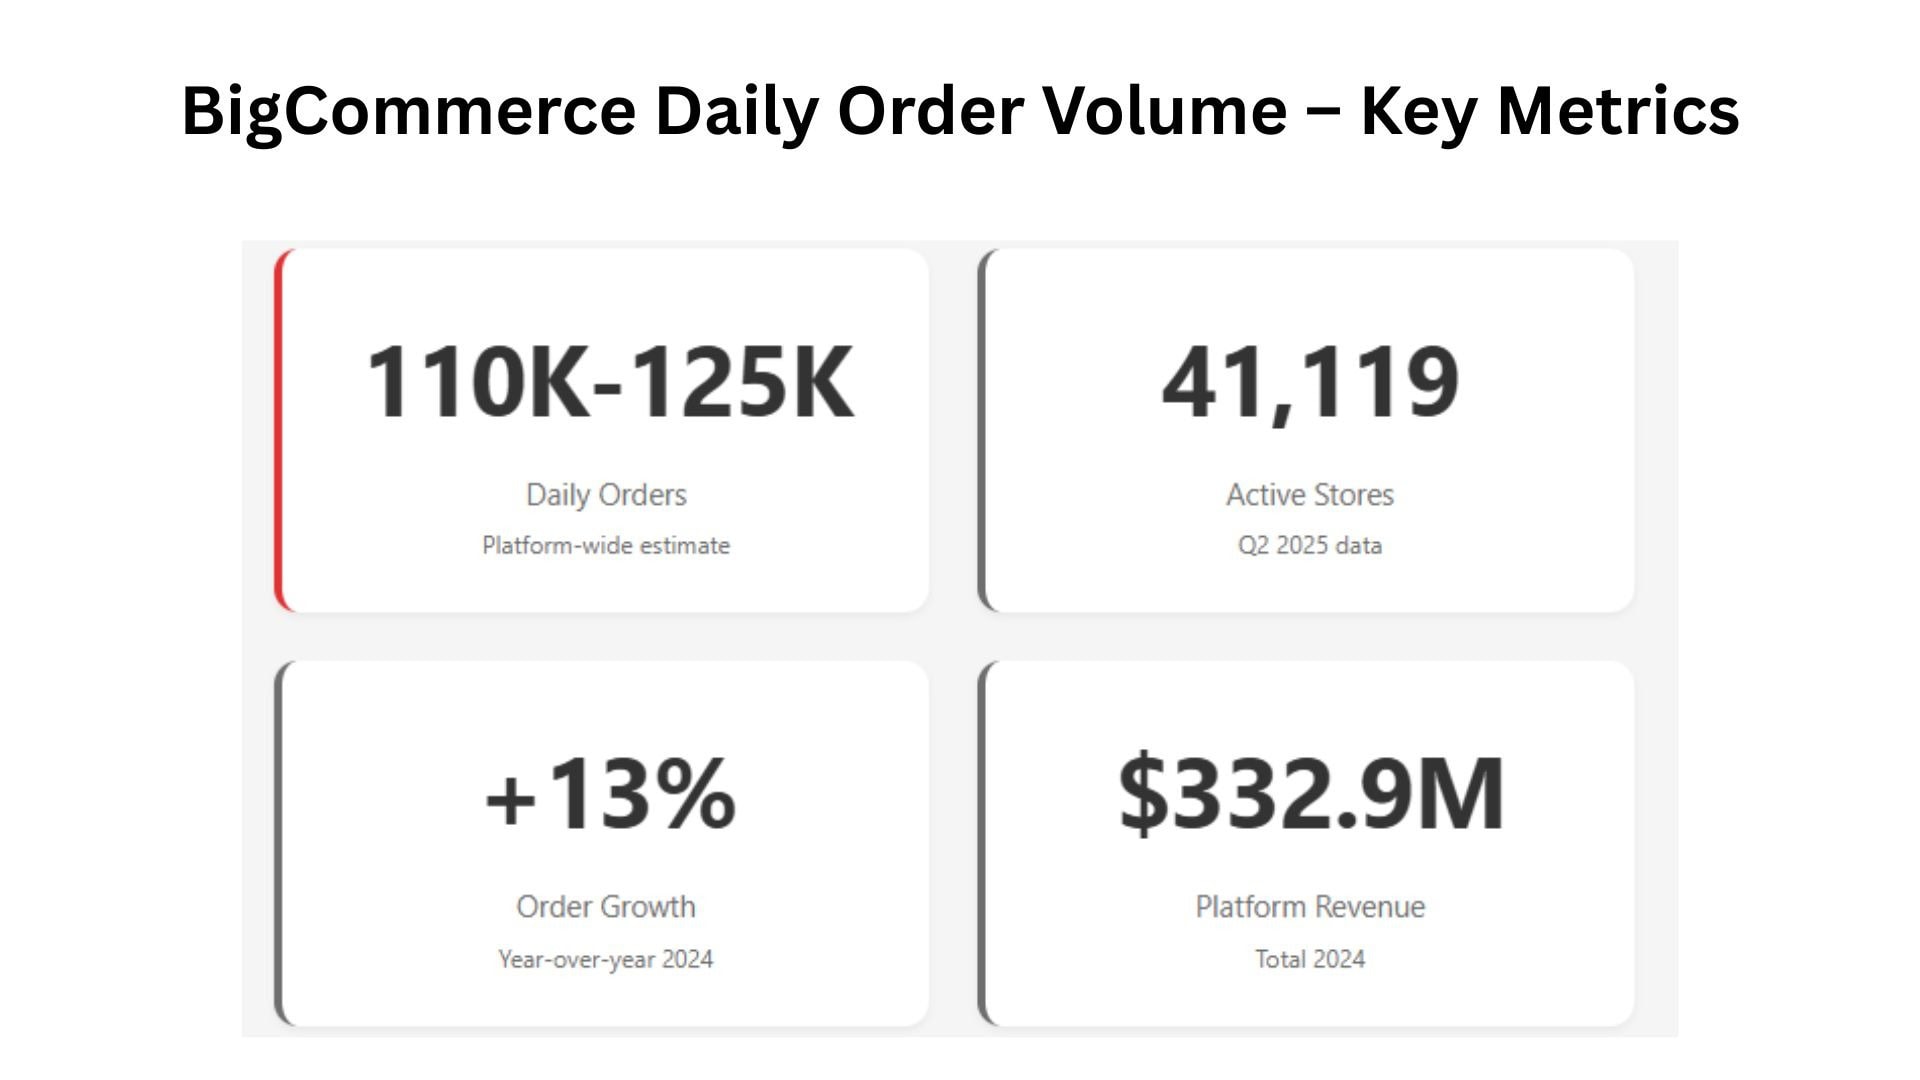
- Red Stag Fulfilment report also shows that the BigCommerce platform handled an estimated 110,000 to 125,000 orders every day in 2024.
- Over 130,000 merchants are using BigCommerce worldwide.
- As of the second quarter of 2025, 41,119 stores were actively live on the platform.
- Orders grew by 13% compared to the previous year in 2024.
- The platform generated USD 332.9 million in total revenue during 2024.
- During Cyber Week 2024, the gross merchandise value (GMV) rose by 26%.
- The average order value went up by 11% during the 2024 peak season.
Sales Performance of BigCommerce Statistics
- A 2025 report by Coalition Technologies found that BigCommerce merchants have an average order value of USD 137.
- Their 2.5% conversion rate is higher than the usual e‑commerce rates, which are typically between 1% and 2%.
- Most of BigCommerce’s Gross Merchandise Value (GMV) comes from five countries: the United States (44%), the United Kingdom (12%), Australia (8%), Canada (6%), and Germany (4%).
User Demographics of BigCommerce Statistics
- As of 2025, more than half of BigCommerce merchants are under 44 years old.
- Most merchants, around 62%, are aged between 25 and 44.
- The gender split is fairly even, with 55% male and 45% female.
- BigCommerce is mainly used by small businesses, with 55% having fewer than ten employees.
- In terms of location, about 44% of merchants are in North America, while 26% are in Europe.
Active Stores of BigCommerce Statistics by Quarter
 (Reference: storeleads.app)
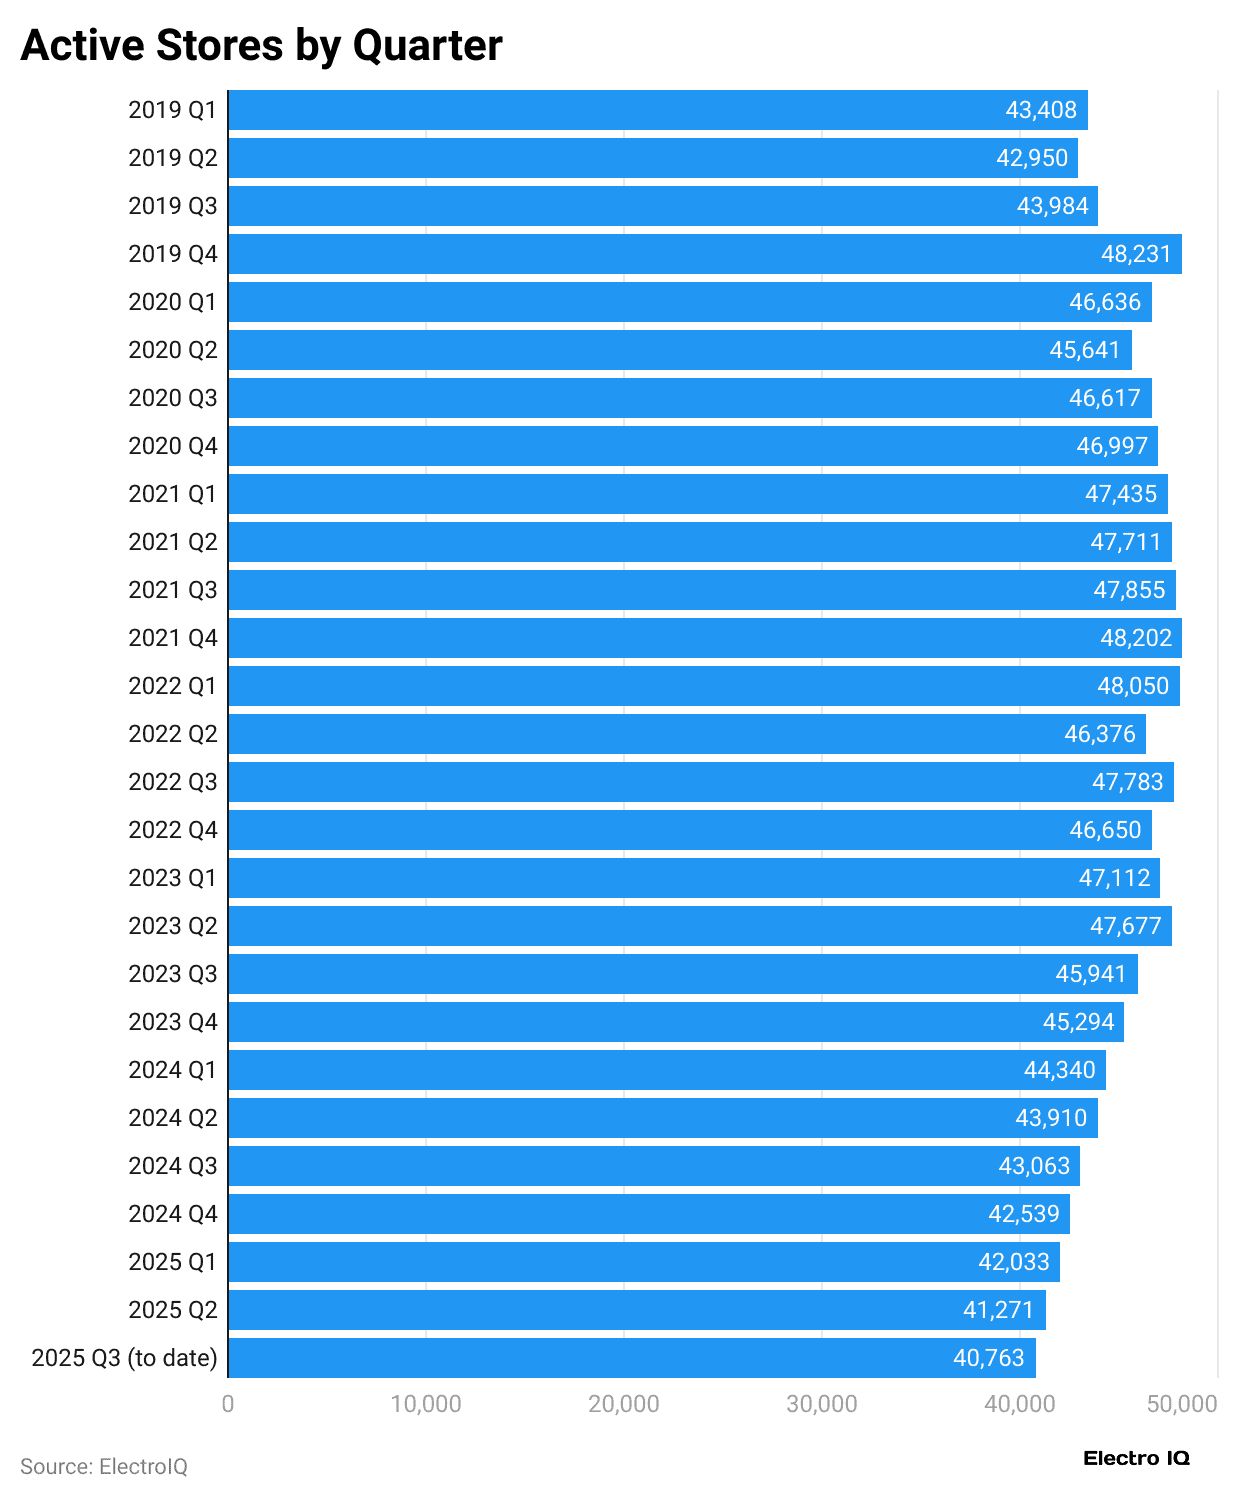
- In 2025, the number of active stores in BigCommerce decreased accordingly, as it recorded at around 42,033 in the first quarter and decreased to 41,271 in Q2 of this year.
- Besides, in the third quarter of 2025, the total number of stores also declined to 40,929.
In contrast, the previous year’s quarterly active stores are mentioned below:
| Year | Q4 | Q3 | Q2 | Q1 |
| 2024 | 42,539 | 43,063 | 43,910 | 44,340 |
| 2023 | 45,294 | 45,941 | 47,677 | 47,112 |
| 2022 | 46,650 | 47,783 | 46,376 | 48,050 |
| 2021 | 48,202 | 47,855 | 47,711 | 47,435 |
| 2020 | 46,997 | 46,617 | 45,641 | 46,636 |
| 2019 | 48,231 | 43,984 | 42,950 | 43,408 |
BigCommerce Store Statistics By Top Country
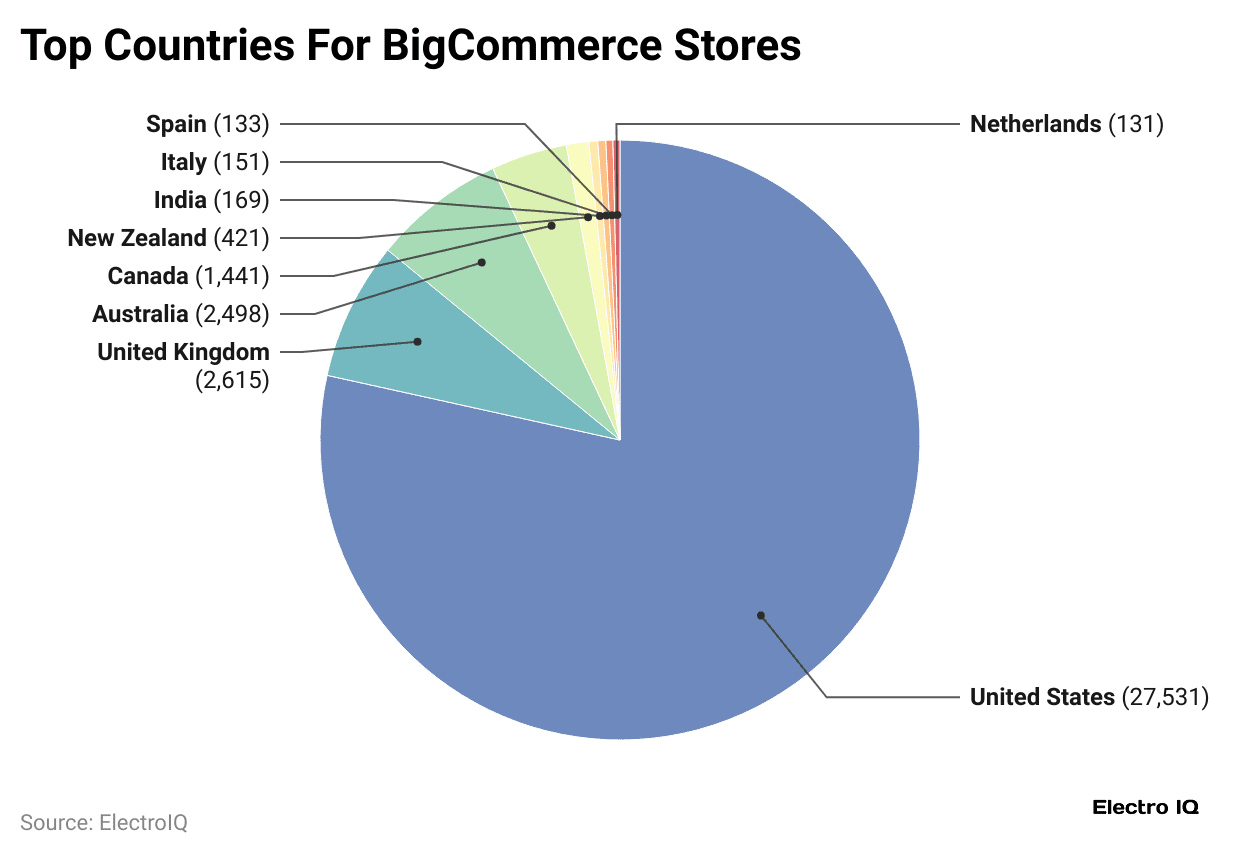
- As of August 2025, the majority of BigCommerce stores, 67.4%, are located in the United States, totalling 27,566 stores.
- The United Kingdom hosts 6.4% with 2,627 stores, while Australia accounts for 6.1% with 2,515 stores, and Canada represents 3.5% of stores, numbering 1,445.
- Furthermore, the number of stores in other countries is New Zealand (423), India (170), Italy (152), Spain (136), and the Netherlands (134).
By Top Categories
 (Reference: storeleads.app)
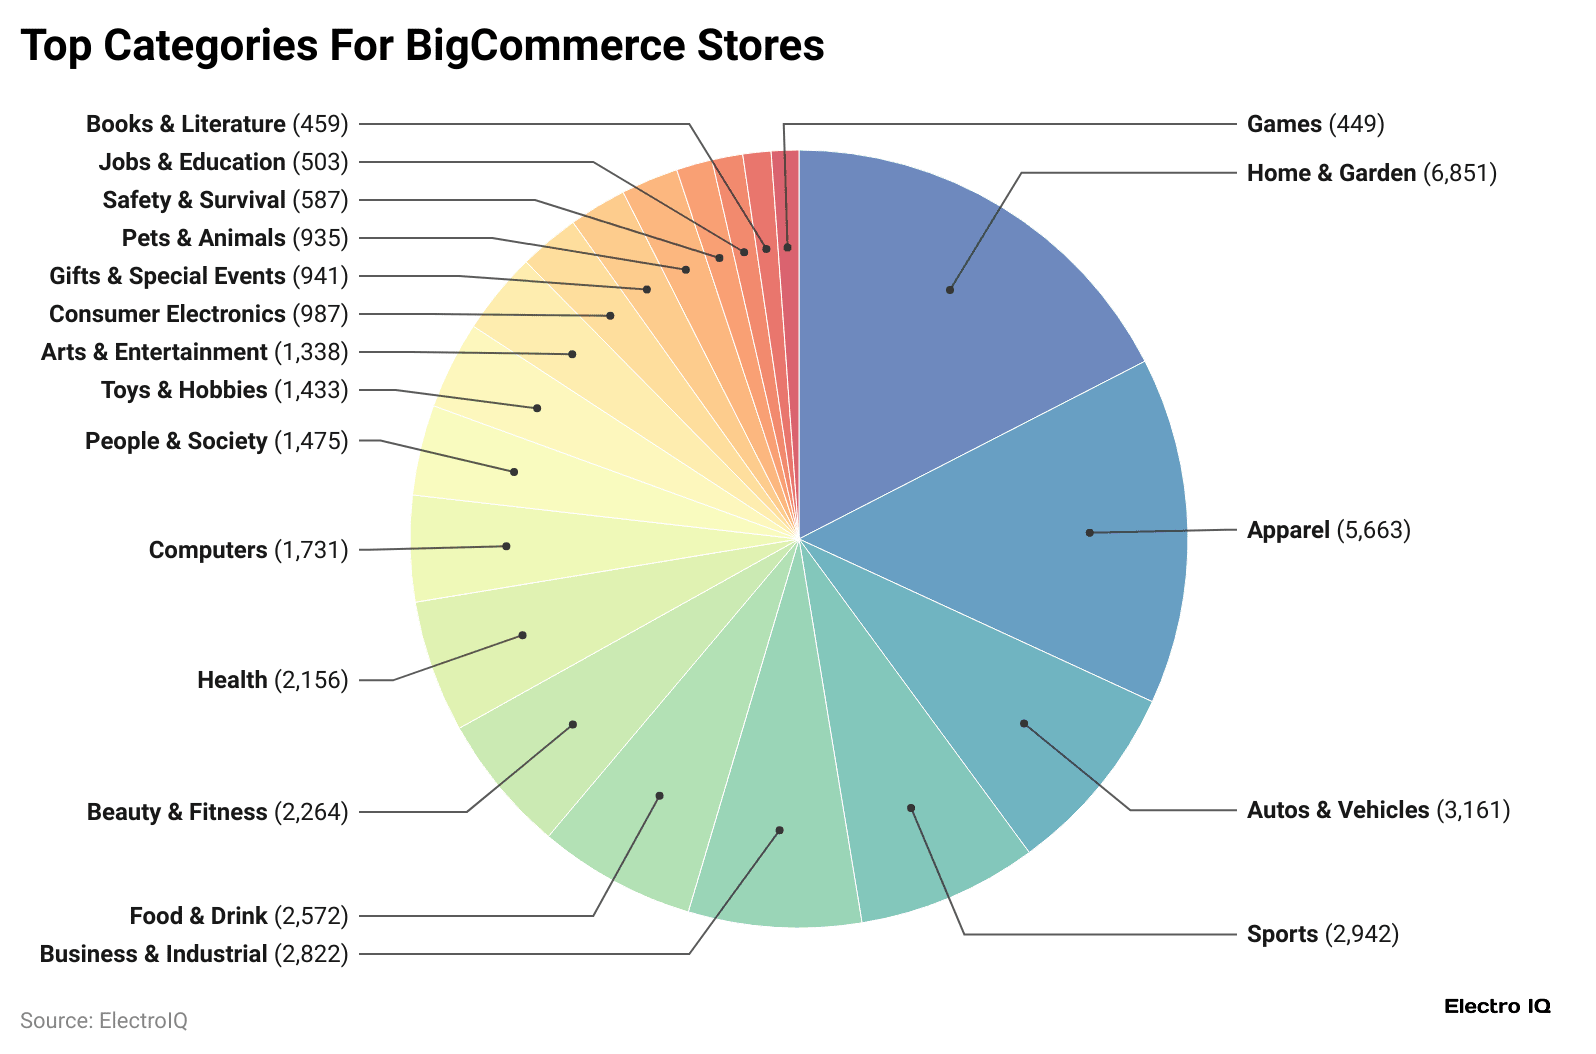
- As of 2025, in BigCommerce, the largest number of stores is available in Home & Garden with 6,869, followed by Apparel at 5,691, and Autos & Vehicles have 3,161 stores.
- Sports includes 2,955 stores, Business & Industrial accounts for 2,833 stores, while Food & Drink has 2,582.
- Other categories include Beauty & Fitness (2,268), Health (2,156), Computers (1,738), People & Society (1,479), Toys & Hobbies (1,436), Arts & Entertainment (1,346), Consumer Electronics (986), Gifts & Special Events (949), Pets & Animals (938), Safety & Survival (588), Jobs & Education (508), Books & Literature (459), and Games with 451 stores.
By Employees
- As per a report of StoreLeads.app, most BigCommerce stores do not disclose their employee numbers, accounting for 85.1% (34,839 stores), as of August 2025.
- Small teams of 1 to 9 people make up 7.7% (3,146 stores), while 10 to 24 employees are present in 2.7% (1,111 stores).
- Other ranges include 25 to 49 employees (513 stores), 50 to 99 (398 stores), 100 to 249 (440 stores), 250 to 999 (259 stores), 1,000 to 4,999 (139 stores), and over 5,000 employees in 84 stores.
BigCommerce Usage Statistics in Top Industries
 (Reference: enlyft.com)
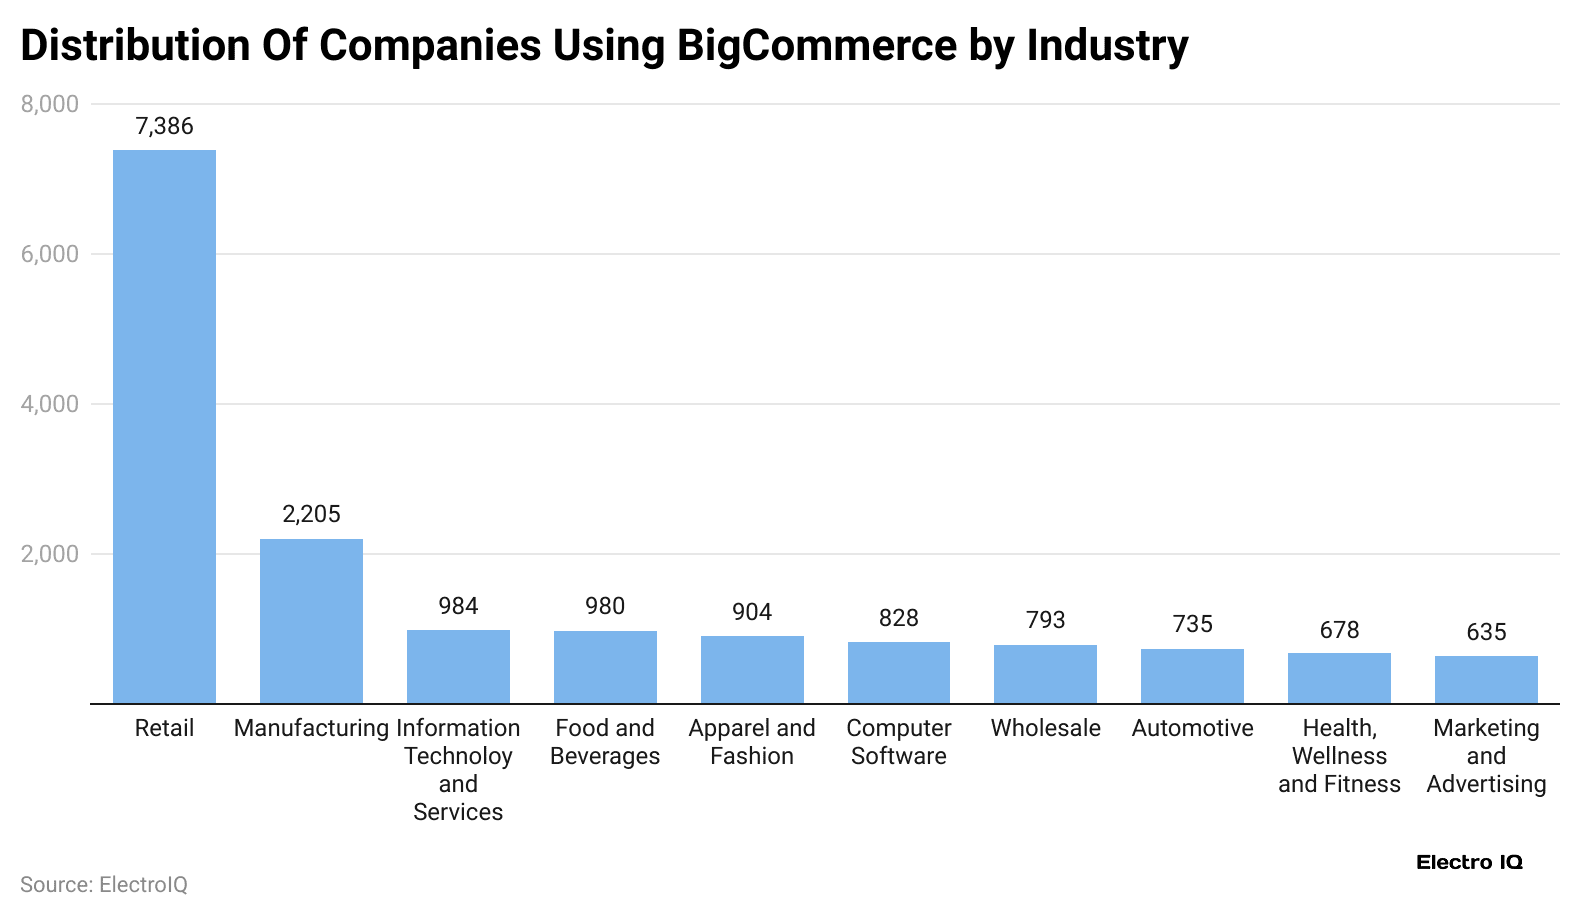
- An analysis of BigCommerce customers by industry shows that in 2025, the platform is most widely used in the Retail sector, which accounts for 18% of its customer base, resulting in 7,386.
- Manufacturing follows as the second-largest segment, representing 6% of users (2,205).
- Other industries using BigCommerce by number of users include Information Technology and Services (984), Food and Beverage (980), Apparel and Fashion (904), Computer Software (828), Wholesale, Automotive (793), Health, Wellness and Fitness (735), and Marketing and Advertising (635).
In Top Countries
- According to enlyft.com, the majority of BigCommerce users are based in the United States, accounting for 67% of the platform’s customer base, with 27,542 companies using the service.
- The United Kingdom and Australia each host 6% of BigCommerce users, with 2,648 companies in both countries.
- Other notable countries include Canada with 1,518 companies, followed by India with 485, Brazil with 380, and New Zealand with 365. Smaller markets include Ireland (150), the Netherlands (116), and Hong Kong (113) companies using BigCommerce.
Company Size Breakdown of BigCommerce Users Statistics, 2025
| Number of Companies using BigCommerce | Employee Count |
| 17,309 | 1-10 |
| 8,498 | 10-50 |
| 2,970 | 50-200 |
| 596 | 200-500 |
| 287 | 500-1000 |
| 303 | 1000-5000 |
| 63 | 5000-10,000 |
| 202 | >10,000 |
Company Revenue Breakdown of BigCommerce Users, 2025
| Number of Companies using BigCommerce | Revenue (USD million) |
| 14,122 | 1 to 10 |
| 5,855 | 0 to 1 |
| 3,654 | 10 to 50 |
| 570 | 50 to 100 |
| 352 | 200 to 1,000 |
| 288 | 100 to 200 |
| 271 | >1,000 |
BigCommerce Stores Statistics by Top Companies
- As of 2025, Cloudflare is the most popular third-party tool, used by 93.3% of BigCommerce stores (38,186), boosting security and performance.
- Followed by reCAPTCHA at 71.6% (29,325 stores), while Google Analytics is active on 50.4% of stores (20,614 sites), closely matched by Google Tag Manager with 20,604 installations.
- Other popular tools include Facebook Pixel (16,169), Google Ads Pixel (15,462), Google Adsense (15,329), Google Analytics 4 (14,885), YouTube Player (8,739), and PayPal Express Checkout (8,627).
By Top Shipment Carriers
- In the same period, USPS is the top shipping choice for BigCommerce stores, serving 19.4% of merchants (7,929 stores), with UPS used by 18.6% (7,593 stores) and FedEx by 13.0% (5,302 stores).
- Furthermore, other shipping carriers by the number of stores are Australia Post 1,125), Royal Mail (986), Canada Post (561), Purolator (159), DHL (102), New Zealand Post (96), and Japan Post (38).
By Top-level Domain
- Most BigCommerce stores use a .com domain, accounting for 79.3% of merchants (32,462 stores), as mentioned in storeleads.app.
- Other common domains include .com.au (4.6%) and .co.uk (3.4%), resulting in 1,882 stores and 1,406 stores, respectively.
- Additional domains include .net (674 stores), .ca (567), .org (483), .co.nz (315), .store (239), .shop (210), and .us (201).
Social Media Trends Among BigCommerce Merchants
- Store Leads reports that e-commerce brands connect with consumers via social media, with 36.2% of BigCommerce stores using Facebook.
- About one-third of BigCommerce stores (33.6%) use Instagram, while 17.3% of merchants promote their business on YouTube.
- LinkedIn leads with 6,957 stores, followed closely by Twitter with 6,900.
- Meanwhile, 4,149 stores use Pinterest, and TikTok has 1,137 users.
- Smaller platforms include Facebook Groups with 290 stores, WhatsApp with 192, and Yelp with 123.
- Even fewer stores engage on SoundCloud (18), Snapchat (9), and Discord (5).
Contact Information Available on BigCommerce Stores
- BigCommerce stores are twice as likely to show a phone number compared to Shopify stores.
- Around 68% of BigCommerce websites display a phone number, totalling 27,657 stores, in 2025
- Meanwhile, 53% provide an email address, which accounts for 21,604 stores.
Product Listings Across BigCommerce Stores
- According to the Store Leads report, around 20.3% of BigCommerce stores (8,317 stores) offer between 1 and 9 products in 2025.
- In contrast, stores selling 100 to 249 items make up 14.5% share (5,932 stores), while 14.3% of merchants list 250 to 999 products, resulting in 5,870 stores.
The number of BigCommerce Store with products sold out are stated in the table below:
| Stores | Products Sold |
| 3,930 | 25 to 49 |
| 3,254 | 10 to 24 |
| 2,504 | 1000 to 4999 |
| 1,091 | 50 to 99 |
| 688 | 5000 to 9999 |
| 590 | 10000 to 24999 |
| 416 | 25000 to 99999 |
Stores Switching to BigCommerce Statistics From Other Platforms
- In the past 90 days of 2025, BigCommerce gained 309 merchants who switched from other e-commerce platforms.
- The largest number came from Custom Cart (90), WooCommerce (69), and Shopify (67).
- Smaller migrations included Magento (19), Wix (13), Squarespace (7), 3DCart (5), Volusion (4), NetSuite SuiteCommerce (4), and Square Online (4), showing a mix of major and niche platform switches.
To Other Platform
- At the same time, BigCommerce has seen 476 merchants leave for other platforms, with Shopify being the main choice at 285 stores.
- Other platforms gaining former BigCommerce users include Custom Cart (80), WooCommerce (59), Ecwid (9), Magento (8), Squarespace (7), Square Online (6), GoDaddy Online Store (5), OMG (2), and Wix (2).
BigCommerce Website Traffic Statistics
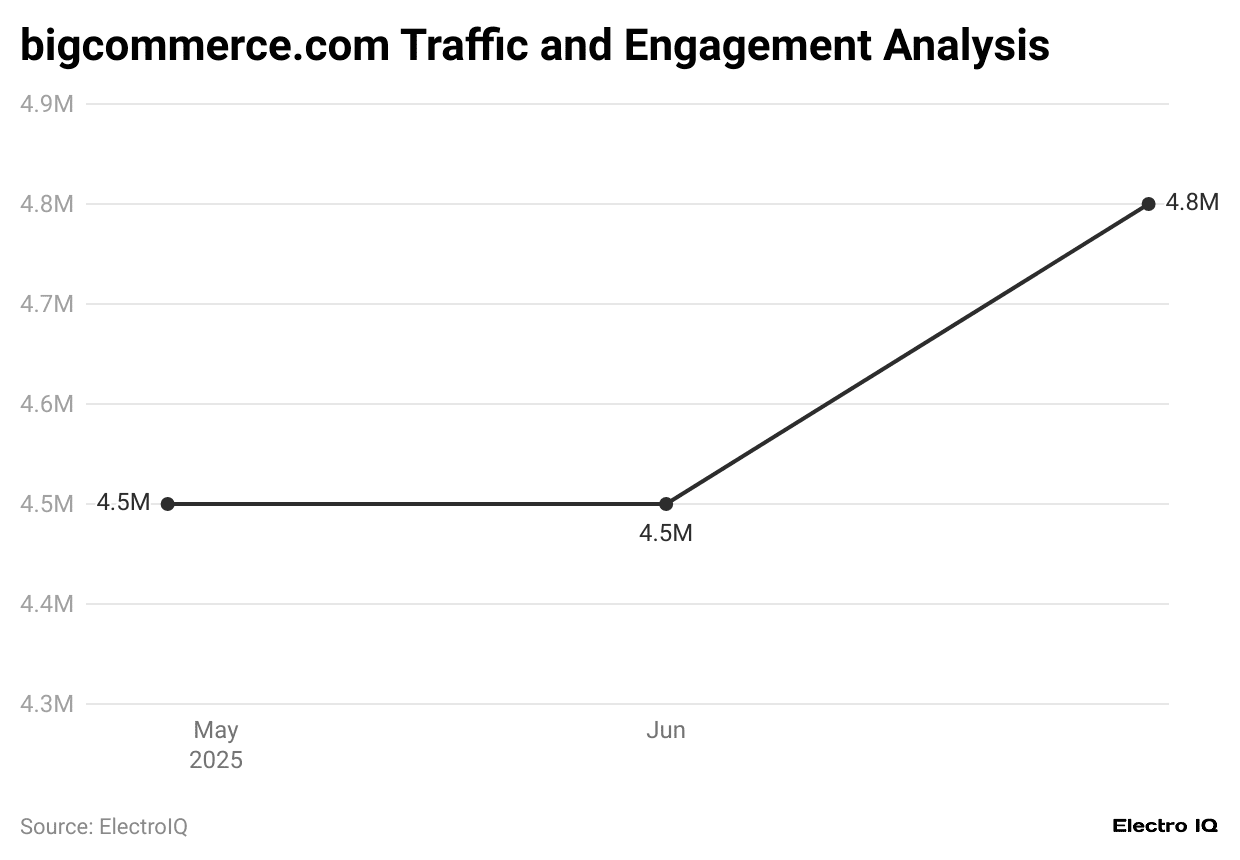
- As of July 2025, the total number of visits to bigcommerce.com accounted for 4.8 million, representing a 5.86% increase from the previous month.
- In contrast, the bounce rate of the website was 66.12%.
- Meanwhile, the average number of pages per visit was 74, and the average visit duration was 1 minute and 38 seconds.
- Globally, BigCommerce’s website ranked #17,518, in the United States (#5,610), and category-wise #72.
By Country
 (Reference: similarweb.com)
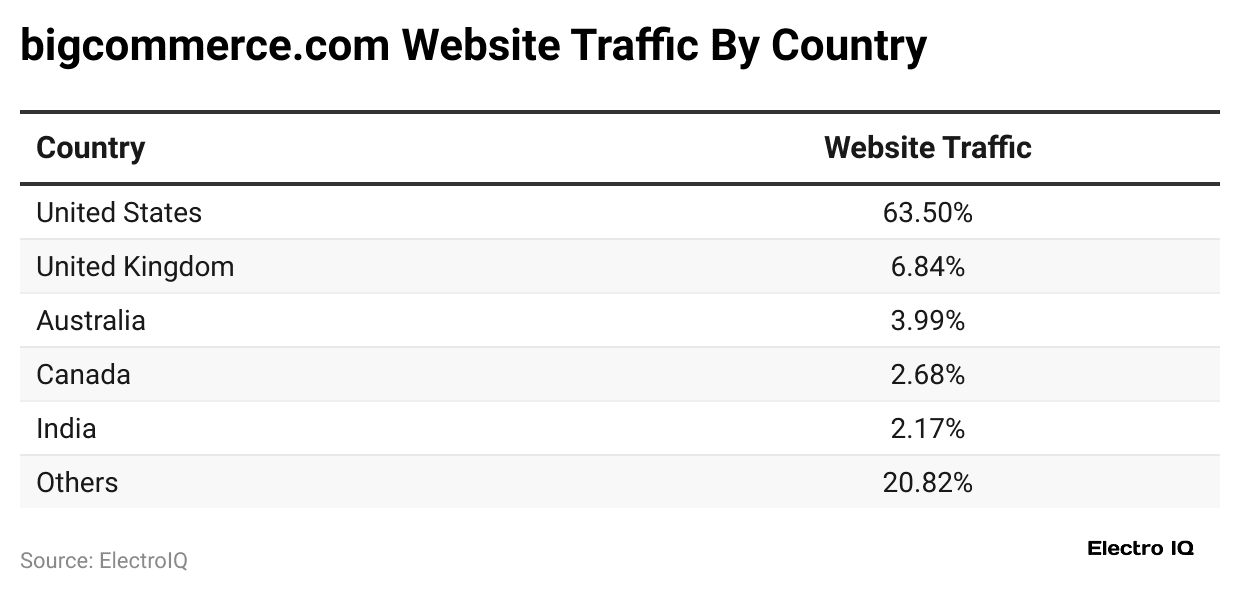
- The United States of America accounted for the highest share on bigcommerce.com at 63.5% in July 2025, representing a 4.73% increase from last month.
- The following are the top five countries by website traffic share: the United Kingdom: 6.84% (+13.18%), Australia: 3.99% (+24.92%), Canada: 2.68% (-6.13%), and India: 2.17% (-23.17%)
- The rest of the countries captured a share of 20.82% BigCommerce’s website traffic.
By User Demographics
 (Reference: similarweb.com)
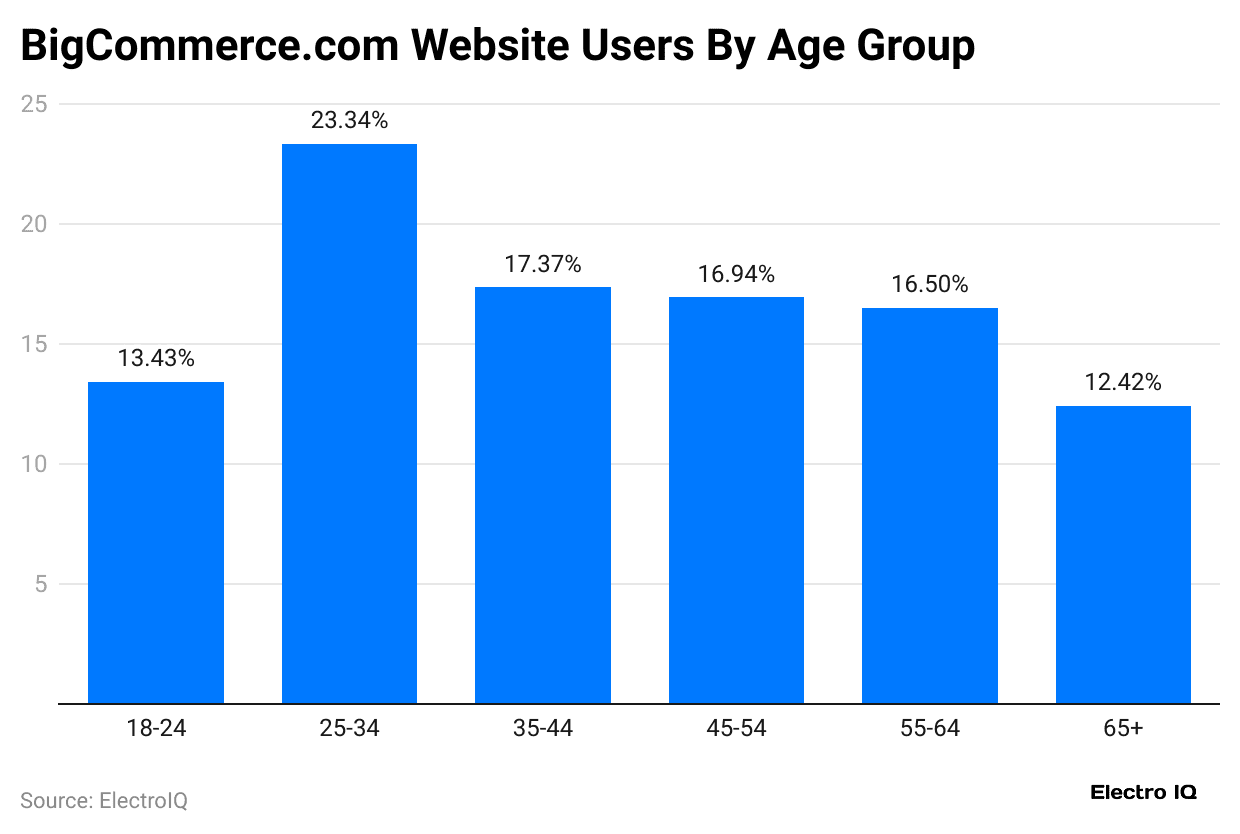
- In the same period, the total number of BigCommerce’s website users aged 25 to 34 years accounted for the highest share, at 23.34%, followed by those aged 35 to 44 years at 17.37%.
- Furthermore, the age distribution of other users is as follows: 45 to 54 years (16.94%), 55 to 64 years (16.5%), 65 years and older (12.42%), and 18 to 24 years (13.43%).
- Based on gender, approximately 60.48% of BigCommerce users were male, and 39.52% were female.
By Marketing Channels Distribution
 (Reference: similarweb.com)
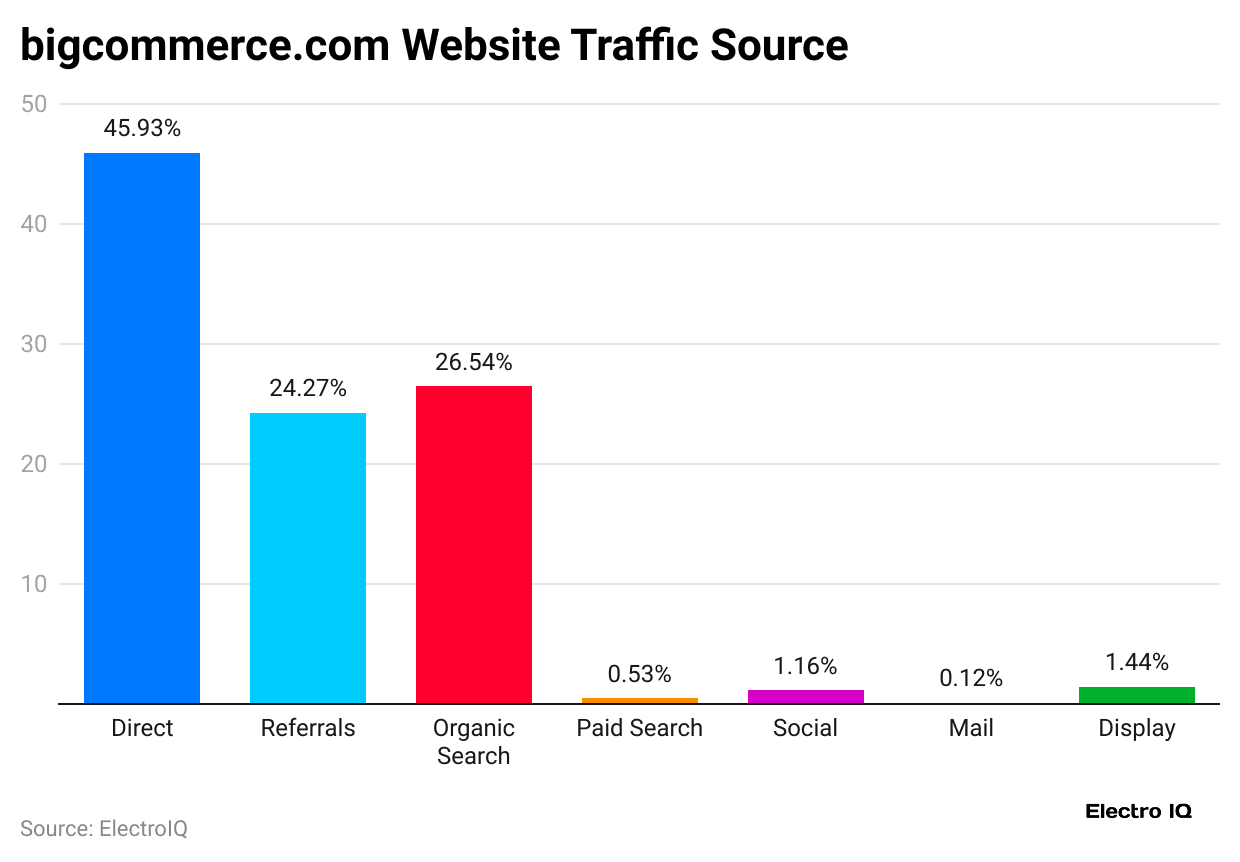
- As of July 2025, the top traffic sources for the BigCommerce website were direct search with a traffic share of 45.93%, followed by organic search (26.54%).
- Moreover, other marketing channel distributions are followed by referrals (24.27%), paid search (0.53%), social (1.16%), mail (0.12%), and display (1.44%).
By Social Media
 (Reference: similarweb.com)
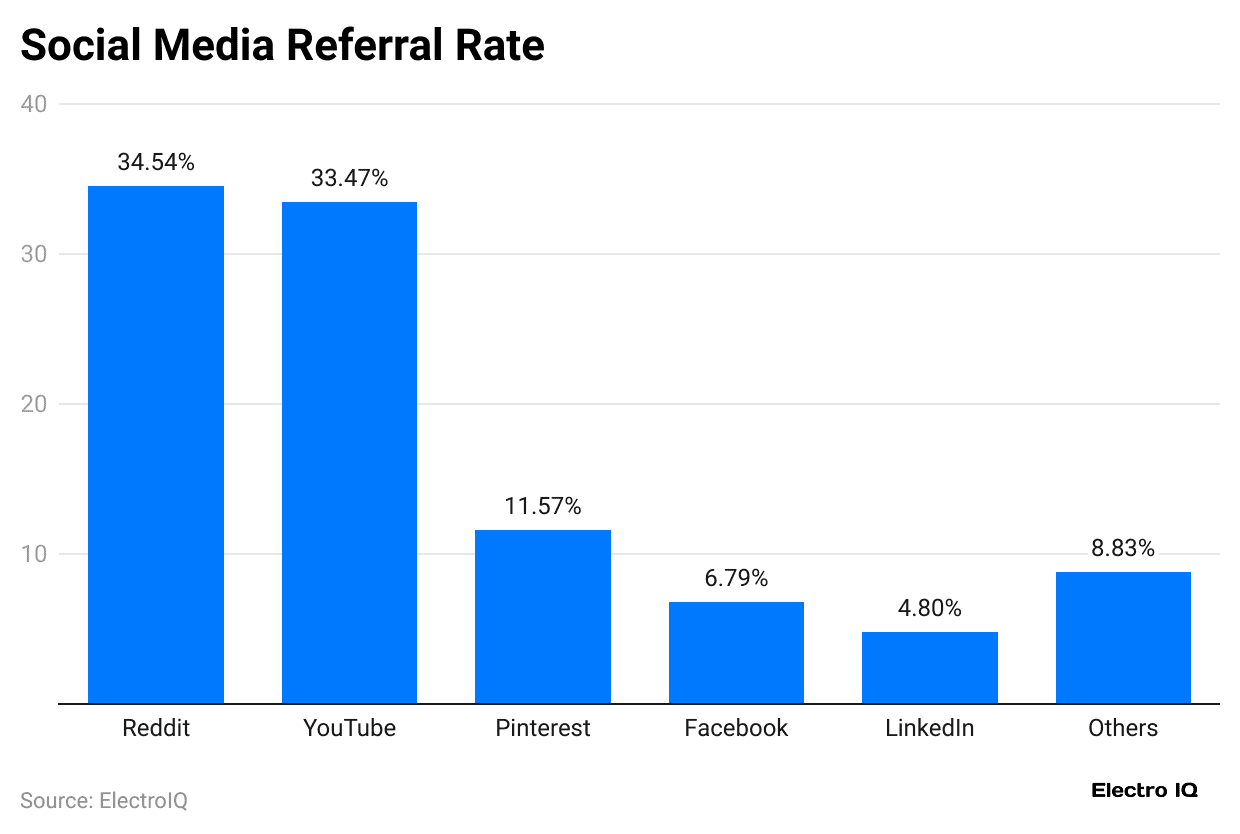
- At the same time, the social network traffic accounted for by bigcommerce.com remained the highest on Reddit, holding shares of 34.54%, followed by YouTube with a share of 33.47%.
- Moreover, social media traffic sources include Pinterest (11.57%), Facebook (6.79%), LinkedIn (4.8%), and others (8.83%).
By Device
 (Reference: semrush.com)
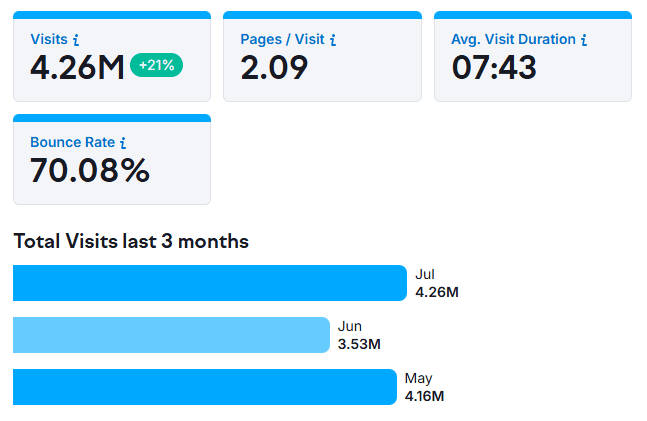
- In July, bigcommerce.com got 4.26 million visits, with each visit lasting an average of 7 minutes and 43 seconds.
- This is a 20.69% increase in traffic compared to June.
- Most visitors to BigCommerce.com use desktops, making up about 75.88% of traffic, while around 24.12% of visits come from mobile devices.
| Country | Visitor’s Share | All devices | Desktop | Mobile |
| United States | 56.37% | 2.4M | 72.31% | 27.69% |
| United Kingdom | 7.33% | 312.3K | 77.77% | 22.23% |
| India | 5.48% | 233.33K | 73.57% | 26.43% |
| Australia | 4.34% | 184.84K | 80.29% | 19.71% |
| Canada | 3.74% | 159.26K | 71.57% | 28.43% |
Conclusion
Finally, BigCommerce is a dependable and flexible e-commerce platform that is suitable for all sizes of businesses. Its easy-to-use tools, customizable features, and strong integrations make running an online store simple. BigCommerce works well on both computers and mobile devices, helping businesses attract more customers.
It has built-in tools for marketing, analytics, and payments, giving everything needed to grow online. Overall, it’s a flexible and scalable option for anyone starting or expanding an e-commerce business.
Sources
FAQ.
It includes tools for marketing, analytics, payment processing, SEO, and inventory management.
BigCommerce pricing depends on your plan, ranging from basic options for small businesses to advanced tiers for large enterprises.
BigCommerce is simple to use and easy to manage, so you don’t need any special technical skills.
It lets businesses sell their products in many places, like their website, social media platforms, and online marketplaces.
Yes, it is secure, offering SSL encryption, PCI compliance, and measures to protect customer data.

Barry Elad is a passionate technology and finance journalist who loves diving deep into various technology and finance topics. He gathers important statistics and facts to help others understand the tech and finance world better. With a keen interest in software, Barry writes about its benefits and how it can improve our daily lives. In his spare time, he enjoys experimenting with healthy recipes, practicing yoga, meditating, or taking nature walks with his child. Barry’s goal is to make complex tech and finance information easy and accessible for everyone.