IoT Statistics By Revenue, Market Size, Private Networks, Applications, Users and Facts
Updated · Feb 16, 2026

Table of Contents
- Introduction
- Editor’s Choice
- IoT Market Size Forecast
- IoT Spending Statistics
- IoT Devices Connected Worldwide
- IoT Solution Revenue By Layer
- Industrial IoT Market Size
- Automotive IoT Revenue Worldwide
- Global IoT Investment
- Cellular IoT Connections
- IoT Service Requests By Private Networks
- Smart Home Appliances Revenue
- IoT Module Shipments Share
- Wide-Range and Short-Range IoT Products
- IoT Connections By Application
- Smart Home Users’ Growth
- IoT Technical Standards
- Top IoT Companies
- Conclusion
Introduction
IoT Statistics: The Internet of Things (IoT) represents a dynamic and rapidly evolving technological landscape characterized by exponential growth and transformative potential across multiple sectors. Going through IoT Statistics, we can learn how the technology is reshaping how devices communicate, collect data, and provide value.
As technologies like 5G, artificial intelligence, and edge computing mature, we will learn how IoT is poised to become an increasingly integral part of our technological ecosystem, driving digital transformation and creating unprecedented business opportunities, and how it is expected to perform in the future.
Editor’s Choice
- IoT Annual Revenue is Projected to reach USD 934.2 billion by 2033, showing rapid growth.
- Global IoT Devices are expected to connect 37.48 billion devices by 2032, indicating a massive expansion.
- Industrial IoT Market is predicted to grow to USD 3,352.97 billion by 2030, driven by automation and smart factories.
- Automotive IoT Revenue Estimated at USD 371.61 billion by 2029, highlighting advancements in connected vehicles.
- Cellular IoT Connections Forecasted to reach 5.8 billion by 2030, boosting mobile connectivity.
- Smart Home Users are expected to grow to 785.16 million globally by 2028, driven by convenience and energy efficiency.
- Enterprise IoT Connections are anticipated to hit 24 billion by 2030, showcasing business digital transformation.
- IoT Module Market Leader Quectel Wireless leads with a 37.2% market share, dominating the sector.
- Short-Range IoT Devices Set to expand to 31.63 billion by 2029, led by consumer and industrial applications.
- Smart Home Appliance Revenue Projected at USD 92.2 billion by 2028, fueled by growing demand for connected devices.
- Account for 30% of total IoT solution revenue, supporting business adoption.
- Wide-area IoT Devices are predicted to grow to 7.2 billion by 2029, enabling large-scale connectivity.
- Consumer IoT Devices Expected to reach 14 billion by 2030, driven by wearables and smart home products.
- Global IoT Investments fluctuate between USD 34–71 million annually, showcasing varied market engagement.
IoT Market Size Forecast
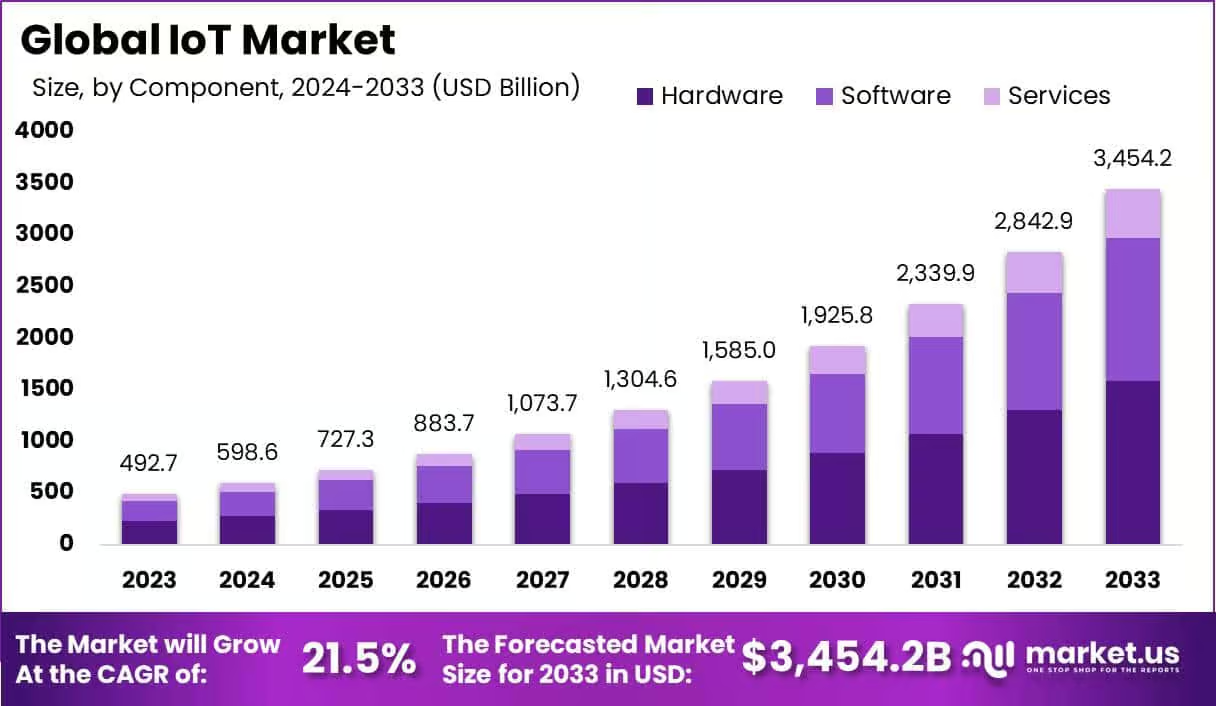
- The Global IoT market size is expected to be worth USD 3,454.2 billion by 2033, growing at a CAGR of 21.5% from 2024 to 2033.
- The IoT market was valued at USD 492.7 billion in 2023.
- The IoT hardware segment captured more than 43.5% share of the market in 2023.
- The industrial users segment held more than 42.1% share of the IoT market in 2023.
- The consumer electronics segment held more than 23.3% share of the IoT market in 2023.
- North America accounted for over 37.0% share of the IoT market in 2023.
- IoT connections are expected to contribute approximately USD 18.7 billion in revenue.
- IoT data and analytics services are projected to generate USD 76.5 billion in revenue in 2023.
- Revenue from IoT device and application platform services is forecasted to exceed USD 100 billion.
- IoT network services are estimated to generate approximately USD 1.10 billion in revenue.
- Professional IoT services are projected to witness a market opportunity worth approximately USD 83.1 billion.
- IoT security services are expected to create a revenue opportunity of around USD 10.5 billion.
- IoT antenna shipments are projected to reach approximately 6.9 billion annually by 2024.
- The number of IoT devices is expected to exceed 27 billion by 2025, compared to the current 16.3 billion global IoT connections.
- Approximately 40% of global IoT connections are concentrated in China and the United States.
- The internet is expected to connect around 500 billion devices by 2030.
- Home security and monitoring systems lead IoT applications with an estimated 10.9 billion connections.
- Smart meters and home appliances account for around 1 billion connections each.
- 85% of companies are currently engaged in at least one Industrial IoT (IIoT) use case project.
IoT Spending Statistics
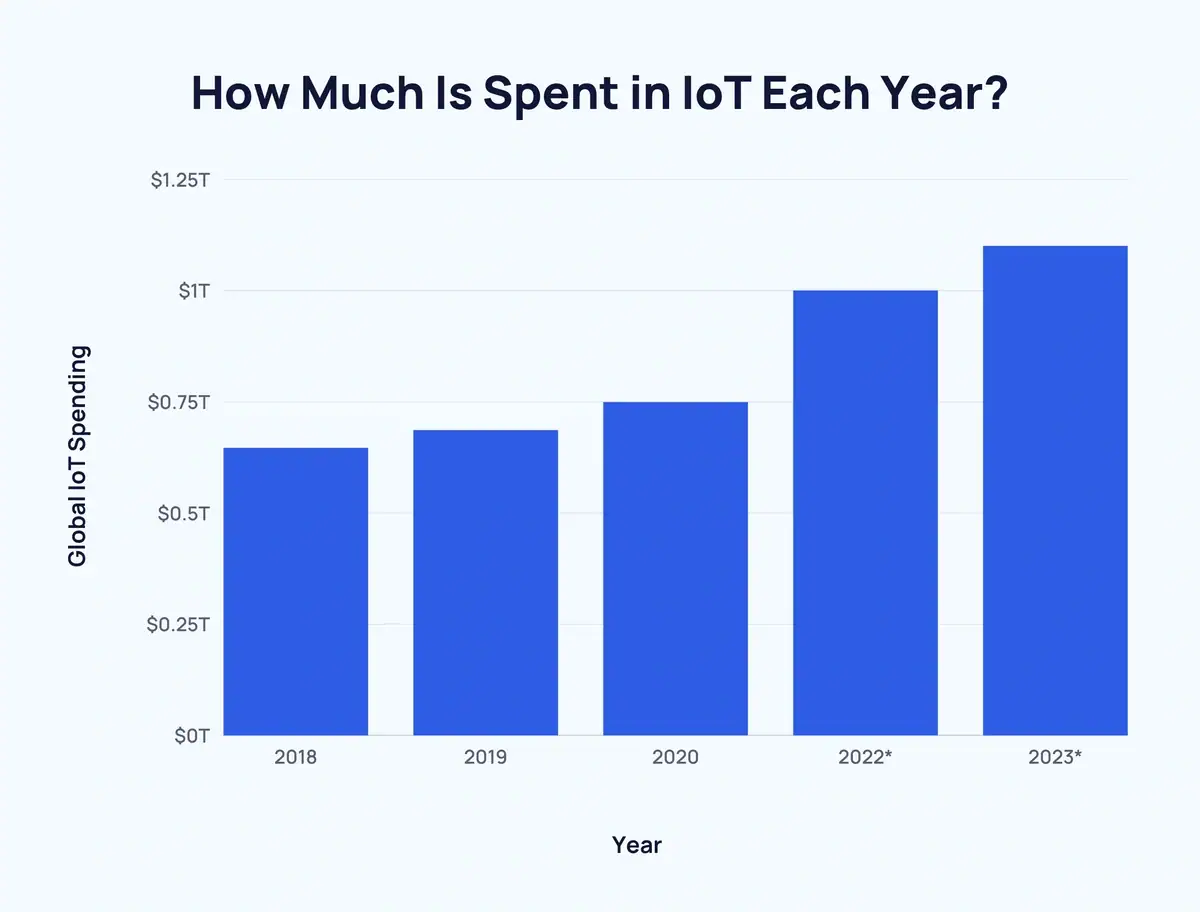
- In 2023, global Internet of Things (IoT) spending surpassed an estimated USD 1 trillion.
(Source: Exploding Topics)
- Since 2018, global IoT spending has increased year-over-year by at least USD 40 billion.
- In 2020, IoT spending reached USD 749 billion.
- In 2022, global IoT spending was projected to hit USD 1 trillion.
- In 2023, IoT spending was expected to rise to USD 1.1 trillion.
Here is a breakdown of the worldwide IoT spending forecast as of January 2021:
| Year | Global IoT Spending |
| 2018 | $646 billion |
| 2019 | $686 billion |
| 2020 | $749 billion |
| 2022 | $1 trillion* |
| 2023 | $1.1 trillion* |
- China holds a 35% market share in the IoT sector and is the dominant force in this space.
- China’s IoT revenue is estimated to reach USD 157 billion by 2025.
- By 2033, China’s IoT revenue is anticipated to climb to USD 296.8 billion.
Here’s a breakdown of the IoT market by region over time:
| Region | 2023 | 2024 | 2025 | 2026 | 2027 | 2028 | 2029 | 2030 | 2031 | 2032 | 2033 |
| Greater China | $121.6B | $139.9B | $157B | $173.6B | $189.9B | $206.7B | $224.1B | $241.9B | $260B | $278.3B | $296.8B |
| North America | $68.4B | $80.1B | $91.7B | $103.7B | $116.1B | $129B | $142.5B | $156.2B | $169.9B | $183.4B | $196.6B |
| Europe | $61.9B | $72.1B | $82.4B | $93.3B | $104.4B | $115.9B | $127.9B | $140.4B | $153B | $165.6B | $178.3B |
| Japan | $25.7B | $29.4B | $33B | $36.4B | $39.7B | $43B | $46.2B | $49.4B | $52.5B | $55.4B | $58.2B |
| Latin America | $16.1B | $19.4B | $22.7B | $25.9B | $29.3B | $32.8B | $36.4B | $40.2B | $44.1B | $48B | $52B |
| South Korea | $9.4B | $10.9B | $12.2B | $13.4B | $14.6B | $15.7B | $16.8B | $17.9B | $18.9B | $19.9B | $20.8B |
| India and South Asia | $7.3B | $9.1B | $11.1B | $13.3B | $15.7B | $18.3B | $21.1B | $24.1B | $27.1B | $30.3B | $33.5B |
| South East Asia | $6.9B | $8.7B | $10.7B | $12.9B | $15.3B | $17.9B | $20.6B | $23.3B | $26B | $28.6B | $31.3B |
| MENA | $5.7B | $7B | $8.4B | $10B | $11.7B | $13.6B | $15.7B | $17.9B | $20.2B | $22.6B | $25.1B |
| Russia & Central Asia | $5.2B | $6.1B | $7B | $7.9B | $8.9B | $9.9B | $11.1B | $12.3B | $13.6B | $14.9B | $16.3B |
| Australasia | $4.4B | $5.1B | $5.9B | $6.7B | $7.6B | $8.5B | $9.5B | $10.5B | $11.6B | $12.6B | $13.7B |
| Sub-Saharan Africa | $2.1B | $2.7B | $3.3B | $3.9B | $4.7B | $5.6B | $6.6B | $7.7B | $8.9B | $10.2B | $11.6B |
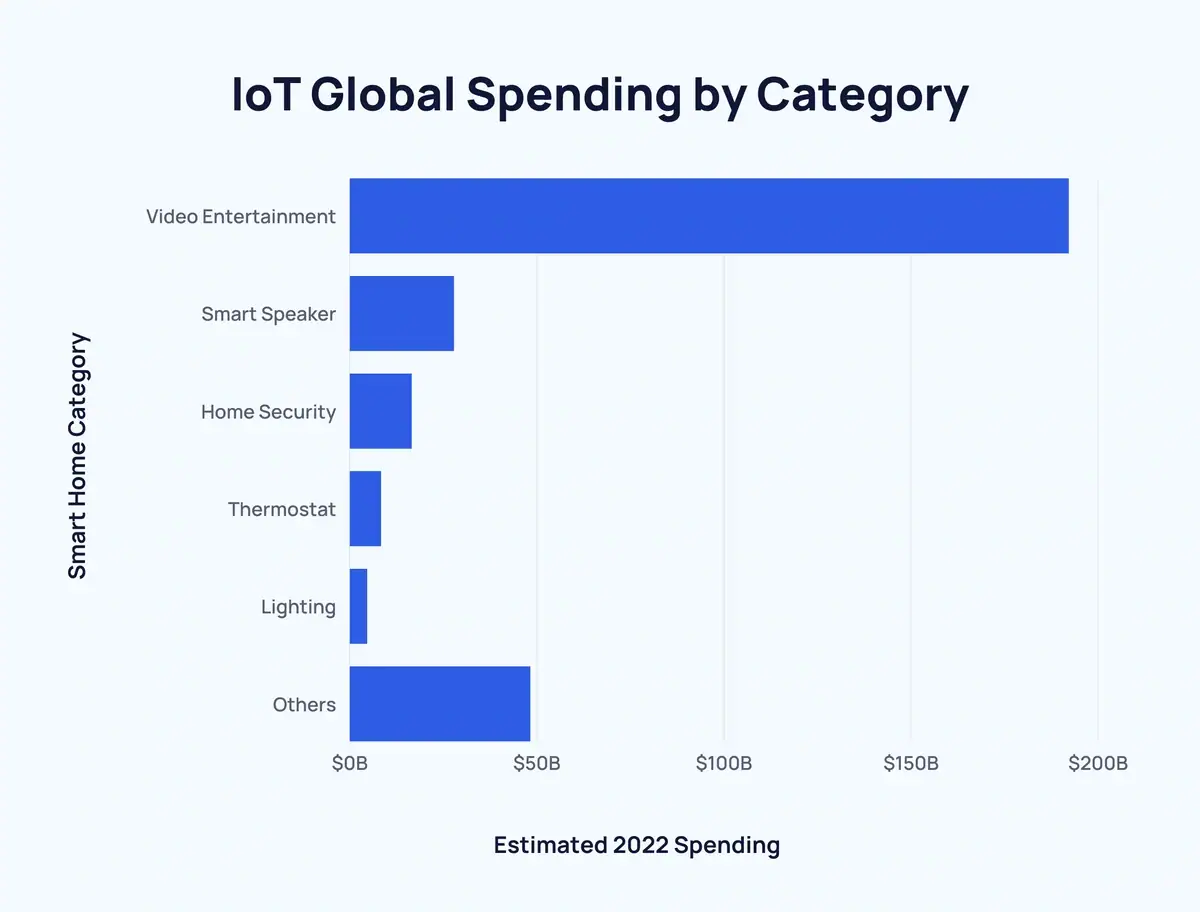
- In 2022, video entertainment was the largest category for smart home spending, with an estimated expenditure of USD 192.1 billion, accounting for 64.6% of total spending.
- Spending on smart speakers in 2022 was estimated at USD 27.8 billion, which made up 9.3% of total spending.
- Home monitoring and security spending in 2022 was USD 16.5 billion, contributing 5.5% of total spending.
(Source: Exploding Topics)
- In 2022, spending on thermostats was USD 8.3 billion, representing 2.8% of total spending.
- Lighting expenses in 2022 reached USD 4.6 billion, accounting for 1.5% of total spending.
- Other smart home categories combined accounted for USD 48.2 billion in 2022, making up 16.3% of total spending.
- In 2018, global IoT spending was USD 646 billion.
- In 2019, global IoT spending increased to USD 686 billion.
IoT Devices Connected Worldwide

(Reference: statista.com)
- IoT Statistics show that devices connected worldwide have been consistently growing over time.
- In 2019, 7741 million IoT devices were connected, and electricity, gas, and steam made up 893.2 million.
- As of 2023, there are 16059 million IoT devices connected, where electricity, gas, and steam make up 1459.8 million devices.
- It is predicted that by the end of 2032, there will be 37477.1 devices connected with IOT, and retail and wholesale will make up 3002.1 million devices.
IoT Solution Revenue By Layer

(Reference: statista.com)
- IoT Statistics show that Application enablement makes up 40% of all IoT-based sales worldwide.
- Professional services contribute 30% of all IoT sales.
- Devices/hardware contribute 15% of all IoT sales.
- Connectivity contributes 10% of all IoT sales.
- Other layers contribute 5% of all IoT sales.
Industrial IoT Market Size

(Reference: statista.com)
- IoT Statistics show that the industrial IoT market size has increased consistently.
- In 2020, the industrial IoT market size was 216.13 billion USD.
- By the end of 2023, the industrial IoT market size had increased to 686.46 billion USD.
- By the end of 2030, the industrial IoT market will be 3352.97 billion USD.
Automotive IoT Revenue Worldwide

(Reference: statista.com)
- IoT Statistics show that automotive IoT revenue is increasing consistently over time.
- In 2020, the revenue of the industry was USD 135.75 billion.
- As of 2023, the automotive IoT segment revenue increased to 232.07 billion USD.
- It is estimated that by the end of 2029, the revenue of the Automotive IoT segment will be 371.61 billion USD.
Global IoT Investment

(Reference: statista.com)
- IoT Statistics show that IoT investment has been decreasing over time.
- In 2018, the global IOT investment was 71 million USD.
- As of 2022, the IoT investment was 34 million USD.
Cellular IoT Connections

(Reference: statista.com)
- IoT Statistics show that cellular IoT connections has been increasing consistently over time.
- In 2021, there were 2.1 billion cellular IoT connections.
- By the end of 2023, the cellular IoT connection had grown to 3.5 billion.
- It is predicted that by the end of 2030, there will be 5.8 billion connected devices via mobile IoT.
IoT Service Requests By Private Networks

(Reference: statista.com)
- IoT Statistics show that IoT service requests are occasional, according to 52% of respondents.
- IoT services are rare, according to 26% of respondents.
- IoT services are very frequent in 19% of respondents.
- 3% of respondents need to be made aware of IoT service requests.
Smart Home Appliances Revenue

(Reference: statista.com)
- IoT Statistics show that the revenue of smart home devices has been increasing consistently over time.
- In 2020, the revenue of smart home appliances was 77959.37 million USD, and smart appliances comprised 29127.68 of all devices as the majority.
- In 2023, the revenue of smart home appliances was 52,558.04 million USD; smart appliances comprised 27,740.59 million USD of all devices as the majority.
- In 2028, the revenue of smart home appliances is projected to reach 92,200.05 million USD, and smart appliances will make up 48,897.56 million USD of all devices as the majority.

(Reference: statista.com)
- IoT Statistics showcase that Quectel Wireless, Fibocom, China Mobile, Sunsea, MEIG, Telit, Thales, Rolling Wireless, LG, SIMCom Wireless, Sierra Wireless, Gemalto, u-blox, and Other companies that ship IoT module shipments.
- By the end of Q1 2023, Quectel Wireless has the highest market share with 37.2%, followed by Other Companies with 35.1% market share, Telit with 8.2% market share, Fibocom with 8% market share, China Mobile with 5.9% market share, and Sunsea with 5.6% market share.
Wide-Range and Short-Range IoT Products

(Reference: statista.com)
- IoT Statistics show that wide-area and short-range IoT devices have increased consistently.
- As of 2014, the short-range IoT devices were 2728 million, while the wide-area IoT devices connected were 245 million.
- As of 2023, there are 12,093 million short-range IoT devices and 3626 million wide-area IoT devices.
- It is predicted that by the end of 2029, there will be 31629 million IoT devices and 7199 million wide-area IoT devices.
IoT Connections By Application

(Reference: statista.com)
- IoT Statistics show that worldwide IoT connections have been increasing consistently over time.
- In 2020, the number of connected consumer IoT devices was 7.5 billion, and 5.5 billion enterprise IoT devices were connected.
- By the end of 2023, enterprise IoT devices connected was 9.5 billion, and consumer IoT devices connected was 9 billion.
- As of 2030, it is estimated that there will be 24 billion enterprise IoT devices and 14 billion consumer IoT devices.
Smart Home Users’ Growth

(Reference: statista.com)
- IoT Statistics show that the number of smart homes worldwide has been increasing consistently.
- In 2019, there were 191.38 million users with a smart home.
- By the end of 2023, there will be 360.68 million users with smart homes.
- It is estimated that by the end of 2028, there will be 785.16 million smart homes.
IoT Technical Standards
- OCF (Open Connectivity Foundation)
- FDA (U.S. Food and Drug Administration)
- W3C (World Wide Web Consortium)
- XSF (XMPP Standards Foundation)
- EPCglobal (Electronic Product Code Technology)
- Auto-ID Labs (Auto Identification Center)
- MTConnect Institute (No long name specified)
- OMA (Open Mobile Alliance)
- GS1 (Global Standards One)
- IEEE (Institute of Electrical and Electronics Engineers)
(Source: wikipedia.org)
Top IoT Companies
- Siemens – Germany
- PTC – United States
- ABB – Switzerland
- Intel – United States
- Schneider Electric – France
- Honeywell – United States
- Huawei – China
- SAP – Germany
- Advantech – Taiwan
- Bosch – Germany
- Cisco – United States
- Amazon Web Services – United States
- IBM – United States
- Texas Instruments – United States
- C3 IoT – United States
- NXP Semiconductors – Netherlands
- Microsoft – United States
- Micron Technology – United States
- Ericsson – Sweden
- Samsung Electronics – Korea
- Digi – United States
- Rockwell Automation – United States
- Broadcom – United States
- Telefonica – Spain
- Mitsubishi Electric – Japan
- Dell Technologies – United States
- NVIDIA – United States
- Qualcomm – United States
- Analog Devices – United States
- NI – United States
- General Electric – United States
- Infineon – Germany
- AT&T – United States
- STMicroelectronics – Switzerland
- Emerson – United States
- Airtel – India
- relay – Germany
- Vodafone – United Kingdom
- 2lementry (Amazon Web Services) – United States
- PHOENIX CONTACT – Germany
- 3M Company – United States
- Arm – United Kingdom
- Google – United States
- Eaton – Ireland
- Accenture – European Union
- Omron Industrial Automation – Japan
- Ayla Networks – United States
- Juniper Networks – United States
- Nokia – European Union
- Hitachi – Japan
- Silicon Labs – United States
- DXC Technology – United States
- John Deere – United States
- Infor – United States
- Microchip Technology – United States
- Hewlett Packard Enterprise (HPE) – United States
- Telit – United Kingdom
- Silver Spring Networks – United States
- Cognizant – United States
- Lantronix – United States
- VANTIQ – United States
- DJI Enterprise – China
- SparkCognition – United States
- Zscaler – United States
- WIBU-SYSTEMS – Germany
- Particle – United States
- ON Semiconductor – United States
- NEC – Japan
- Caterpillar Inc. – United States
- Impinj – United States
- Johnson Controls – United States
- Inductive Automation – Canada
- Ingenu – United States
- Panasonic – Japan
- AUVESY-MDT – Germany
- Toshiba – Japan
- Raytheon Technologies – United States
- AMD – United States
- Tesla – United States
- Autodesk – United States
- Cree – United States
- Telstra – Australia
- Deutsche Telekom – Germany
- TE Connectivity – Switzerland
- Eseye – United Kingdom
- OSIsoft – United States
- China Mobile – China
- Zebra Technologies – United States
- MOXA – United States
- ProGlove – Germany
- AXOOM (TRUMPF) – Germany
- Worldsensing – Spain
- Microsemi Corporation – United States
- SigFox – European Union
- Cypress Semiconductor – United States
- Alibaba Cloud (Aliyun, 阿里云) – China
- Samsara – United States
- Sierra Wireless – France
- Pulse Electronics Corporation – United States
- Gemalto – Netherlands
(Source: iotone.com)
Conclusion
The Internet of Things (IoT) represents a dynamic and rapidly evolving technological landscape characterized by exponential growth and transformative potential across multiple sectors. IoT Statistics show that from industrial applications to consumer electronics, IoT is reshaping how devices communicate, collect data, and provide value. The projected expansion to nearly 38 million connected devices by 2032 and anticipated revenue exceeding $900 billion underscore the technology’s significant economic and technological implications.
In conclusion, IoT is poised to become an increasingly integral part of our technological ecosystem.
Sources
FAQ.
A network of interconnected physical devices that collect and exchange data through internet connectivity.
The market is experiencing rapid growth, with annual revenues expected to exceed $900 billion by 2033.
IoT significantly transforms the industrial, automotive, healthcare, smart home, and enterprise sectors.
Application enablement contributes 40% of all IoT-based sales worldwide.
An estimated 37,477.1 million IoT devices are projected to be connected by 2032.
Quectel Wireless holds the highest market share at 37.2% as of Q1 2023.
Enterprise IoT connections are expected to reach 24 billion by 2030.
Approximately 785.16 million smart homes are projected by 2028.
Application enablement (40%) and professional services (30%) constitute the majority of IoT solution revenues.
IoT investments have fluctuated between $34-71 million annually.

Maitrayee Dey has a background in Electrical Engineering and has worked in various technical roles before transitioning to writing. Specializing in technology and Artificial Intelligence, she has served as an Academic Research Analyst and Freelance Writer, particularly focusing on education and healthcare in Australia. Maitrayee's lifelong passions for writing and painting led her to pursue a full-time writing career. She is also the creator of a cooking YouTube channel, where she shares her culinary adventures. At Smartphone Thoughts, Maitrayee brings her expertise in technology to provide in-depth smartphone reviews and app-related statistics, making complex topics easy to understand for all readers.


