Operating Systems Statistics By Usage, Country, Distribution, Market Share And Facts (2025)
Updated · Sep 25, 2025


Table of Contents
- Introduction
- Editor’s Choice
- Global Operating System Usage Statistics
- Leading Mobile and Desktop Operating Systems Statistics by Region
- Operating System Market Share Statistics
- Operating System Market Share Statistics by Desktop
- By Mobile, 2025
- By Tablet
- Operating Systems Market Share Statistics by Region
- By Country
- Smartphone Shipments by Operating System (From 2017 to 2025)
- Operating System Share Analyses by Steam Hardware and Software
- Windows Operating System Version Comparison Statistics
- Distribution of Developer Operating Systems Statistics
- Conclusion
Introduction
Operating Systems Statistics: Operating systems are the core software that make computers and devices run, whether it’s a laptop, smartphone, server, or cloud system. The global market for operating systems is changing quickly as people’s choices, new technology, and regional trends affect which platforms are most used.
Current statistics show how popular systems like Windows, macOS, Linux, Android, and iOS compete with each other across desktop and mobile devices. Looking at this data not only shows which systems lead the market but also gives a clear picture of user habits, business needs, and the growing role of open-source platforms in today’s tech world.
Editor’s Choice
- gs.statcounter.com depicts that as of August 2025, Android was the leading operating system worldwide with 44.44% market share,
- In the same duration, Windows continued to dominate the global desktop operating system market with a 69.75% share.
- In North America, Windows accounted for the largest share of the operating system market at 31.02%.
- In the United States, the operating system usage in August 2025 was as follows: Windows was the top choice with 32.95%, followed by iOS at 28.14% and Android at 21.06%.
- In May 2025, Android was by far the most-used operating system worldwide, at about 72.7% of global usage.
- According to Wikipedia, in the first quarter of 2025, Android (including forks) dominated smartphone shipments with 76% of units sold.
- Most computers in May 2025 were running Windows 10 or Windows 11; about 53.19% used Windows 10, and roughly 43.22% used Windows 11.
- In 2024, Windows was the most commonly used operating system among developers 59.2% of respondents said they use Windows for personal work, while 47.6% reported Windows as their primary professional workstation.
Global Operating System Usage Statistics
 (Reference: procurri.com)
- In May 2025, Android was by far the most-used operating system worldwide, at about 72.7% of global usage.
- Windows also held a very large share (roughly 70.2%), reflecting its dominance on desktops.
- Apple’s iOS made up about 26.9% of usage, while macOS accounted for about 5.5%.
- Linux represented roughly 4.1% of global use, and ChromeOS was close to 1.8%.
Leading Mobile and Desktop Operating Systems Statistics by Region
 (Reference: procurri.com)
- As of 2025, Android is the dominant mobile platform across all three regions, with about 86.62% in Africa, 90.86% in Latin America, and 81.61% in the Asia Pacific region.
- Windows remains the principal desktop OS, with 61.68% in Africa, 84.60% in LATA, M, and 72.71% in APAC.

(Reference: statcounter.com)
- As of August 2025, Android was the leading operating system worldwide with 44.44% market share, making it the most popular choice among users.
- Windows ranked second with 27.45%, while Apple’s iOS held the third spot at 15.94%.
- Other users’ shares captured about 4.6% and are classified as unknown operating systems.
- Apple’s desktop systems also maintain a presence, with OS X accounting for 3.42% and macOS capturing 1.88% of the worldwide market.
Furthermore, other monthly operating system market shares in 2025 are stated in the table below:
|
Months |
Operating System Names | |||||
| Android | Windows | iOS | OSX | Linux | Unknown | |
|
January |
46.14% | 25.47% | 18.11% | 5.32% | 1.33% | 2.69% |
| February | 45.53% | 25.36% | 18.25% | 5.65% | 1.38% |
2.95% |
|
March |
45.6% | 25.85% | 18.05% | 4.9% | 1.44% | 2.52% |
| April | 45.63% | 25.79% | 17.82% | 3.65% | 1.56% |
2.68% |
|
May |
46.67% | 24.77% | 17.8% | 3.61% | 1.44% | 2.94% |
| June | 47.66% | 24.72% | 16.65% | 3.48% | 1.45% |
3.3% |
|
July |
42.81% | 28.8% | 16.87% | 3.48% | 1.57% |
3.93% |
(Reference: statcounter.com)
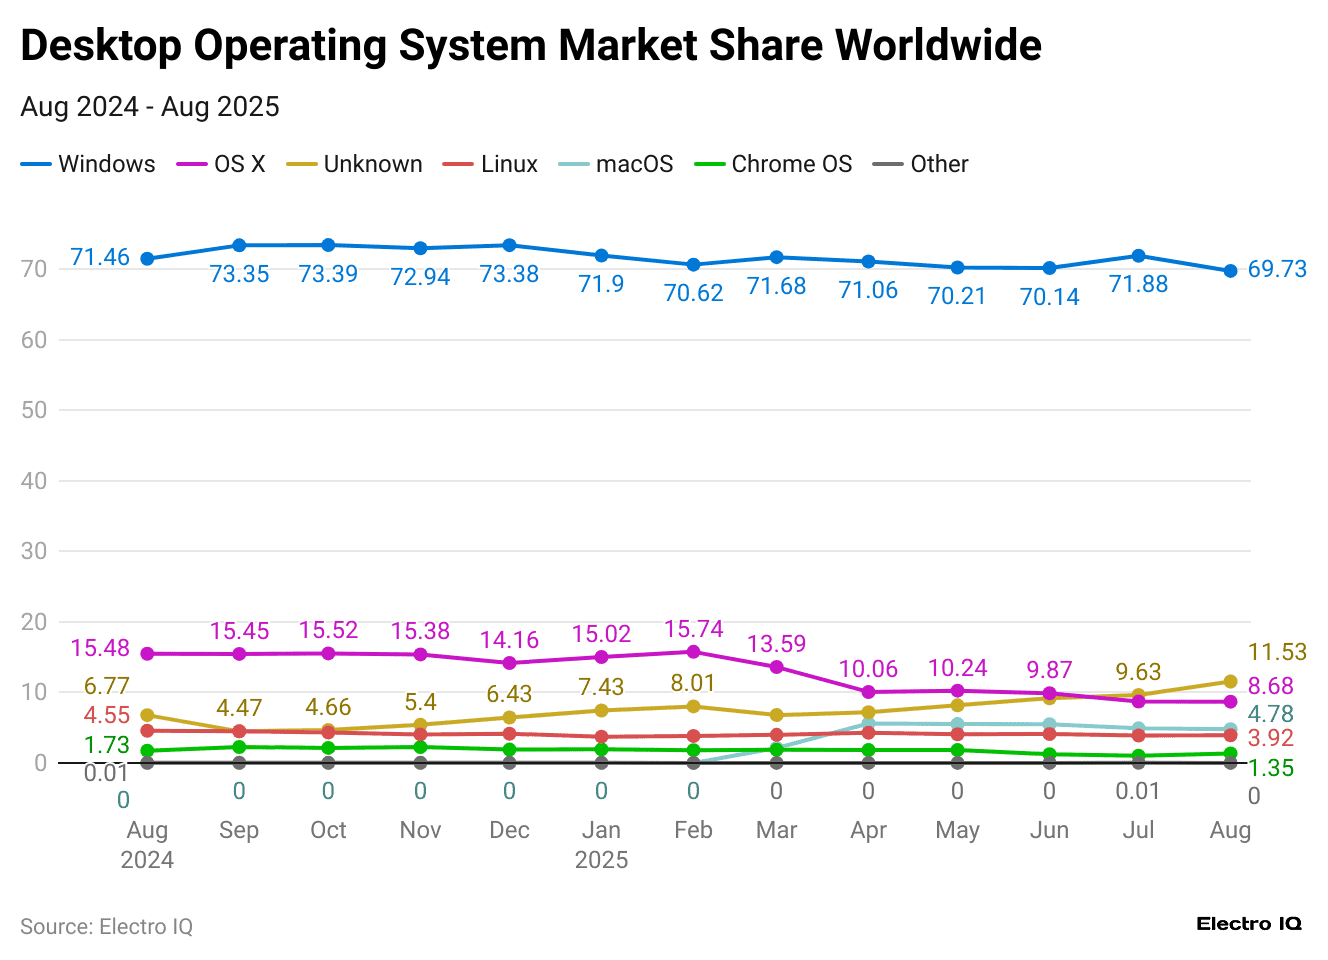
- In August 2025, Windows continued to dominate the global desktop operating system market with a 69.75% share.
- Systems classified as Unknown followed at 11.48%, while OS X held 8.69% and macOS accounted for 4.79%.
- Linux maintained a smaller presence with 3.93%, and Chrome OS made up 1.36% of worldwide usage.
This year’s other monthly operating system market shares of desktops are stated below:
| Months | Operating System Names | |||||
| Windows | OSX | Linux | macOS | Chrome OS | Unknown | |
| January | 71.9% | 15.02% | 3.72% | 0% | 1.92% | 7.43% |
| February | 70.62% | 15.74% | 3.81% | 0% | 1.81% | 8.01% |
| March | 71.68% | 13.59% | 3.98% | 2.11% | 1.86% | 6.78% |
| April | 71.06% | 10.06% | 4.27% | 5.58% | 1.84% | 7.19% |
| May | 70.21% | 10.24% | 4.06% | 5.5% | 1.83% | 8.16% |
| June | 70.14% | 9.87% | 4.09% | 5.48% | 1.24% | 9.17% |
| July | 71.88% | 8.69% | 3.88% | 4.9% | 1.02% | 9.63% |
By Mobile, 2025
| Months | Operating System Names | ||||||
| Android | iOS | Samsung | KaiOS | Linux | Windows | Unknown | |
| January | 72.21% | 27.32% | 0.31% | 0.03% | 0.01% | 0.01% | 0.1% |
| February | 71.75% | 27.78% | 0.29% | 0.03% | 0.01% | 0.01% | 0.11% |
| March | 71.95% | 27.63% | 0.24% | 0.02% | 0.01% | 0.01% | 0.12% |
| April | 72.23% | 27.39% | 0.22% | 0.02% | 0.01% | 0.01% | 0.11% |
| May | 72.72% | 26.92% | 0.2% | 0.02% | 0.01% | 0.01% | 0.11% |
| June | 74.18% | 25.47% | 0.2% | 0.02% | 0.01% | 0.01% | 0.11% |
| July | 72.03% | 27.59% | 0.21% | 0.02% | 0.01% | 0.01% | 0.12% |
| August | 73.93% | 25.68% | 0.21% | 0.02% | 0.01% | 0.01% | 0.14% |
By Tablet
| Months | Operating System Names | |||
| iOS | Android | Linux | Unknown | |
| January | 52.85% | 47% | 0.11% | 0.03% |
| February | 52.03% | 47.8% | 0.12% | 0.04% |
| March | 50.2% | 49.62% | 0.113% | 0.04% |
| April | 49.55% | 50.25% | 0.15% | 0.04% |
| May | 49.94% | 49.78% | 0.23% | 0.04% |
| June | 47.99% | 51.8% | 0.16% | 0.05% |
| July | 49.23% | 50.51% | 0.2% | 0.04% |
| August | 48.95% | 50.83% | 0.17% | 0.04% |
In North America
(Reference: statcounter.com)
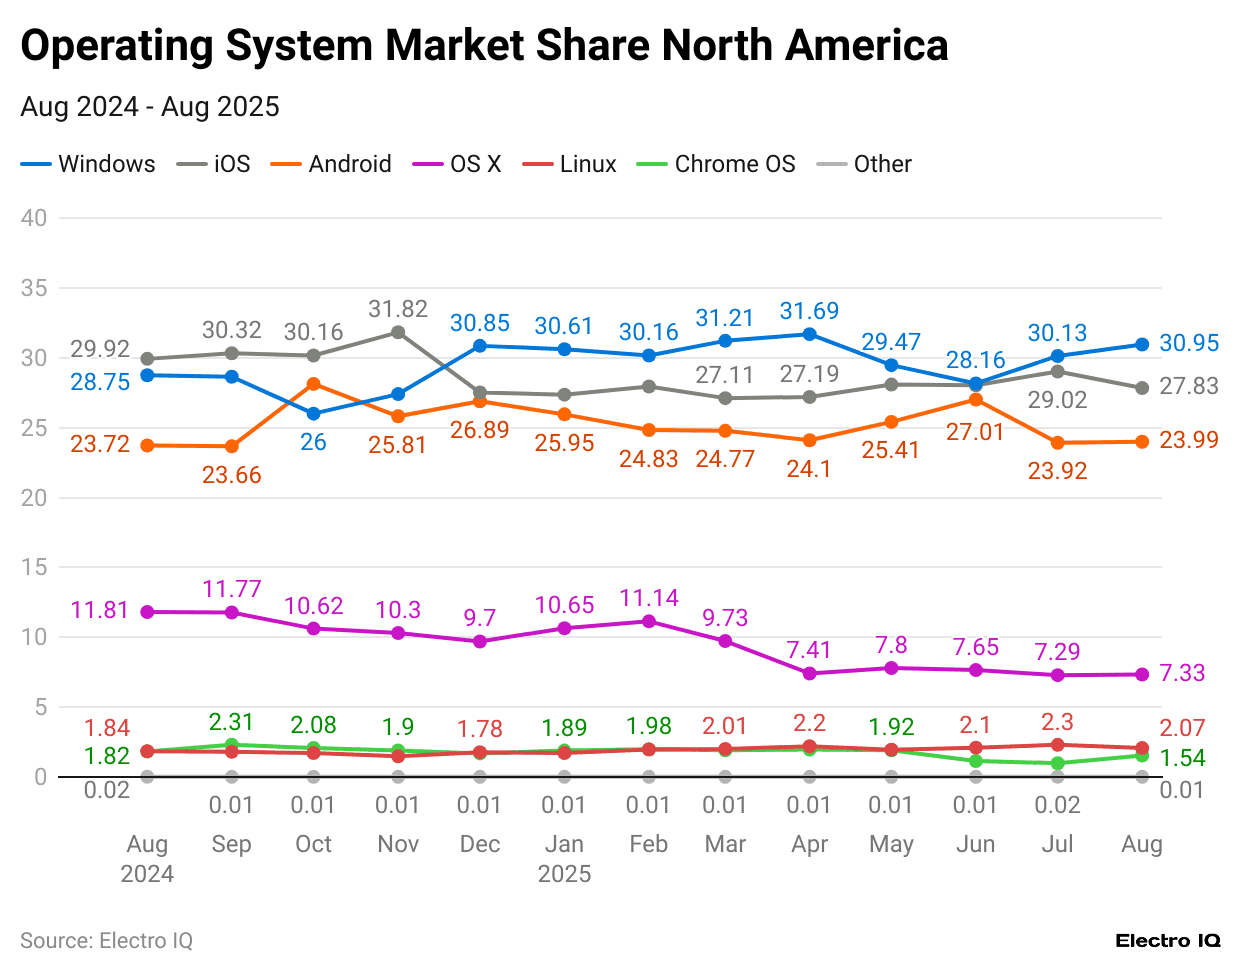
- According to gs.statcounter.com, as of August 2025, Windows accounted for the largest share of the operating system market at 31.02%.
- Apple’s iOS follows closely with 27.77%, highlighting the strong presence of iPhones in the region. Android takes the third spot with 23.97%, reflecting its wide adoption in smartphones and tablets.
- macOS versions are split, with OS X at 7.33% and modern macOS at 3.67%.
- Meanwhile, about 2.44% of usage is attributed to unidentified or unknown systems.
In South America
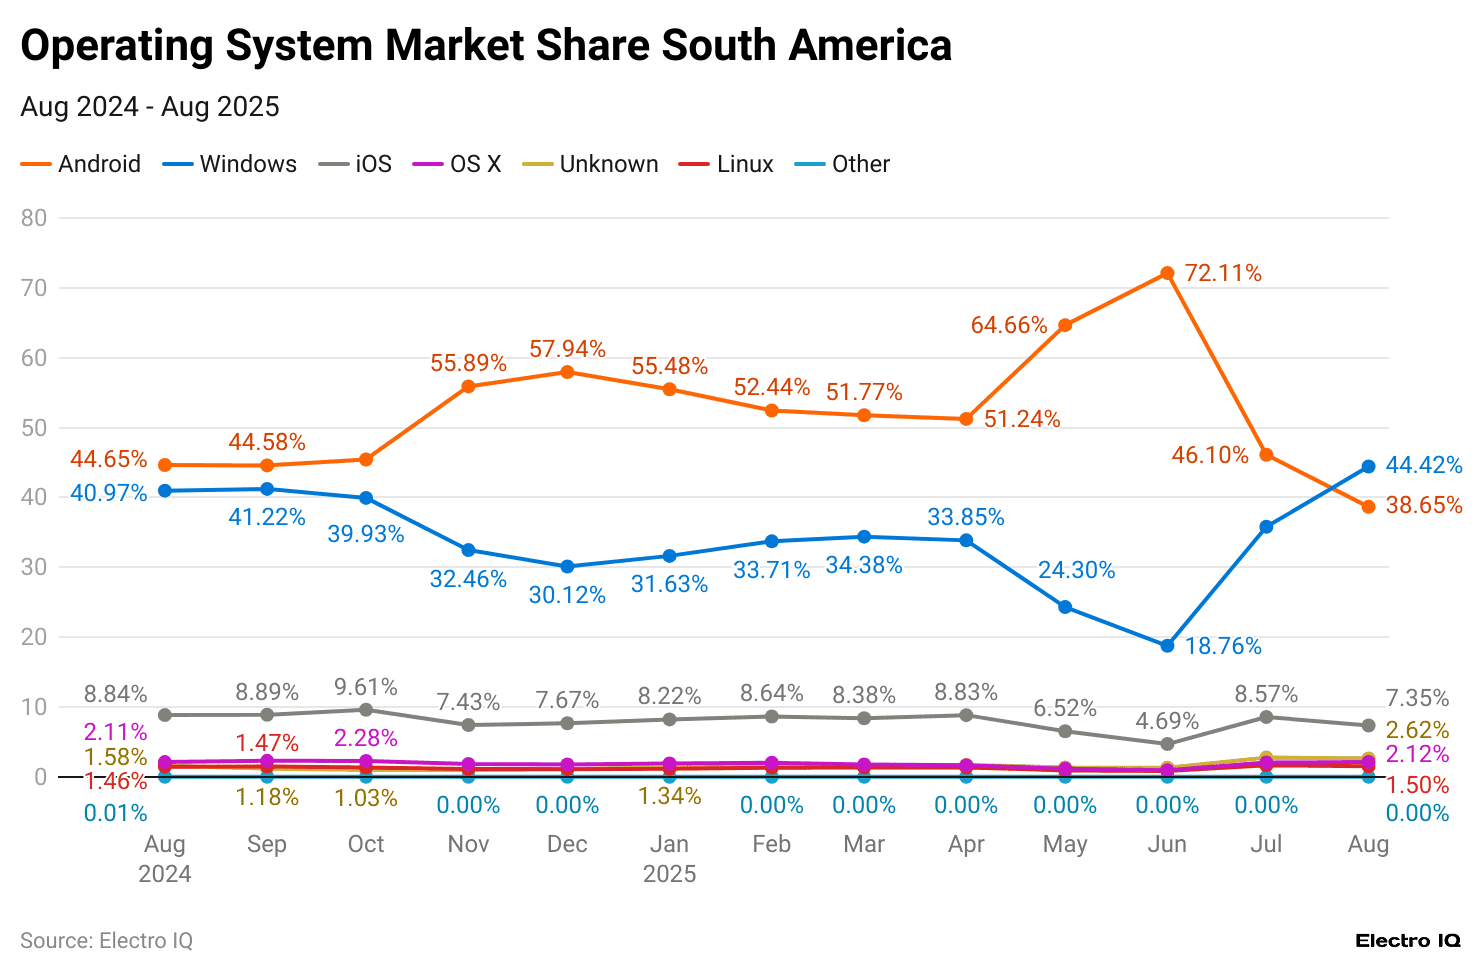
(Reference: statcounter.com)
- Windows led the operating system market in South America with a share of 43.99%, followed closely by Android at 38.94%. iOS held 7.39%, while macOS accounted for 3.13% of users.
- Smaller portions went to Unknown systems (2.65%) and OS X (2.13%).
In Africa
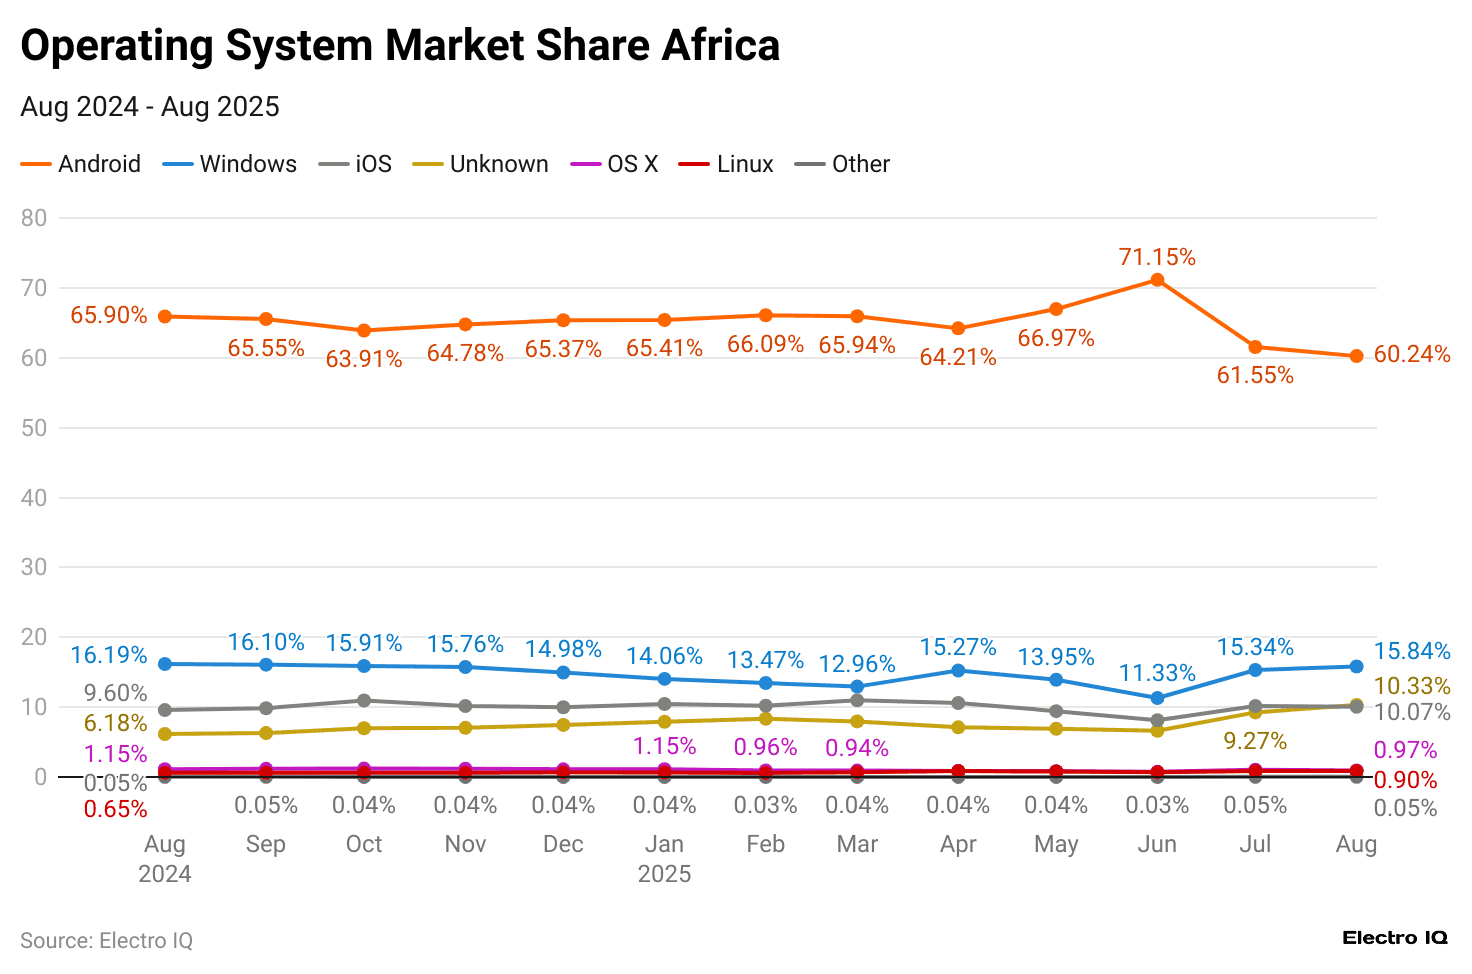
(Reference: statcounter.com)
- In the same duration as above, Android held the largest share of Africa’s OS market at 60.23%, followed by Windows with 15.85%.
- Meanwhile, iOS captured 10.08%, whereas macOS and OS X together accounted for just over 2%, and about 10.3% of usage came from unknown.
In Asia
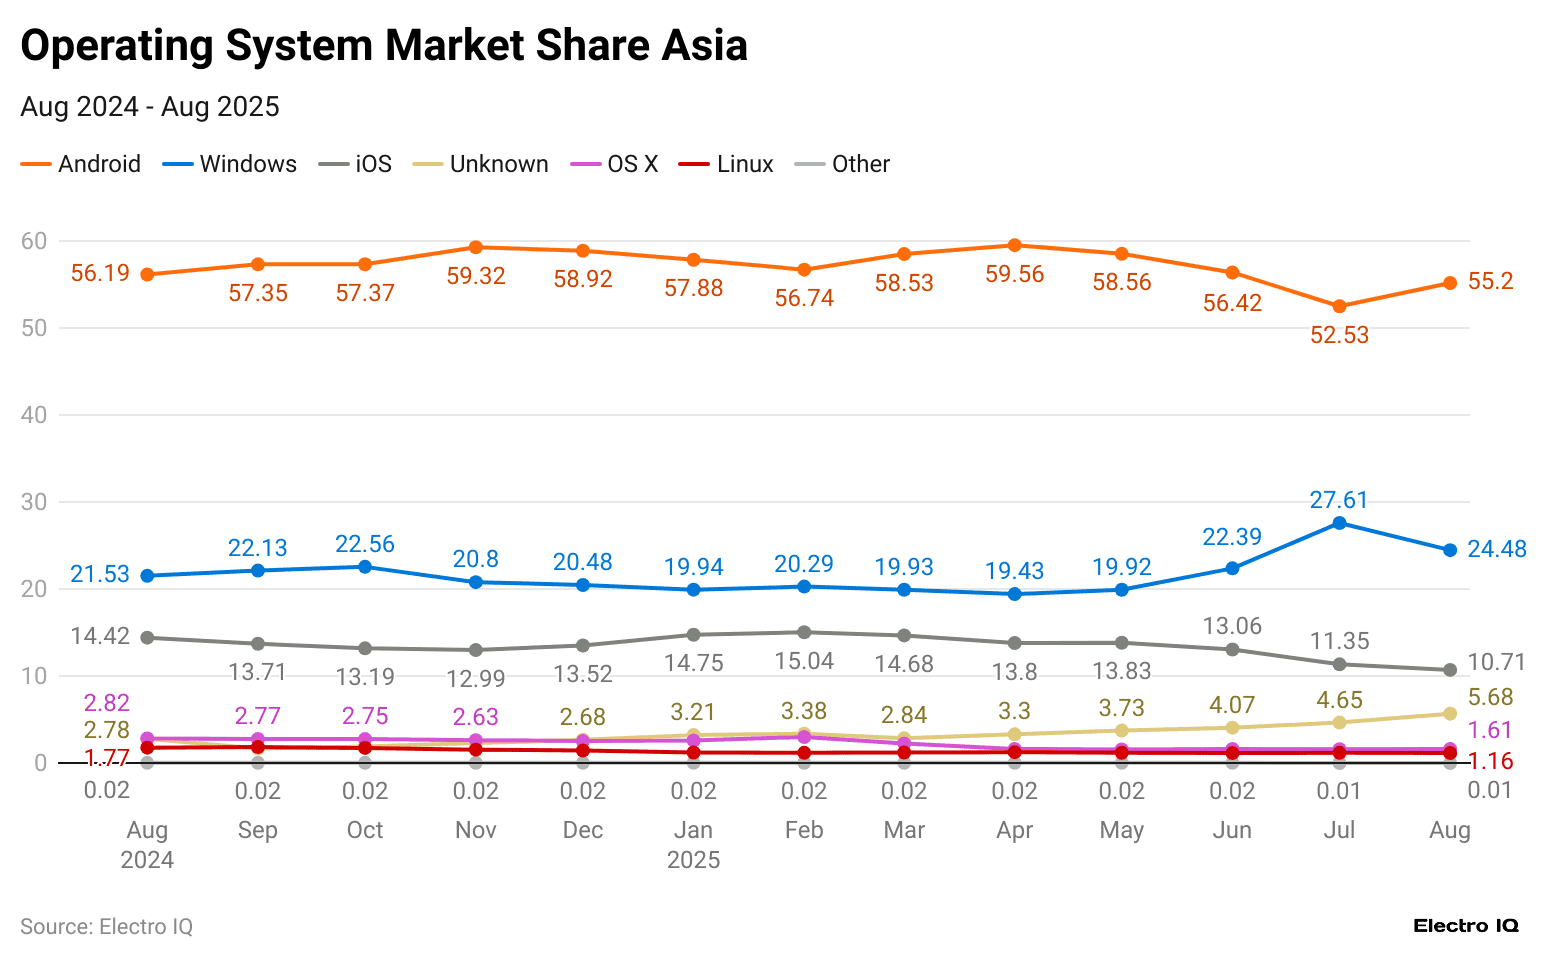
(Reference: statcounter.com)
- In August 2025, Android dominated the operating system market in Asia with a 55.1% share, followed by Windows at 24.56% and iOS at 10.72%.
- Other platforms had smaller shares, including Unknown (5.67%), OS X (1.62%), and Linux (1.17%).
In Europe
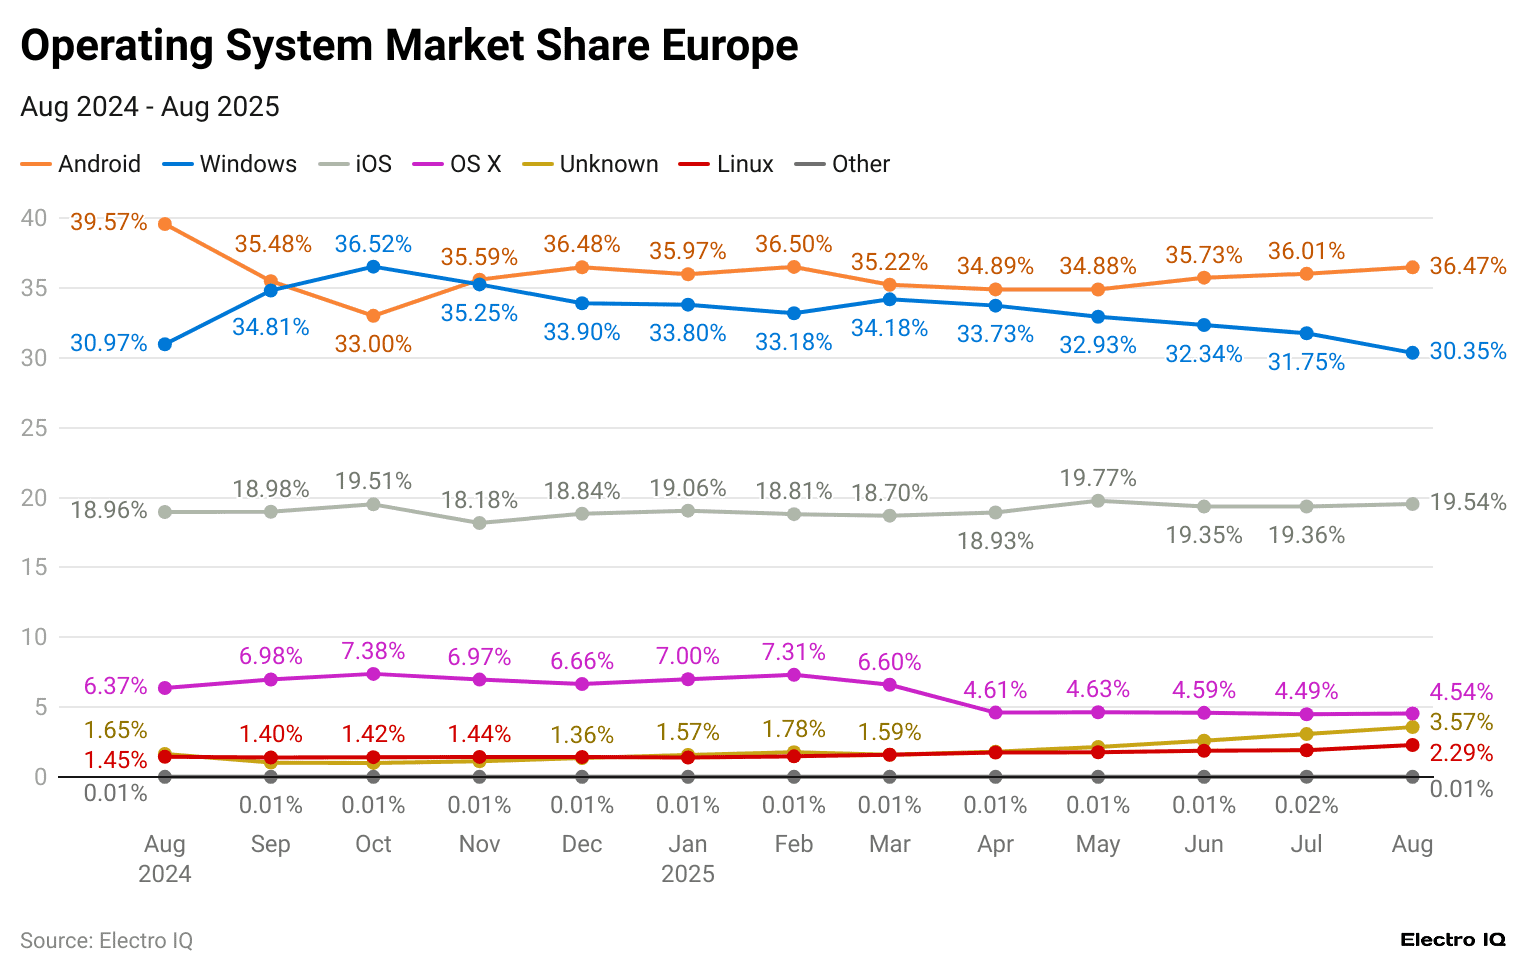 (Reference: gs.statcounter.com)
- Android led the operating system market in Europe with 36.43% share, followed by Windows at 30.47% and iOS at 19.48%.
- Meanwhile, fewer shares were held by OS X (4.53%) and Unknown (3.55%), while macOS accounted for 2.33%.
In Oceania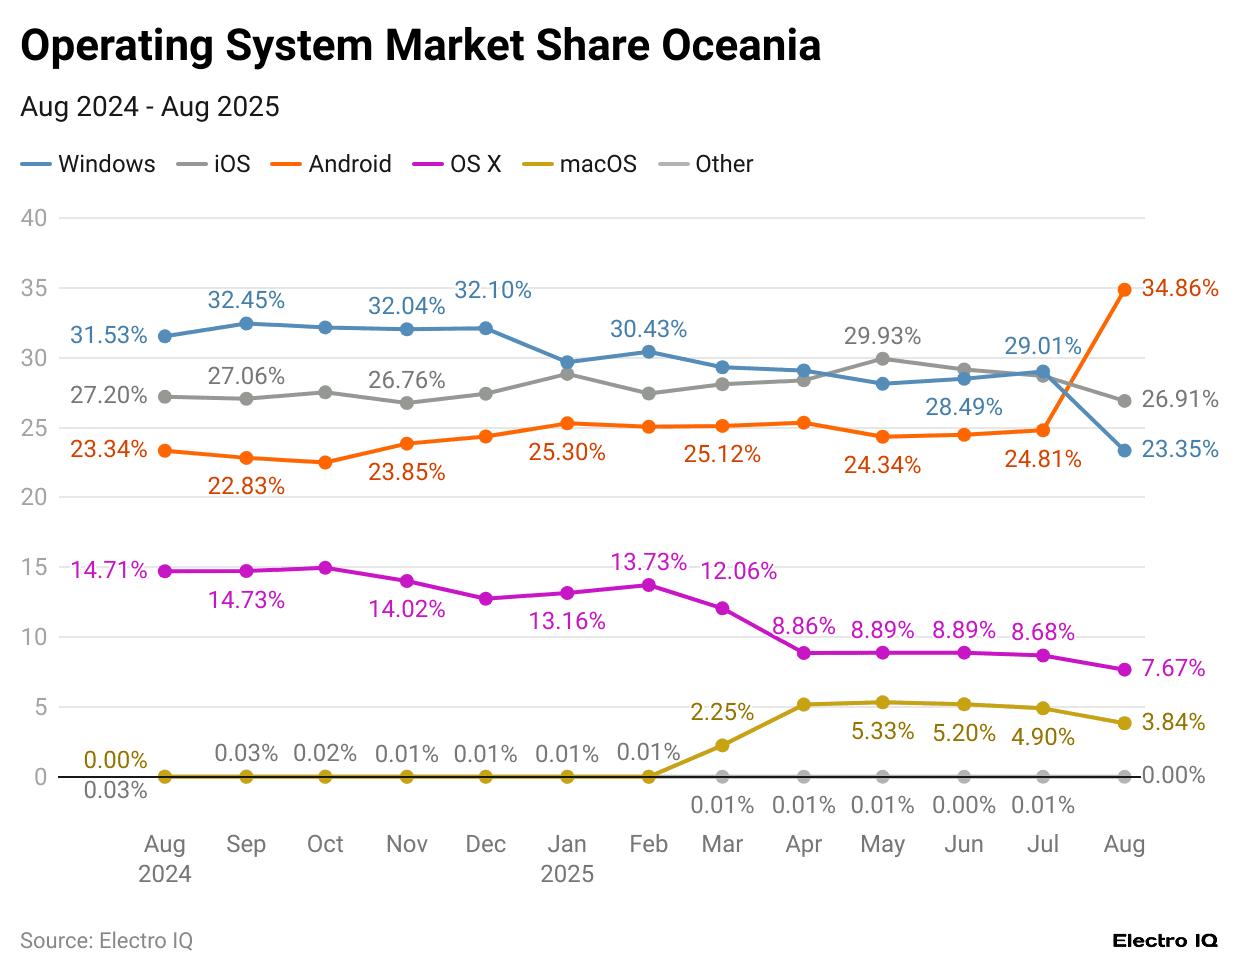
(Reference: statcounter.com)
- As of August 2025, Android held the largest share of the operating system market in Oceania with 35.01%, followed by iOS at 26.89%.
- Windows remained significant at 23.29%, while Apple’s desktop platforms, OS X and macOS, accounted for 7.63% and 3.83% respectively.
- A small portion, around 1.52%, fell under the “Unknown” category.
By Country
- According to Statcounter, in the United States, the operating system usage in August 2025, Windows was the top choice with 32.95%, followed by iOS at 28.14% and Android at 21.06%.
- Other shares included OS X (7.32%), macOS (3.93%), and unknown systems (2.37%).
- In the United Kingdom, Android led with 33.53%, while iOS held 28.61% and Windows 23.08%.
- OS X, unknown systems, and macOS made up 7.45%, 2.68%, and 2.56%, respectively.
- In India, Android dominated with 74.47%, while Windows had 10.45%, unknown systems 8.75%, iOS 3.65%, Linux 1.67%, and macOS only 0.47%.
- In Canada, iOS was slightly ahead with 30.1%, followed by Android at 28.45% and Windows at 25.12%.
- OS X reached 8.8%, macOS 2.93%, and unknown systems 2.04%.
- In Germany, Windows came first with 37.9%, Android followed at 30.39%, iOS stood at 15.06%, OS X at 5.55%, macOS at 3.73%, and Linux at 3%.
Smartphone Shipments by Operating System (From 2017 to 2025)
- According to Wikipedia, in the first quarter of 2025, Android (including forks) dominated smartphone shipments with 76% of units sold.
- Meanwhile, HarmonyOS accounted for 5%, and iOS captured 19%.
The historic numbers are stated in the table below:
| Period | Units sold per quarter | ||
| Android (including forks) | iOS | Others | |
| Q4, 2024 | 74% | 22% | 0% |
| Q1, 2018 | 85.9% | 14.1% | 0% |
| 2017 | 85.9% | 14% | 0.1% |
| Q1, 2017 | 86.1% | 13.7% | 0.2% |
- Between December 2023 and July 2025, Microsoft Windows remained the dominant desktop operating system, though its share decreased from 96.40% in December 2023 to 96.10% in December 2024, 95.45% in May 2025, and 95.23% in July 2025.
- macOS held a small, steady slice of the market, at about 1.63% in December 2023, 1.61% in December 2024, 1.85% in May 2025, and 1.88% in July 2025.
- Linux saw gradual gains over the same period, rising from 1.97% in December 2023 to 2.29% in December 2024, 2.69% in May 2025, and 2.89% in July 2025.
- All other operating systems were negligible, with 0% reported in December 2024 and just 0.01% in May 2025.
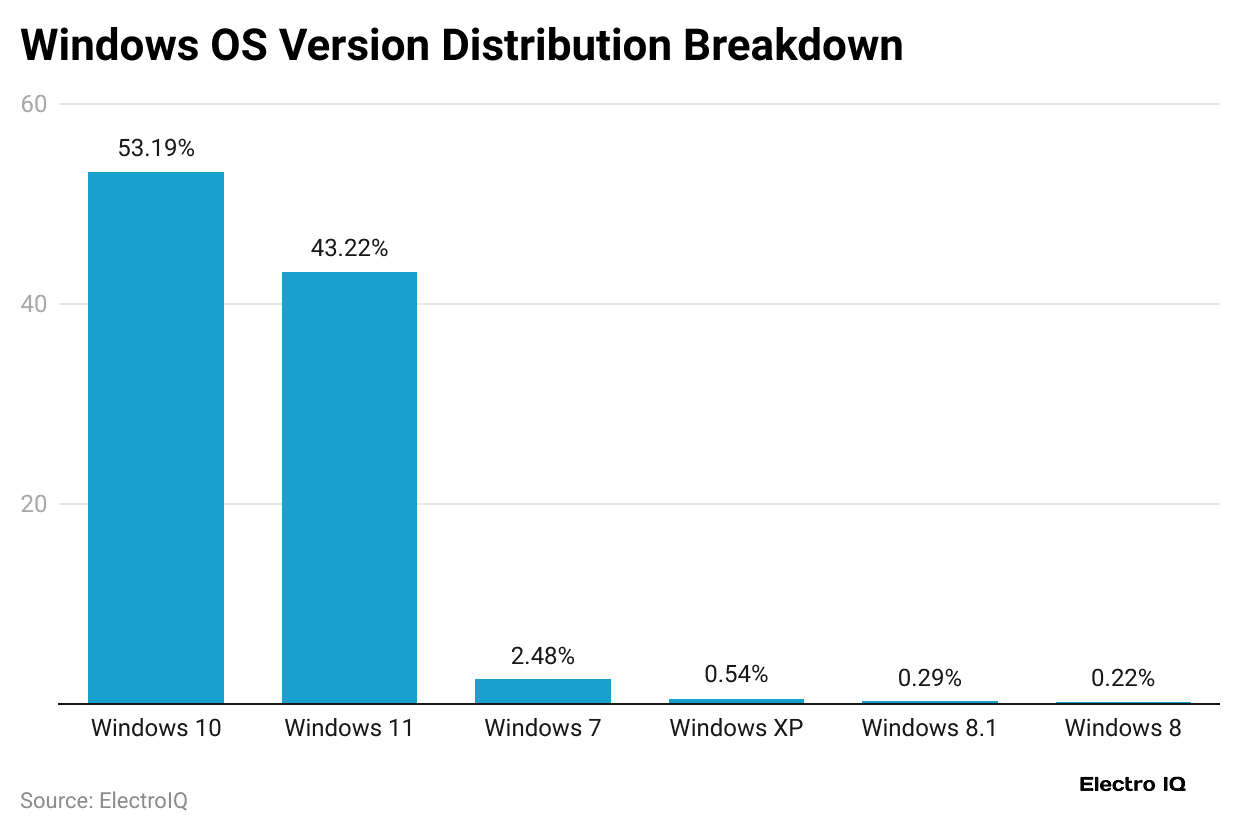
Windows Operating System Version Comparison Statistics
 (Reference: procurri.com)
- Most computers in May 2025 were running Windows 10 or Windows 11, about 53.19% used Windows 1,0, and roughly 43.22% used Windows 11.
- Followed by Windows 7, which made up about 2.48%, Windows XP about 0.54%, Windows 8.1 about 0.29%, and Windows 8 about 0.22%.
Distribution of Developer Operating Systems Statistics
- In 2024, Windows was the most commonly used operating system among developers 59.2% of respondents said they use Windows for personal work, while 47.6% reported Windows as their primary professional workstation, as mentioned in a report shared by Statista.
Other analyses are stated below:
| Operating System | Personal Use | Professional Use |
| macOS | 31.8% | 31.8% |
| Ubuntu (Linux) | 27.7% | 27.7% |
| Windows Subsystem for Linux (WSL) | 17.1% | 16.8% |
| Android | 17.9% | 8.4% |
| iOS | 11.5% | 7.3% |
| Debian / other Linux distros | 9.8% / 8.4% / 8.0% | 9.1% / 8.0% / 4.3% |
| ChromeOS / iPadOS / BSD / legacy Unixes | ChromeOS 1.8% personal / 1.2% pro; iPadOS 5.3% personal / 2.7% pro) | – |
Conclusion
Operating systems are the base of today’s computers, linking hardware and software so that devices work smoothly and safely. They are used everywhere from personal computers and laptops to mobile phones, servers, and even small devices. An OS controls resources, makes user interaction simple, and supports many types of programs. Different systems, whether open-source or paid, have their own strengths, weaknesses, and best uses.
With new trends like cloud services, virtualization, and artificial intelligence, operating systems will stay important in driving future digital growth.
Sources
FAQ.
It makes the computer easy to use, manages resources, and ensures smooth performance.
- Batch Operating System
- Multiprogramming Operating System
- Multi-tasking/Time-sharing Operating Systems
- Multi-Processing Operating System
- Distributed Operating System
- Network Operating System
- Real-Time Operating System
- Mobile Operating System
Open-source (like Linux) is free to use and modify, while proprietary (like Windows or macOS) is paid and closed-source.
32-bit systems use less memory and processing power; 64-bit systems use more and run faster.
Windows is beginner-friendly, while Linux offers more control for advanced users. macOS is simple and stable, but it works only on Apple devices.

Maitrayee Dey has a background in Electrical Engineering and has worked in various technical roles before transitioning to writing. Specializing in technology and Artificial Intelligence, she has served as an Academic Research Analyst and Freelance Writer, particularly focusing on education and healthcare in Australia. Maitrayee's lifelong passions for writing and painting led her to pursue a full-time writing career. She is also the creator of a cooking YouTube channel, where she shares her culinary adventures. At Smartphone Thoughts, Maitrayee brings her expertise in technology to provide in-depth smartphone reviews and app-related statistics, making complex topics easy to understand for all readers.