SEMrush Statistics By User, Revenue and Facts (2025)
Updated · May 15, 2025


Table of Contents
- Introduction
- Editor’s Choice
- SEMrush Users
- SEMrush Paid Users
- SEMrush Free Users
- SEMrush Number Of Tools Growth
- SEMrush Keyword Database
- SEMrush Top Countries With Desktop And Mobile Split
- SEMrush Quarterly Revenue
- SEMrush Revenue By Region
- SEMrush Annual Recurring Revenue
- SEMrush Employee Average Salary
- Conclusion
Introduction
SEMrush Statistics: One of the world’s most trusted and widely used SEO and competitive intelligence tools in digital marketing, SEMrush offers marketers, companies, and agencies the necessary insights to push online growth, from keyword research to backlink analysis. In 2024, SEMrush held on to the crown of the industry leader and took great strides in increasing user base, feature set, and global outreach.
As data-driven marketing gains momentum, SEMrush has become a must-have for any company intent on staying ahead in search rankings and giving tough competition to others. Let’s review the key SEMrush statistics, usage trends, and performance indicators for 2025.
Editor’s Choice
- SEMrush, with 1,166,000 total users in 2024, exhibited long-term growth but recently slowed down considerably. It gained 1.48% from 2023 to 2024 after having 388,000 in 2019.
- Paying users grew from 54,000 in 2019 to 117,000 in 2024, and the increase is steady in conversion from free to paid plans and monetisation.
- Free users, however, increased from 334,000 in 2019 to 1,049,000 in 2024, with rapid growth between 2020 and 2023 and a definite deceleration in 2024, indicating market saturation.
- The number of tools available in SEMrush platforms climbed from just two in 2008 to 50 by 2020, demonstrating the company’s constant commitment to both innovation and diversification of its platform.
- The continuous rise in quarterly revenue throughout the years strongly shows financial growth and product-market fit, from USD 40 million in Q1 2021 to USD 105 million in Q1 2025.
- The revenues by region indicated that the U.S. brought in USD 170.73 million (45.31%) in 2024, and the UK brought in USD 34.38 million (9.12%), but both slightly lost percentage share due to a rise in international diversification.
- SEMrush’s ARR grew from USD 102.6 million in 2019 to USD 411.6 million in 2024, a 300 % increase in six years.
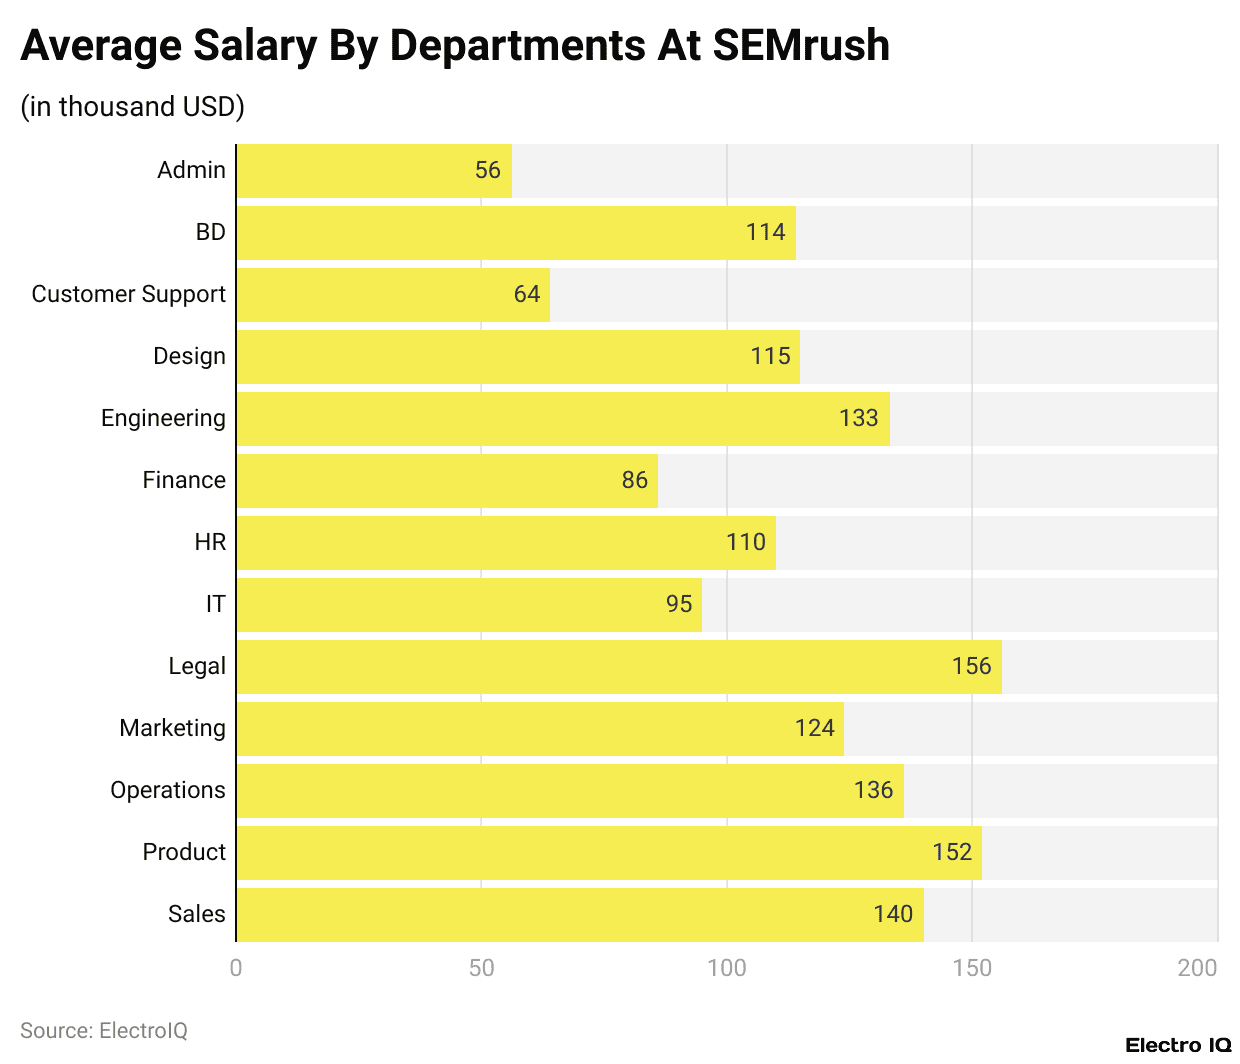
- Employee salaries vary across departments, ranging from USD 56K in Admin to USD 156K in Legal, with Engineering, Product, Sales, and Marketing also at the top in terms of remuneration.
SEMrush Users
| Year | Semrush Total Users |
Growth Percentage
|
| 2019 | 388,000 | – |
| 2020 | 471,000 | 21.39% |
| 2021 | 619,000 | 31.38% |
| 2022 | 898,000 | 45.07% |
| 2023 | 1,149,000 | 27.92% |
| 2024 | 1,166,000 | 1.48% |
(Source: bloggerspassion.com)
- The SEMrush statistics data set gives yearly records of total users of SEMrush from 2019 to 2024, alongside the annual growth percentages.
- In 2019, SEMrush had 388,000 users, climbing to 471,000 in 2020, with a sturdy growth rate of 21.39%. It’s just an even bigger leap in 2021, when 619,000 users were registered, recording an upward lift by 31.38%.
- The largest growth impetus came in 2022, when the user base shot to 898,000—an increase of 45.07%, indicative of an obvious demand for digital marketing tools at that time, probably accelerated by digital transformation and remote working trends.
- By the end of 2023, the user count was registered at 1,149,000, with growth shrinking to 27.92% from its earlier state, signaling a healthy pace of growth, while the market was initiating a stage of maturity.
- By the year 2024, the total number of users was 1,166,000, marking a mere increase of 1.48%.
- This sharp decline in growth percentage suggests the user base is plateauing, maybe caused by market saturation or differing competitive dynamics.
- Thus, overall, the SEMrush statistics data indicate an early rapid adoption of SEMrush, followed by a recent slowdown in growth.
SEMrush Paid Users
| Year |
Semrush Paying Customers
|
| 2019 | 54,000 |
| 2020 | 67,000 |
| 2021 | 82,000 |
| 2022 | 95,000 |
| 2023 | 108,000 |
| 2024 | 117,000 |
(Source: bloggerspassion.com)
- This SEMrush statistics data plots SEMrush’s count of paying customers each year between 2019 and 2024. SEMrush had 54,000 paying customers in 2019.
- Overstudy these numbers; they increased from each year, pointing to revenues in the direction of growth and acceptance in the market.
- The number rose to 67,000 in 2020 and then to 82,000 in 2021. These trends describe a healthy upward direction in user base size and growing trust in the platform’s premium offerings.
- By 2022, the count of paying customers was 95,000; it continued to rise to 108,000 in 2023.
- With 117,000 paying customers recorded by SEMrush in 2024, conversion efforts into paying users are being consummated, though on a flatter trajectory than in years past.
- These SEMrush statistics numbers, together, paint the scenario of steady growth in the monetised user base against the backdrop of the company’s overall expansion and product development.
SEMrush Free Users
| Year |
Semrush Free Customers
|
| 2019 | 334,000 |
| 2020 | 404,000 |
| 2021 | 537,000 |
| 2022 | 803,000 |
| 2023 | 1,041,000 |
| 2024 | 1,049,000 |
(Source: bloggerspassion.com)
- The SEMrush statistics represent the number of SEMrush free customers between 2019 and 2024, exhibiting a steady increase in the adoption of free offerings of the platform.
- 2019 saw 334,000 free users, and this increased to 404,000 in 2020, suggesting increased interest, probably triggered by increased awareness and increased importance of digital tools seen in the early pandemic period.
- This free-user number further increased to 537,000 in 2021, followed by a big jump to 803,000 in 2022. This jump performance in 2022 induced a spike in trial usage, probably related to marketing, the scope of tool access, or a shift to online-oriented global business models.
- There were 1,041,000 free customers in 2023, sustaining the growing demand-side strategies, especially among small businesses, freelancers, and early-stage treatment users.
- In 2024, however, free customers grew by a much smaller margin, reaching 1,049,000. This suggests that while SEMrush remains popular, growth in free accounts may be starting to plateau as the platform reaches mass-market saturation or loses more users to conversion into paid plans.
- All in all, these figures tell the story of a powerful, steadily increasing interest in SEMrush’s free features, especially in recently accelerated digital times.
SEMrush Number Of Tools Growth

(Source: bloggerspassion.com)
- According to SEMrush statistics, between 2008 and 2020, one could see an unmistakable pattern of steady growth and expansion in the SEMrush platform since its inception.
- In 2008, SEMrush consisted of two core tools. This number doubled to four in 2012, during which the platform was still in its early developmental stages and gradually enhanced its feature set.
- One more tool was added in 2013, making it five, reflecting a cautious and gradual approach to increasing functionality.
- The true accelerated growth period started with 8 tools in 2014. By 2015, the number of tools increased to 11. It almost doubled to 21 in 2016, positioning SEMrush for more strategic growth to counter larger user needs alongside increasing demand in the field of digital marketing.
- In 2017, the increase hit 27 tools, still maintaining the upward progression. By 2018, the platform had 39 tools and witnessed a major surge that further aided Semrush’s position as a full-fledged marketing suite.
- This was followed by an increase to 43 in 2019 and 50 escapes in 2020, an enormous milestone. Such constant growth represents innovation and diversification in allowing the users to have a more versatile pool of solutions for SEO, PPC, content marketing, social media, and competitive research.
- This evolution alludes to how SEMrush expanded from being a simple SEO tool to becoming a full digital marketing platform.
SEMrush Keyword Database
- The SEMrush statistics graph represents the rise in stored keywords in the SEMrush Keyword Database from 2017 to 2025.
- SEMrush had about 819 million keywords in 2017. However, this number more than quintupled in 2018, reaching 4.4 billion, probably aided by major infrastructural upgrades and expansion into new languages and markets.
- It doubled yet again in 2019 to 10.5 billion keywords, which underscored an aggressive scaling and broader coverage of search queries.
- It continued to increase with new data investments to 18.8 billion keywords by 2020, possibly accelerated by global digital content explosions during the pandemic.
- Growth then slowed somewhat to 20 billion in 2021, suggesting a much smaller increase but still huge.
- By 2022, the count increased further to 22.3 billion by 2023, showing steady year-on-year expansion.
- The year 2024 witnessed an increase to 25.9 billion, with a further jump to 26.5 billion predicted for 2025.
- The more recent, smaller year-on-year increases suggest that the database is reaching maturity in terms of breadth, with incremental additions likely focusing on accuracy maintenance, regional updates, and depth improvement rather than mere expansion of core coverage.
SEMrush Top Countries With Desktop And Mobile Split
| Country | Desktop Keywords |
Mobile Keywords
|
| United States | 160 million |
45.1 million
|
| United Kingdom | 24.1 million | 3.6 million |
| France | 23.9 million | 3.6 million |
| Germany | 23.7 million | 3.5 million |
| Brazil | 20.1 million | 3 million |
| Japan | 20 million | 2.9 million |
| Canada | 19.5 million | 2.9 million |
| Spain | 19.4 million | 2.9 million |
| India | 18 million | 2.6 million |
| Australia | 17.4 million | 2.1 million |
(Source: bloggerspassion.com)
- The SEMrush statistics data gives us a picture of how SEMrush keyword tracking was distributed across desktop and mobile operating systems in the top ten countries.
- The widest gap is observed in the USA, which records approximately 160 million desktop keywords against 45.1 million on mobile, suggesting a preference or indeed higher demand for desktop search data.
- Followed by the UK, desktop keywords are approximately 24.1 million against 3.6 million on mobile, hence a similar desktop dominance.
- France and Germany also appear to show similar patterns, with almost 24 million desktop keywords and around 3.5 to 3.6 million on the mobile front.
- In contrast, Brazil, Japan, and Canada witnessed approximately 20 million desktop keywords and 2.9 to 3 million mobile keywords, thereby maintaining a relatively similar proportion between platforms.
- They are followed by Spain, India, and Australia, with desktop keyword tracking ranging from 17.4 million to 19.4 million and mobile keywords ranging from 2.1 million to 2.9 million.
- In all of the countries stated above, desktop keyword tracking far outranks mobile, suggesting the dominance of desktop search marketing analysis in SEMrush’s global data set, even as mobile visibility classic grows.
SEMrush Quarterly Revenue

(Source: demandsage.com)
- According to SEMrush statistics, quarterly revenue data for SEMrush from Q1 2021 through Q1 2025 indicate clear, consistent revenue growth.
- Semrush’s revenues in Q1 2021 were USD 40 million, rising steadily in Q2 to USD 45 million and then USD 49.3 million in Q3.
- Entering Q4, USD 53.7 million was reported as revenues, and the quarter showed good performance, with all revenues performing well concerning the previous quarter.
- The company carried the momentum well into 2022, and revenues continued to rise in Q1 to USD 57.1 million, in Q2 to USD 62.6 million, in Q3 to USD 65.8 million, and in Q4 to USD 68.8 million, maintaining a good increment all year.
- These SEMrush statistics trends continued in 2023. Revenues stood at USD 70.9 million in Q1 and then moved up to USD 74.7 million in Q2.
- Revenues of USD 78.7 million and USD 83.4 million were registered in quarters Q3 and Q4, respectively, indicating good customer retention with more user adoption.
- Continuing on, Semrush’s revenues kept the upward trajectory in 2024, with USD 85.8 million in Q1 and USD 91 million in Q2. Revenues hit USD 97.4 million in Q3 and then crossed the USD 100 million mark with a quarterly revenue of USD 102.6 million in Q4.
- This late 2024 growth extended into Q1 2025 with SEMrush’s revenue touching USD 105 million.
- This paints the picture of continuous growth over quarterly revenues driven by augmenting features, growing enterprise adoption, and incessant demand for SEO and digital marketing tools.
SEMrush Revenue By Region
- Such revenue data from SEMrush between the years 2019 and 2024 shows the dominance of the United States and the United Kingdom as major markets.
- While the company earned USD 42.16 million from U.S. customers in 2019, this accounted for 45.78% of the total revenue in that year.
- The numbers then kept rising steadily to USD 57.23 million in 2020 (or 45.83%), then USD 85.64 million in 2021 (or 45.55%), and then USD 119.78 million in 2022 (or 47.1%).
- Then, the trend went on to reach USD 146.4 million in 2023 (or 47.58%), eventually peaking at USD 170.73 million in 2024, although being a tad smaller fraction of overall revenue at 45.31%.
- The revenue from the UK also moved almost in parallel upward. In 2019, SEMrush earned USD 10.19 million from UK customers, representing 11.06% of its total revenue.
- This increased to USD 13.16 million in 2020 (10.54%), USD 19.63 million in 2021 (10.44%), and USD 25.67 million in 2022 (10.09%).
- By 2023, revenues from the UK had increased to USD 30.04 million (9.76%) and reached USD 34.38 million in 2024, or 9.12% of total revenues.
- Both U.S. and UK revenues have been going up every year in absolute terms, but their percentage share of total revenues has been showing a marginal decline in recent years, pointing to an increased contribution from other international markets to SEMrush’s overall earnings.
- This signifies that SEMrush has been moving toward a diversified customer base while exhausting its core English-speaking markets.
SEMrush Annual Recurring Revenue

(Reference: backlinko.com)
- The numbers show a steady rise in Semrush’s ARR from 2019 through 2024. In 2019, the ARR was listed at USD 102.6 million.
- In 2020, the level went to USD 144.2 million, which was a significant jump, depicting the increased demand for digital marketing solutions.
- The upward movement strongly continued into 2021, whereby the ARR reached USD 215.7 million-USD 71 million higher than the one recorded in the previous year.
- By 2022, SEMrush’s ARR soared to USD 275.1 million, showing that growth went on, although it was somewhat stabilizing by then.
- The 2023 figure of USD 337.1 million marks the continued increase of USD 60 million+, pointing to the platform’s prowess for keeping momentum despite fierce market competition.
- For the year 2024, SEMrush earned an ARR of USD 411.6 million, which speaks of consistency in financial performance and retention of customers in surplus.
- During these six years, SEMrush managed to grow the ARR by 300+%, which underscores its ability to scale services successfully, grow its customer base, and emphasize the value businesses place on SEO and digital marketing intelligence.
SEMrush Employee Average Salary
(Reference: demandsage.com)
- The average salaries by department at SEMrush vary widely, which is essentially due to the nature and complexity of each role.
- Administrative staff, with an average salary of USD 56K, earn the lowest, being support-level. Customer Support then comes next at USD 64K, which is indeed service-oriented.
- Design and Business Development roles commanding USD 115K and USD 114K mean they garner strong appreciation for creativity and the ability to forge strategic partnerships.
- Human Resources professionals earn an average of USD 110K, while Finance professionals earn USD 86K, suggesting a more middle-range bracket for these internal operational roles.
- Information Technology offers an average salary of USD 95K, while Engineering commands a pricier average of USD 133K, reflecting the technical knowledge required.
- This hall-of-fame chart is capped by Legal on an average of USD 156K, which shows the level of special expertise and management of liabilities that go with it.
- Product and Operations salaries round off the top averages at USD 152K and USD 136K, respectively, given their strategic and execution cores of the key corporate agenda.
- Marketing jobs average about USD 124K, demonstrating big investments in growth and brand outlay. Sales, the department driving revenue, can hold an average of USD 140K, thereby definitely placing itself among the best-compensated departments.
- All in all, the structure is well laid out and acts as an important incentive. Each department’s compensation is aligned with industry standards and reflects its strategic position in the organisation itself.
Conclusion
SEMrush is still a pillar in the digital marketing ecosystem. Its expansive toolkit, reliable data, and innovation-centric approach have made it an option for enterprises of all sizes. As per SEMrush statistics, the company is validating its ability to keep evolving with market needs through a user count and revenue in 2024. With AI-driven features, mobile growth, and a strong global presence, SEMrush is set to remain a leader in the SEO and digital intelligence landscape for years to come.
FAQ.
As of 2024, SEMrush has 1,166,000 total users, a sharp rise from 388,000 in 2019. The platform saw rapid growth between 2019 and 2022, with its user base peaking in expansion during 2022. However, growth has significantly slowed recently, with only a 1.48% increase from 2023 to 2024, suggesting a maturing or saturated market.
In 2024, SEMrush had 117,000 paying users, up from 54,000 in 2019. This steady increase in premium users reflects successful monetisation strategies and user conversion from free to paid plans, though the growth rate has slowed in recent years.
SEMrush’s keyword database expanded massively from 819 million in 2017 to 25.9 billion in 2024, with a projected growth to 26.5 billion by 2025. While growth has slowed, the current scale reflects strong infrastructure and a shift from breadth expansion to depth, accuracy, and regional refinement.
The United States has been SEMrush’s biggest market with US$170.73 million (45.31%) in 2024 revenue. The second is the United Kingdom, which has US$34.38 million (9.12%). In line with global diversification, their share of total revenue has been gradually hampered in favour of increased revenues from other foreign markets.
The Annual Recurring Revenue (ARR) of SEMrush has reached US$102.6 million in 2019 and US$411.6 million in 2024 (US$102.6 million versus US$411.6 million), which is more than 300% growth within six years. This development path assures retention in agreements for their clients, extending product offerings, and more enterprise adoption within SEO and digital marketing areas.

Joseph D'Souza founded ElectroIQ in 2010 as a personal project to share his insights and experiences with tech gadgets. Over time, it has grown into a well-regarded tech blog, known for its in-depth technology trends, smartphone reviews and app-related statistics.