Website Statistics and Facts By Device, Region, Language, Visitors And User Experience (2025)
Updated · Feb 24, 2026

Table of Contents
- Introduction
- Editor’s Choice
- Share of Traffic to Top 10,000 Websites
- Top 20 Most Visited Websites Analysis
- Top Types of Websites Visited and Apps Used
- Most Popular Top-Level Websites
- Most Popular eCommerce and Shopping Websites Analyses
- Global Website Visits of AI Tools
- Leading Video Streaming Websites Analyses
- Website Engagement and Conversion Statistics
- Website Traffic Statistics By Device
- Mobile Website Traffic Share Statistics
- Number of New Websites Created Over Time
- Website Statistics by Region
- Global Website Language Distribution
- Global Search Engine Market Share Statistics
- Monthly Unique Visitors Distribution in Websites
- Website User Experience Statistics
- Conclusion
Introduction
Website statistics: Website statistics give a clear picture of how a site is doing and how people use it. They highlight a detailed picture of the number of visitors, the total time spent on the site, and the pages viewed. Studying this data helps website owners understand which parts are successful and which areas need changes. In today’s digital world, such data goes beyond plain figures as it shows what works and what needs improvement.
With the help of these insights, organizations can shape better strategies, grow their online reach, and stay ahead of competitors. Simply put, website statistics turn visitor behavior into useful guidance for building stronger, more effective websites that serve both users and businesses.
Editor’s Choice
- Currently, there are about 1.2 billion websites globally, of which only 16% are active, while the remaining 84% are inactive.
- Around 252,000 new websites go live each day.
- That equals about 10,500 new websites every hour, and in just one minute, roughly 175 websites are created, and every second, about three websites appear online.
- By the time you finish reading this, over 2,000 new websites will already exist.
- In the United States alone, there are nearly 146.4 million websites.
- Google.com is the busiest site online, with about 105 billion visits each month in 2025.
- On average, people browse 6 to 10 web pages daily.
- Around 73% of businesses now run their own websites.
- Website Statistics also show that most websites see a conversion rate between 2% and 4%.
- Around 5.65 billion people worldwide use the internet today.
- Mobile devices account for 63.05% of all online traffic.
- Together, China and India have about 1.96 billion internet users.
- Facebook sends 71.58% of social referral traffic to websites.
- Lastly, organic search is responsible for 53% of total website visits.
 (Reference: squarespace-cdn.com)
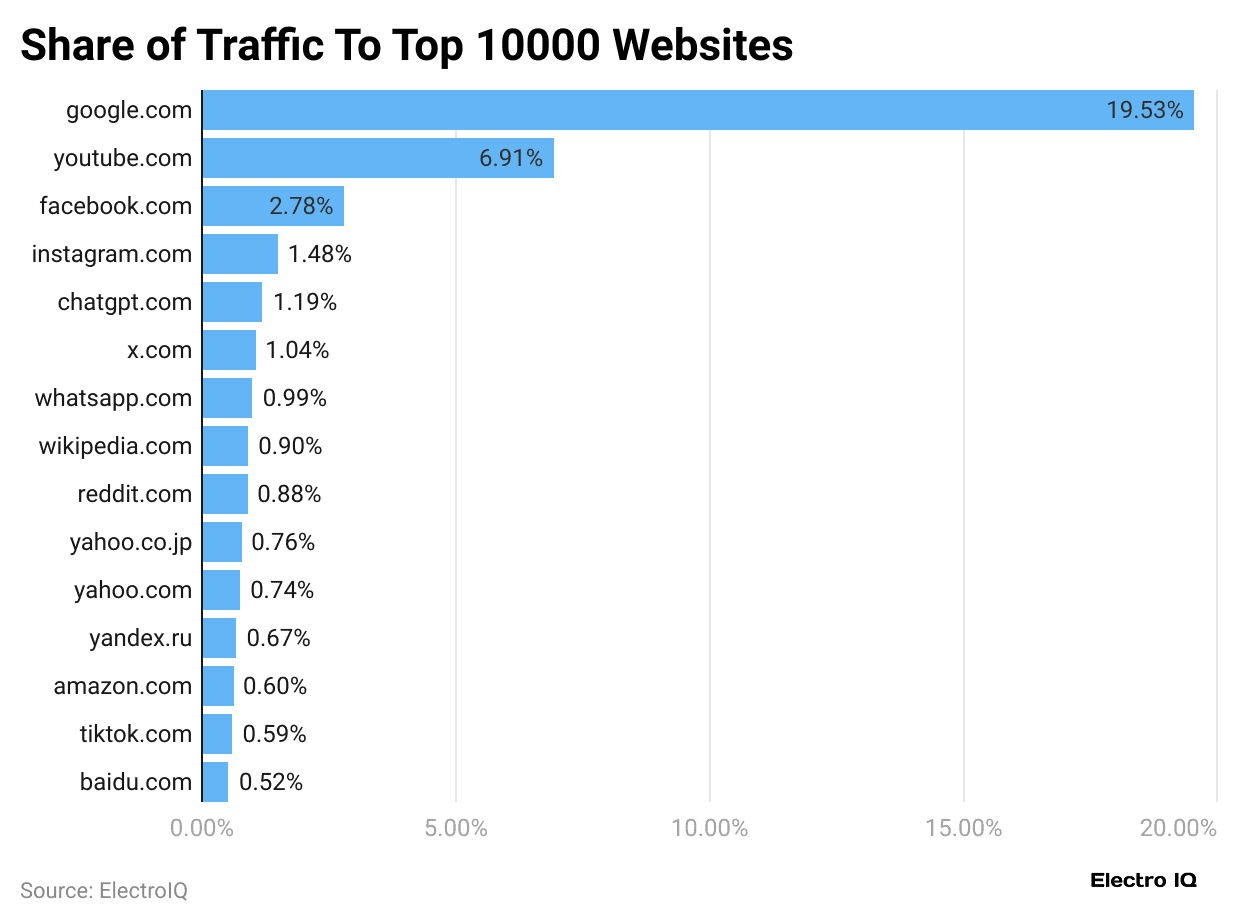
- In July 2025, Google.com led with 19.53% of global traffic, followed by YouTube (6.91%) and Facebook (2.78%), while Instagram, ChatGPT, X.com, and WhatsApp each held around 1%.
- Followed by Wikipedia (0.98%), Reddit (0.88%), Yahoo.co.jp (0.76%), Yahoo.com (0.74%), Yandex (0.67%), along with Amazon (0.60%), TikTok (0.59%), and Baidu (0.52%).
Top 20 Most Visited Websites Analysis
- In August 2025, Google.com remained the world’s most visited website with more than 98.22 billion visits.
- Each visitor viewed about 5.31 pages per visit, showing strong engagement.
- The site also kept a relatively low bounce rate of 37.02%,
Furthermore, other websites’ monthly traffic is mentioned in the table below:
| Websites | Visits | Pages / Visit | Bounce rate |
| youtube.com | 48,112,196,329 | 8.83 |
31.39% |
| 9,676,753,447 | 7.01 | 48.56% | |
| instagram.com | 5,553,730,889 | 8.6 |
51.27% |
| 5,381,168,552 | 4.03 | 42.09% | |
| reddit.com | 4,879,409,733 | 3.4 |
59.51% |
|
wikipedia.org |
4,665,565,517 | 3.14 | 58.6% |
| yahoo.com | 3,941,822,537 | 3.5 |
50.26% |
|
x.com |
3,766,400,625 | 8.04 | 48.9% |
| whatsapp.com | 2,676,226,706 | 5.55 |
60.89% |
| 2,671,790,963 | 6.97 | 41.19% | |
| bing.com | 2,363,931,070 | 4.55 |
42.26% |
|
search.yahoo.com |
2,329,649,973 | 2.49 | 51.93% |
| duckduckgo.com | 2,155,898,721 | 2.71 |
50.35% |
|
temu.com |
2,078,486,702 | 2.91 | 61.45% |
| tiktok.com | 1,998,960,000 | 7.17 |
53.06% |
|
yahoo.co.jp |
1,965,801,480 | 6.02 | 34.93% |
| yandex.ru | 1,769,034,702 | 4.46 |
48.81% |
|
weather.com |
1,675,421,469 | 1.49 | 74.4% |
| msn.com | 1,448,731,783 | 3.47 |
45.79% |
Top Types of Websites Visited and Apps Used
 (Reference: squarespace-cdn.com)
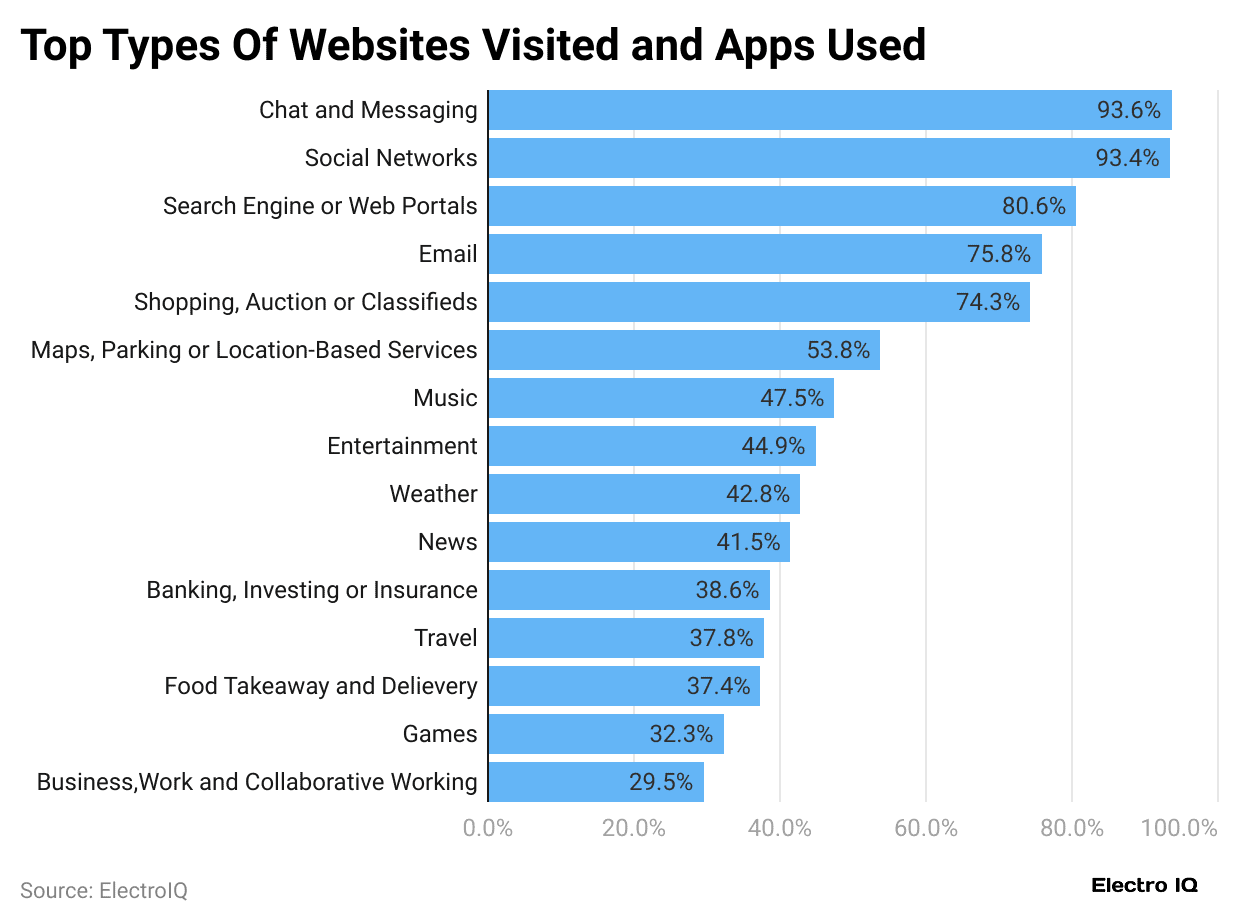
- In July 2025, chat and messaging platforms emerged as the most visited digital spaces, with 93.6% of internet users aged 16+ engaging with them.
- Social networks were used by 93.4% of users, followed by search engines (80.6%), email (75.8%), shopping sites (74.3%), and maps or location-based services (53.8%).
- Other popular categories included music (47.5%), entertainment (44.9%), weather (42.8%), news (41.5%), banking (38.6%), travel (37.8%), food delivery (37.4%), online games (32.3%), and business, work & collaborative working (29.5%).
Most Popular Top-Level Websites
 (Reference: digitalsilk.com)
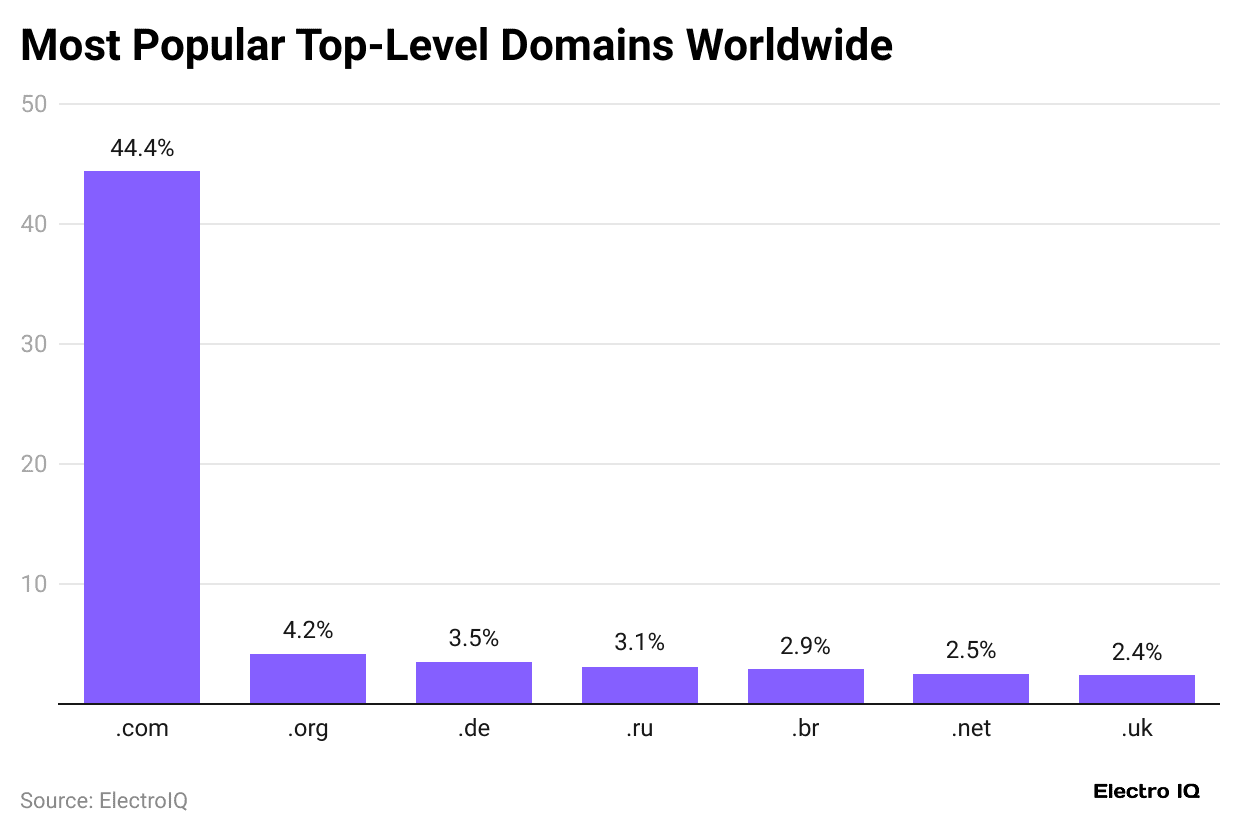
- The .com website leads significantly, holding 44.4% of the global share, making it the most widely used TLD.
- Meanwhile, other popular website shares are followed as .org (4.2%), .de (3.5%), and .ru (3.1%), .br (2.9%), .net (2.5%), and .uk (2.4%).
Most Popular eCommerce and Shopping Websites Analyses
 (Reference: digitalsilk.com)
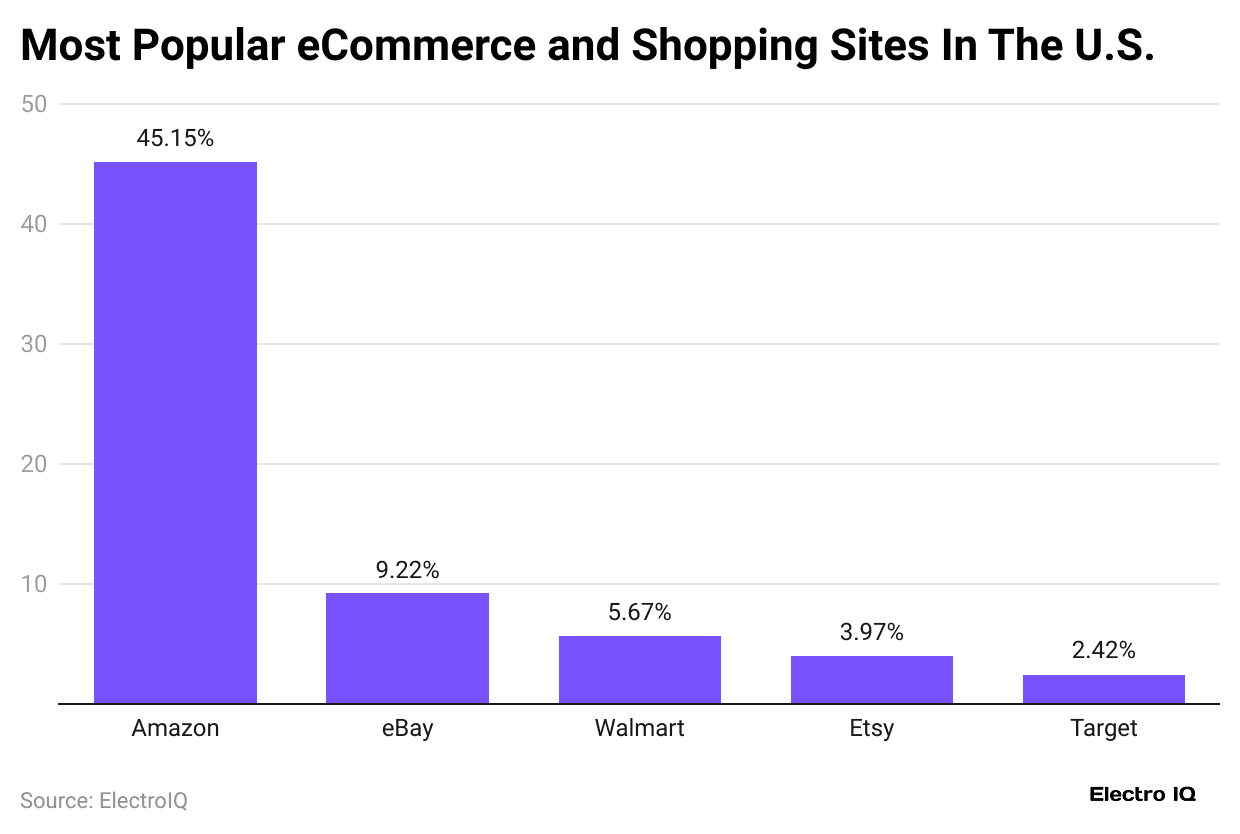
- As of 2025, in the United States, the e-commerce market leader Amazon leads with a huge 45.15% share of visits.
- Meanwhile, eBay (9.22%), Walmart (5.67%), Etsy (3.97%), and Target (2.42%).
Global Website Visits of AI Tools
 (Reference: digitalsilk.com)
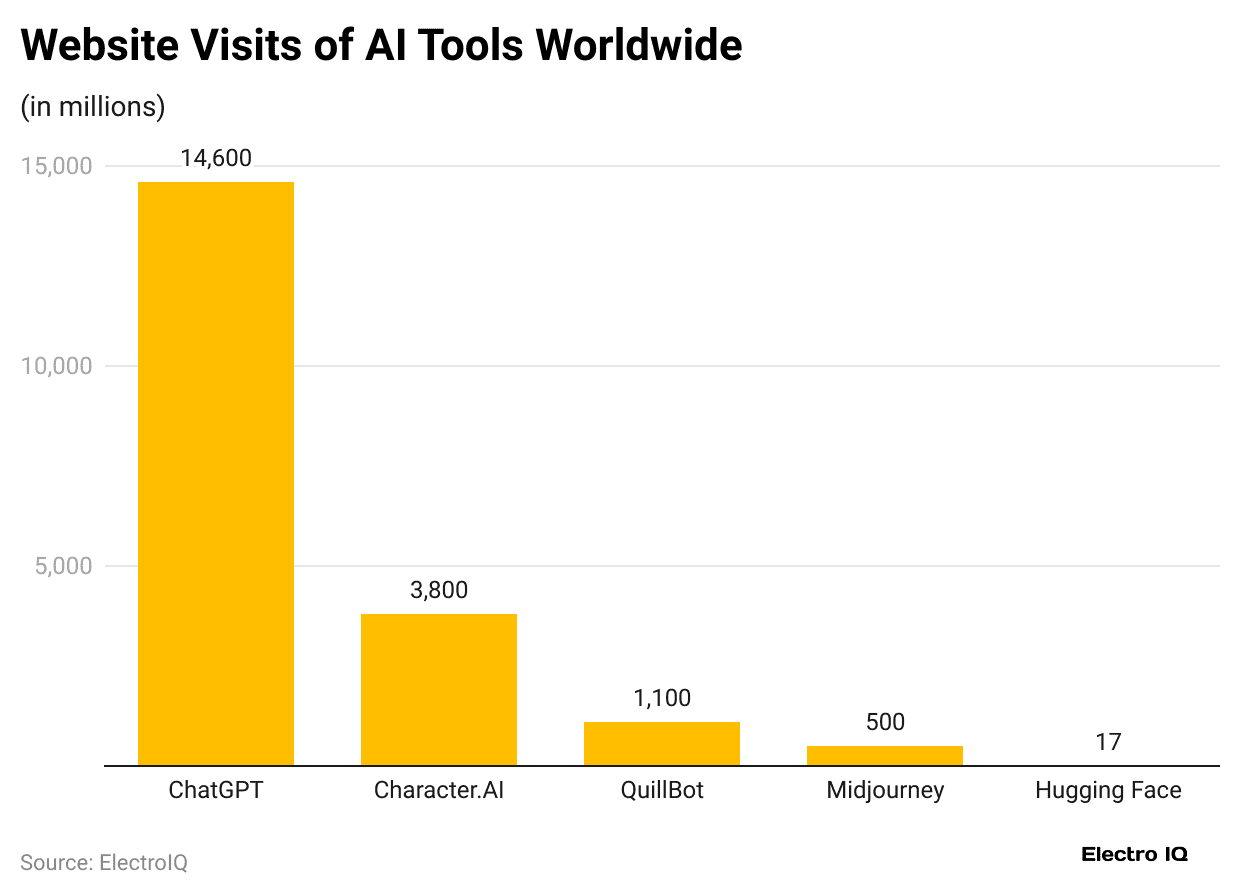
- As of 2025, ChatGPT leads the global AI tools market with an impressive 14,600 million visits.
- AI follows with 3,800 million visits, while QuillBot records 1,100 million.
- Besides, MidJourney sees 500.4 million, and Hugging Face attracts 316.6 million visits.
Leading Video Streaming Websites Analyses
 (Reference: statista.com)
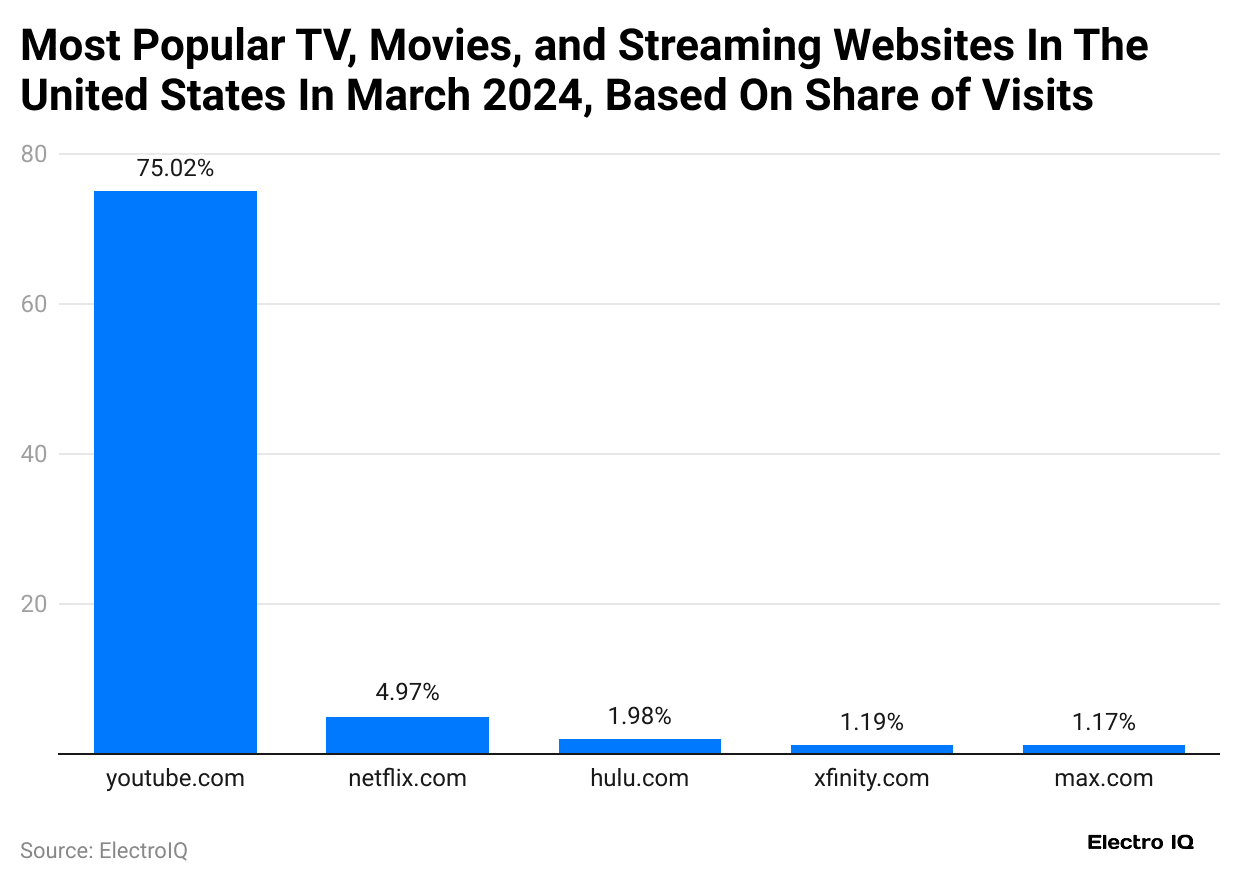
- In March 2024, YouTube was the top video streaming site in the U.S., holding over 75% of desktop traffic in the arts and entertainment category.
- Meanwhile, others are followed by Netflix with 5.23%, Hulu (1.98%), Xfinity (1.19%) and Max (1.17%).
Website Engagement and Conversion Statistics
- E-commerce sites generally have a conversion rate between 1.84% and 3.71%.
- On the other hand, B2B sites tend to see higher conversion rates, ranging from 2.35% to 4.31%.
- As mentioned in Website Statistics, the average click-through rate across all industries is 6.64%.
- Users typically stay on pages with video for about 6 minutes, while they spend only 4.3 minutes on pages without video.
- 86% of visitors prefer to find details about products or services right on the homepage. The design of the homepage has a huge impact, influencing 94% of a business’s first impressions.
- If a webpage is too cluttered or has too many elements, conversions can drop by up to 95%.
- People usually form an opinion of a website in just 0.5 seconds.
Website Traffic Statistics By Device
 (Reference: demandsage.com)
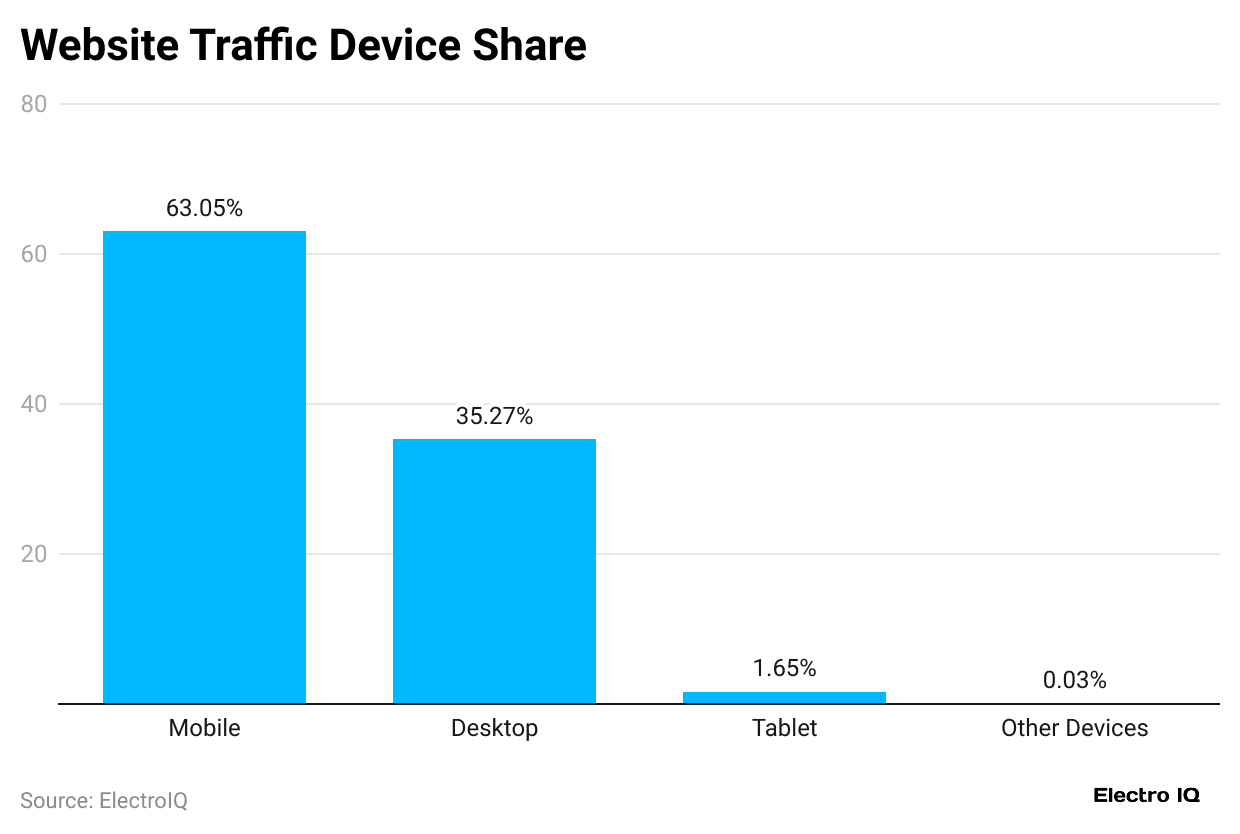
- As of 2025, mobile devices lead in generating web traffic with a 63.05% share.
- Desktops account for 35.27% of traffic, tablets add 1.65%, and other devices make up just 0.03%.
- Demand Sage reports that mobile web traffic has increased a lot over time, rising from 32.79% in 2015 to 63.05% in 2025.
- In 2023, the traffic share accounted for 50.43% and sharply climbed to 60.06% in 2024.
Number of New Websites Created Over Time
- Exploding Topics further states that the internet continues to expand rapidly, with about 5.4 million new websites created every month.
- Every week, about 1.21 million websites are created, nearly 177,372 daily.
- This equals roughly 7,390 per hour, or close to 123 new sites each minute.
Website Statistics by Region
 (Reference: buttercms.com)
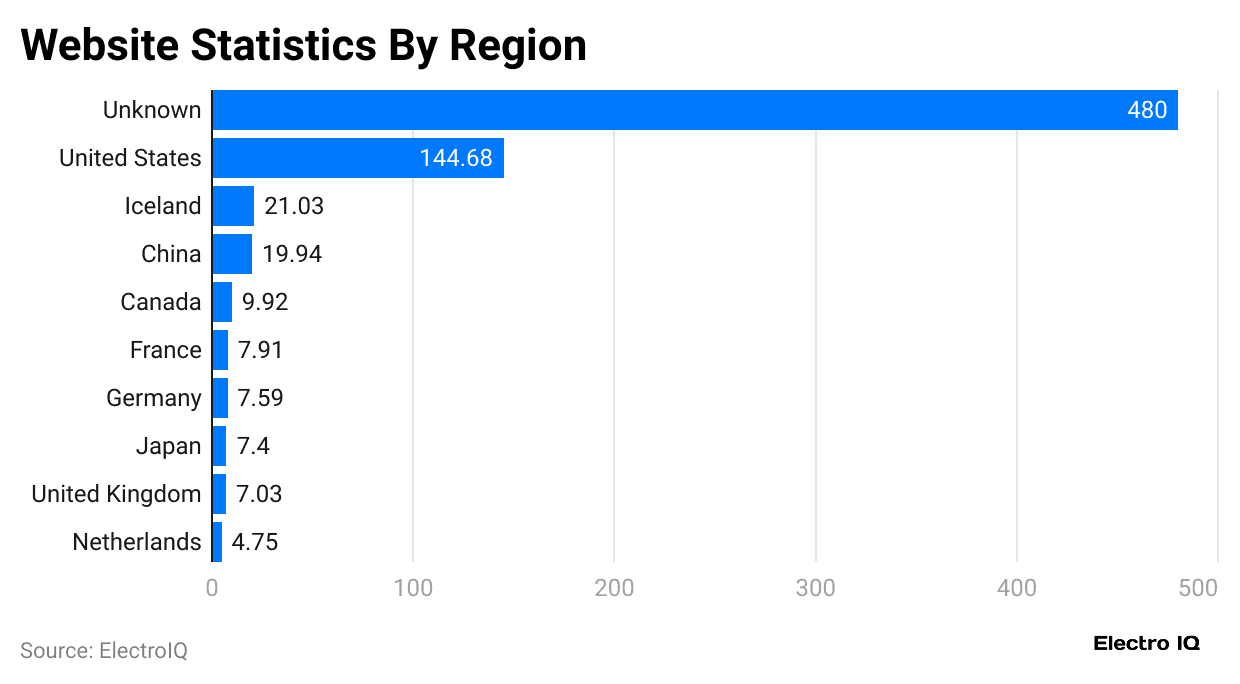
- The United States holds 144.68 million domains (18.65%), followed by Iceland (21.03 million, 2.71%) and China (19.94 million, 2.57%).
- Other countries’ website shares are followed by Canada (9.92 million, 1.28%), France (7.91 million, 1.02%), Germany (7.59 million, 0.98%), Japan (7.40 million, 0.95%), the United Kingdom (7.03 million, 0.91%), and the Netherlands (4.75 million, 0.61%).
Global Website Language Distribution
- English dominates the internet, powering 52.1% of all websites, far ahead of other languages.
- Spanish ranks second with 5.5%, followed by German (4.8%), Russian (4.5%), Japanese (4.35%), and French (4.3%).
- Additionally, Portuguese holds 3.1%, Italian 2.3%, Turkish 2.1%, Dutch/Flemish 1.8%, Polish 1.6%, Persian 1.5%, Chinese 1.3%, Vietnamese 1.2%, Indonesian 1.1%, Czech 0.9%, Korean 0.8%, Ukrainian 0.6%, and Arabic 0.6% of global websites.
- In 2024, Google maintained its dominance with 91.06%, though it declined slightly in 2025 to 89.57%.
Meanwhile, other search engine websites are listed in the table below:
| Search Engine | 2025 | 2024 |
| 89.57% | 91.06% | |
| Bing | 3.98% | 3.72% |
| Yandex | 2.51% | 1.45% |
| Yahoo | 1.33% | 1.26% |
| Baidu | 0.82% | 0.87% |
| DuckDuckGo | 0.69% | 0.60% |
| Naver | 0.31% | 0.39% |
| Others | 0.79% | 0.65% |
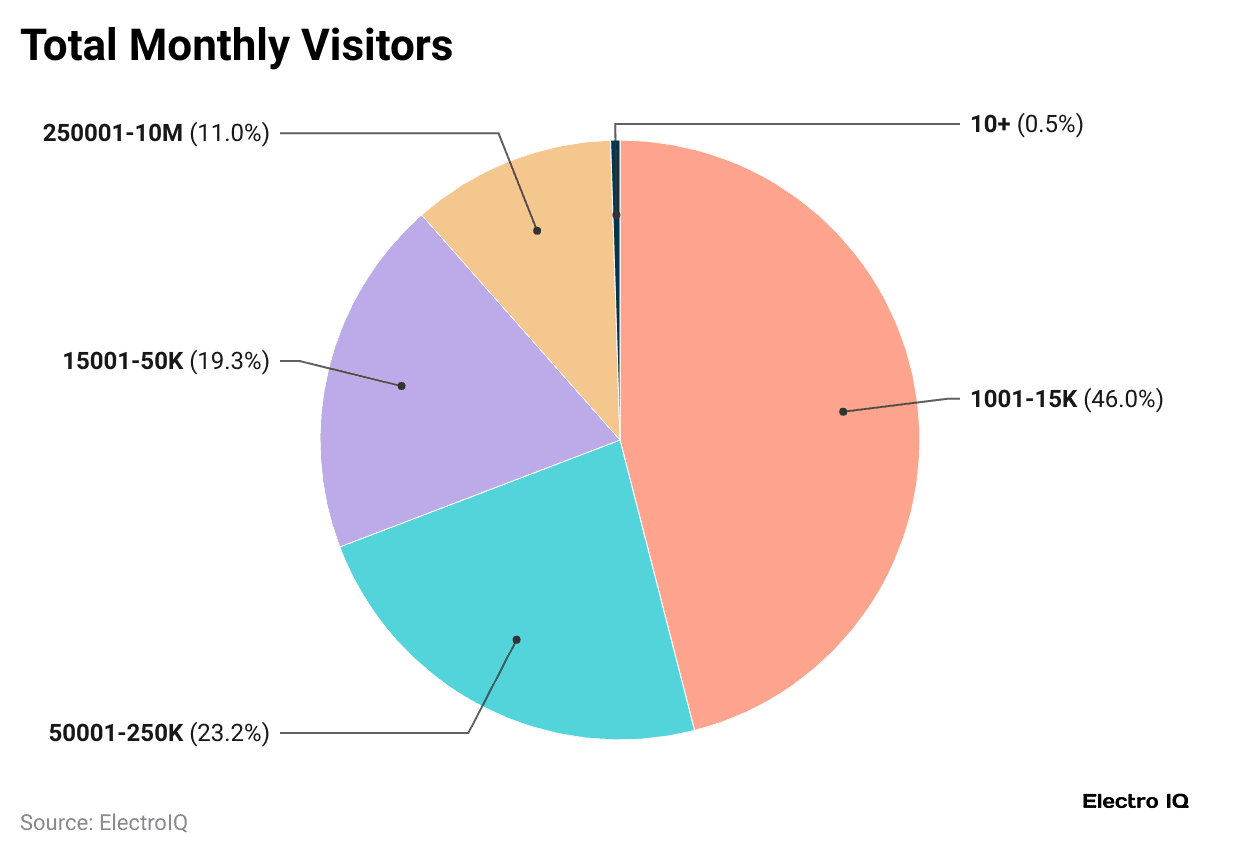
Monthly Unique Visitors Distribution in Websites
 (Reference: hubspot.com)
- The majority of websites tracked received between 1,001 and 15,000 visitors monthly, with 46%.
- Around 19.3% of websites get between 15,001 and 50,000 visitors per month.
- Websites with 50,001 to 250,000 monthly visitors make up 23.2%, those with 250,001 to 10 million visitors account for 11%, and only 0.5% have more than 10 million monthly visitors.
Website User Experience Statistics
- According to Forbes’ analysis, about 47% of people leave a site if it takes more than two seconds to load.
- Around 40% of visitors quit browsing if a page takes over three seconds to open.
- Slow-loading websites make retailers lose about USD 2.6 billion in sales every year.
- On average, users spend only 5.59 seconds reading written content on a webpage.
- Visitors focus around 6.44 seconds on the main navigation menu before moving on.
- The average time spent on a webpage is 54 seconds.
- Adding videos can boost the time spent on a page by 88%.
- Pages with videos keep people engaged for about six minutes on average.
- Around 88% of users do not return after having a bad website experience.
- A normal website bounce rate usually falls between 41% and 55%.
- 61% of people move to another site if they don’t find what they need in five seconds.
Conclusion
Websites play an important role in the digital space, and their statistics reveal how people use them. All the above-described statistical analyses help businesses to understand user behavior, spot what visitors enjoy, and find areas that need changes. Metrics such as traffic, bounce rate, and conversions highlight strengths and weaknesses.
Looking at this data helps companies make their websites better, reach more people, and get stronger results. Simply put, website statistics work like a guide that shows businesses how to make smarter choices and grow faster online.
FAQ.
The website aims to provide users with reliable information, resources, and services in one convenient platform.
Yes, all personal information is safe here, as users use strong encryption and strict privacy protection measures.
This website runs well on mobile and is simple to use on both smartphones and tablets.
The website gets updated often, so visitors always find fresh, correct, and useful information.
Some websites can be used at no cost, but a few ask for payment to unlock extra features or services.

Maitrayee Dey has a background in Electrical Engineering and has worked in various technical roles before transitioning to writing. Specializing in technology and Artificial Intelligence, she has served as an Academic Research Analyst and Freelance Writer, particularly focusing on education and healthcare in Australia. Maitrayee's lifelong passions for writing and painting led her to pursue a full-time writing career. She is also the creator of a cooking YouTube channel, where she shares her culinary adventures. At Smartphone Thoughts, Maitrayee brings her expertise in technology to provide in-depth smartphone reviews and app-related statistics, making complex topics easy to understand for all readers.


