Intel Statistics By Revenue, Assets, Net Income and Facts (2025)
Updated · Nov 07, 2025

Table of Contents
- Introduction
- Editor’s Choice
- Financial Analysis of Intel
- History of Intel
- Fun Facts About Intel
- Intel Statistics by Revenue
- Intel 3rd Quarter 2025 Financial Results
- Intel Statistics By Business Unit
- Top Semiconductor Companies
- Intel Employee Statistics
- By Total Assets
- By Net Income
- By Gross Profit
- By Operating Income
- By EBITDA
- By Market Capitalization
- Intel’s Product Analysis
- Intel’s Employee Analysis
- Intel’s Website Traffic Statistics
- By Country
- By User Demographics
- By Marketing Channels Distribution
- By Social Media
- Conclusion
Introduction
Intel Statistics: Intel Corporation was founded in 1968 by Robert Noyce and Gordon Moore in Santa Clara, California. The company is mainly involved in developing microchips that allow to running of computers, servers, and smart devices globally and has helped to shape the modern computing system. Beyond central processors, Intel now builds tools and services for artificial intelligence, cloud platforms, autonomous vehicles, and cutting-edge chip production. It works to boost performance and cut energy use while simplifying design.
The company’s technologies enable data centers, personal computers, and Internet of Things gadgets across the globe. This article on Intel Statistics includes several statistical analyses from different insights that elaborate on financial growth. Intel claims to lead the move toward a more connected, digital future for businesses, developers, and everyday users.
Editor’s Choice
- A report published by Macrotrends.net on June 30, 2025, indicated that Intel’s total revenue was approximately USD 12.859 billion, representing a 0.2% increase from the previous quarter.
- Additionally, the company also reported a net income of USD 2.918 million.
- As of October 31, 2025, Intel’s market capitalisation accounted for USD 174.72 billion.
- Intel reported USD 53.1 billion in total revenue for 2024, as per download.intel.com.
- Intel secured up to USD 7.86 billion in potential direct funding under the U.S. CHIPS & Science Act to support on-shore R&D and manufacturing.
- Intel’s long-standing lead in the x86 client/server market has weakened.
- Intel had approximately 108,900 employees in December 2024, representing a 12.74% decrease from the previous year.
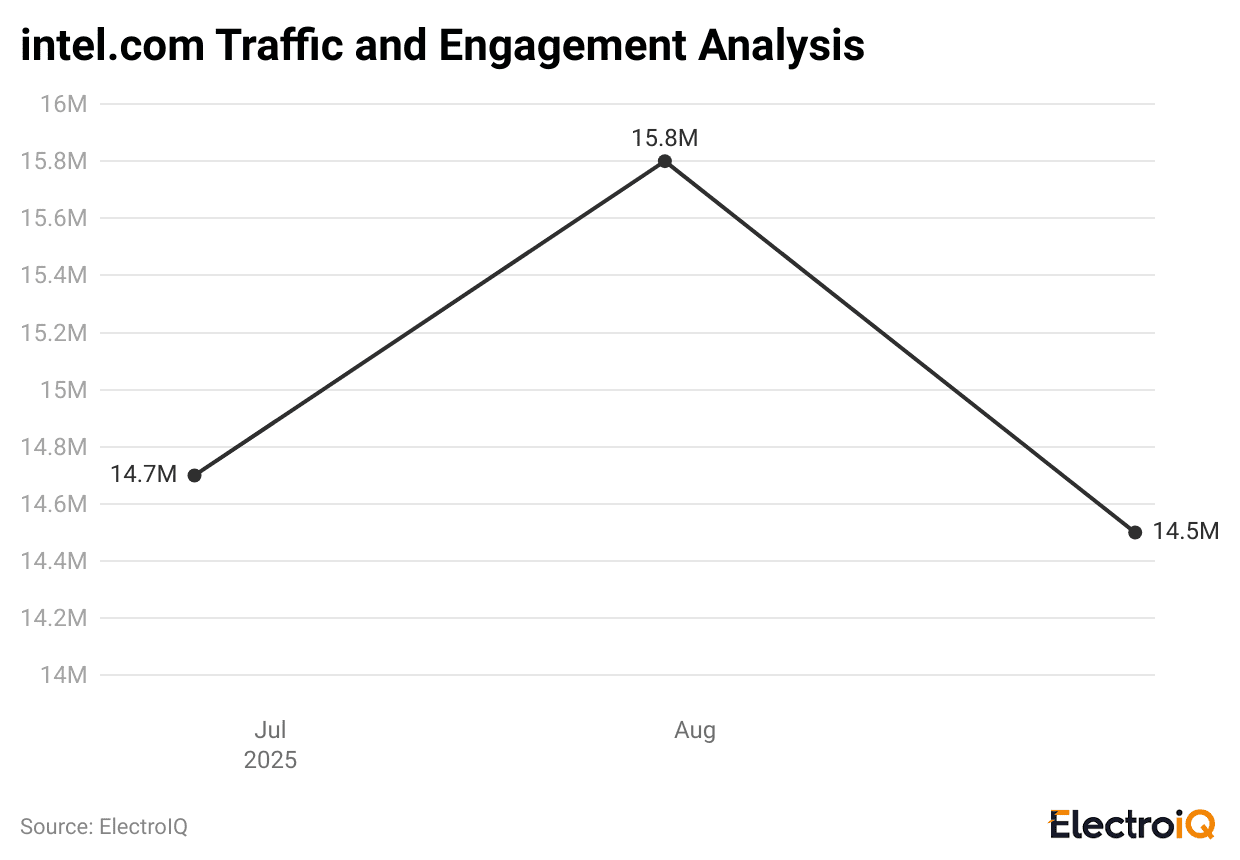
- In September 2025, intel.com received approximately 14.5 million visits, about 8.05% fewer than the month before.
- People from the United States made up the largest share of that traffic, accounting for approximately 28.26%.
- from the previous year.
- As of September 2025, the total number of visits to intel.com was approximately 14.5 million, representing an 8.05% decrease from the previous month.
- Meanwhile, the United States of America accounted for the highest share on intel.com, at 28.26%.
- In the same period, the total number of Intel’s website users aged 25 to 34 years accounted for the highest share, at 30.73%.
- The top traffic source for Intel’s website was direct search, with a traffic share of 46.67%.
Financial Analysis of Intel
| Metrics | 31/03/2025 | 30/06/2025 |
| (USD Million except per share data) | ||
|
Revenue |
12,667 | 12,859 |
| Cost of Goods Sold | 7,995 |
9,317 |
|
Gross Profit |
4,672 | 3,542 |
| Research and Development Expenses | 3,640 |
3,684 |
|
SG&A Expenses |
1,177 | 1,144 |
| Operating Expenses | 4,973 |
6,718 |
|
Operating Income |
-301 | -3,176 |
| Total Non-Operating Income/Expense | -285 |
407 |
|
Pre-Tax Income |
-586 | -2,769 |
| Income Taxes | 301 |
255 |
|
Income After Taxes |
-887 |
-3,024 |
|
Income from Continuous Operations |
||
|
Net Income |
-821 | -2,918 |
| EBITDA | 2,373 |
-163 |
|
EBIT |
-301 | -3,176 |
| Basic Shares Outstanding (millions) | 4,343 |
4,369 |
|
Shares Outstanding |
||
|
Basic EPS (USD) |
-0.19 |
-0.67 |
|
EPS – Earnings Per Share (USD) |
||
History of Intel
- 1968 → Intel is founded by Robert Noyce and Gordon Moore in July.
- 1971 → Intel introduces the 4004, the first commercial single-chip microprocessor.
- 1972 → The 8008 8-bit microprocessor is introduced in April.
- 1974 → The 8080 launches and becomes a landmark general-purpose microprocessor.
- 1978 → Intel launches the 8086, the origin of the x86 line.
- 1979 → Intel introduces the 8088, later used in the first IBM PC.
- 1981 → IBM unveils the PC powered by Intel’s 8088.
- 1982 → Second-generation x86, the 80286, debuts.
- 1985 → The 80386 brings 32-bit x86 processing.
- 1989 → The 80486 family is introduced, integrating an on-chip FPU on many models.
- 1991 → The Intel Inside marketing campaign begins, creating a globally recognized ingredient brand.
- 1993 → Intel ships the first Pentium processors on March 22.
- 1995 → Pentium Pro introduces the P6 microarchitecture.
- 2000 → Pentium 4 launches, ushering in the NetBurst era.
- 2003 → Centrino platform promotes mobile computing with integrated Wi-Fi.
- 2006 → Core microarchitecture and Core 2 Duo reset Intel’s performance per watt leadership.
- 2008 → Nehalem architecture debuts with integrated memory controller and QuickPath.
- 2011 → Sandy Bridge mainstreams on-die graphics and improved efficiency.
- 2014 → Broadwell on 14 nm begins shipping, marking a key process transition.
- 2019 → First 10 nm Core client wave arrives with Ice Lake mobile.
- 2020 → Fab 42 in Arizona becomes fully operational on 10 nm.
- 2021 → Pat Gelsinger announces IDM 2.0, a strategy to expand internal manufacturing and foundry services, including a planned 20 billion USD investment in two new Arizona fabs.
- 2023 → Intel terminates its agreement to acquire Tower Semiconductor.
- 2023 → Meteor Lake launches on December 14 as the first Core Ultra mobile chips using a chiplet design and Intel 4 for compute.
- 2024 → Intel details an expanded foundry roadmap at IFS Direct Connect 2024, reinforcing the goal to be the No. 2 external foundry by 2030. Arrow Lake desktop Core Ultra 200S is introduced in October.
- 2024 → Lunar Lake Core Ultra 200V mobile launches in September, focused on low-power AI PCs.
- 2025 → Lip-Bu Tan is appointed Intel CEO in March, succeeding Pat Gelsinger.
Fun Facts About Intel
- Intel’s name was formed as a portmanteau of “INTegrated ELectronics.” The founders initially registered “NM Electronics” and then purchased rights to “Intel” after finding the name already in use.
- The company was founded in 1968 by Robert Noyce and Gordon Moore, who previously left Fairchild Semiconductor.
- Intel introduced the world’s first commercial single-chip microprocessor, the 4004 in 1971. It contained roughly 2,300 transistors and ran at about 740 kHz.
- The 8086 microprocessor was launched on June 8, 1978 and established the x86 architecture that dominated personal computing. A derivative, the 8088, powered the first IBM PC.
- Intel popularized “ingredient branding” with the Intel Inside program in 1991, turning a component supplier into a consumer-recognized brand.
- The famous five-note Intel sound mark, known as the “bong,” was composed by Walter Werzowa in 1994 and debuted in 1995 advertising.
- Intel engineers, led by Ajay Bhatt, co-created USB, which standardized how peripherals connect to computers.
- The Centrino platform, announced in 2003, bundled CPU, chipset, and Wi-Fi, accelerating mainstream laptop wireless adoption.
- Intel became the first chipmaker to receive and assemble ASML’s next-generation High-NA EUV lithography tool, with additional systems planned for Oregon.
- Intel acquired AI-chip startup Habana Labs for about $2 billion in 2019, adding the Gaudi line of AI accelerators to its portfolio.
- Intel’s Programmable Solutions Group was relaunched as Altera; by January 2025 it completed its operational transition as a standalone company.
- The Intel Museum in Santa Clara is open to the public with free admission and is located at 2200 Mission College Blvd at the Robert Noyce Building.
- Robert Noyce, Intel’s co-founder, is often referred to as the “Mayor of Silicon Valley” for his foundational role in the region’s tech growth.
- In 2025, Intel undertook major restructuring with large workforce reductions as part of a turnaround strategy under new leadership. Reports cited cuts exceeding 20% of staff across multiple sites.
- Intel’s early branding details include the original “dropped-e” logo from 1969, a visual identity that became widely recognized in the PC era.
Intel Statistics by Revenue
- According to Intel’s October 23 2025 report, the company’s third-quarter revenue was $13.7 billion, representing a year-over-year increase of 3%.
- Intel stated that earnings per share (EPS) attributable to the company were $0.90 (GAAP) and $0.23 (non-GAAP) for the third quarter.
- The company forecasted fourth-quarter 2025 revenue to be between $12.8 billion and $13.8 billion, and projected EPS attributable to Intel of ($0.14) (GAAP) and $0.08 (non-GAAP). The guidance excludes the results of Altera Corporation after the sale of majority ownership in Q3.
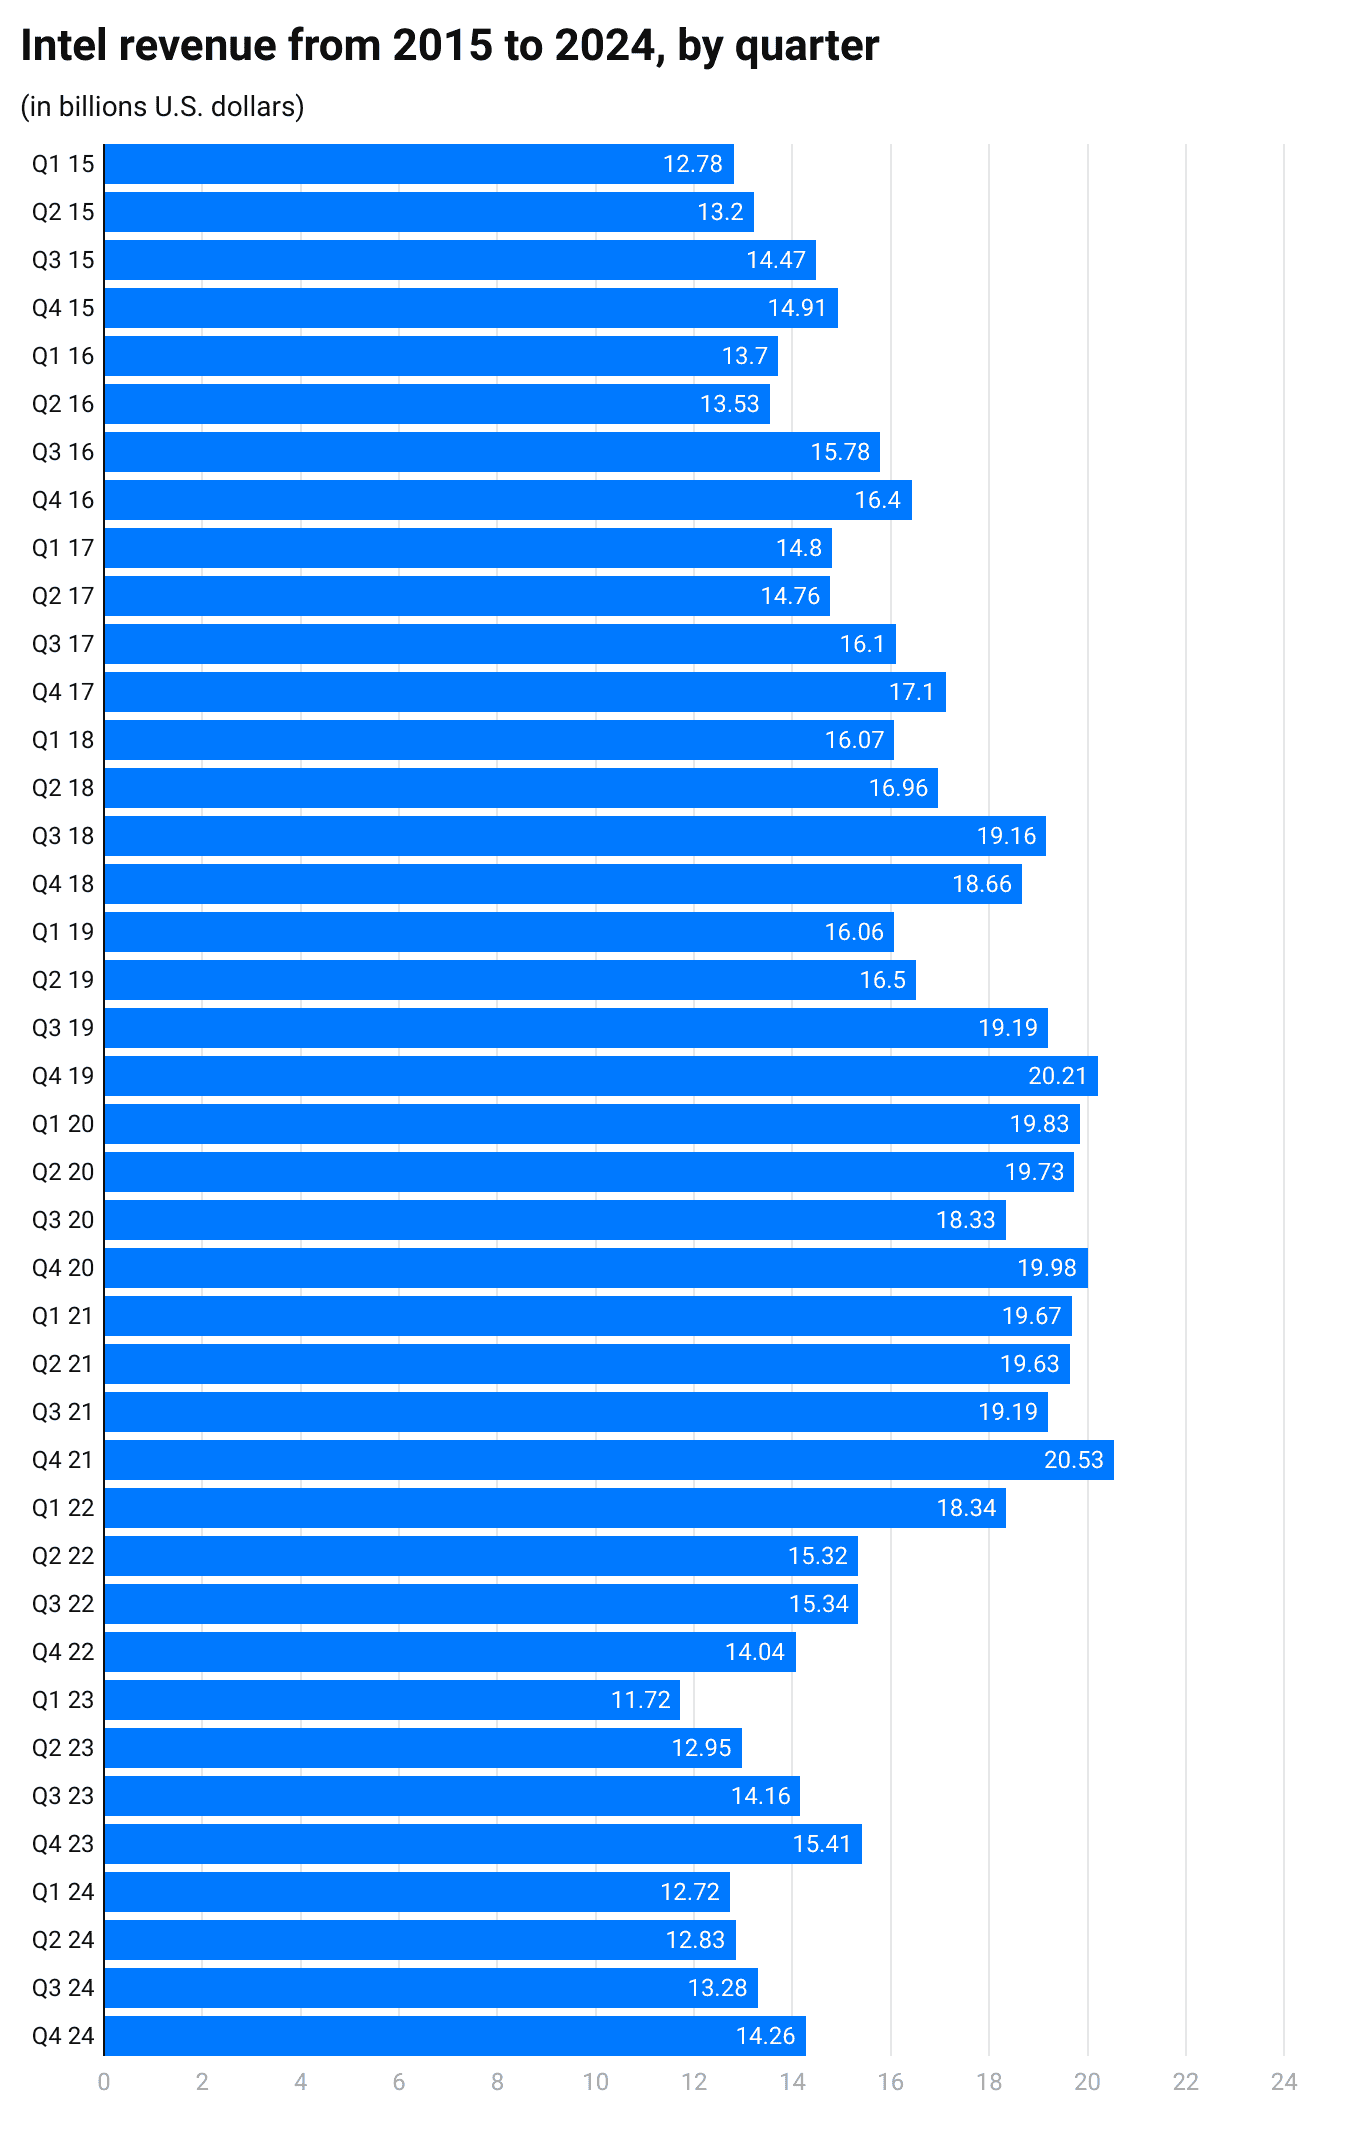
- The company further noted that in Q1 2024 it earned revenue of approximately $12.67 billion, then in Q2 it increased slightly to around $12.83 billion, and in Q3 it reached $13.3 billion. The report adds that by Q4 2024 revenue had climbed to about $14.3 billion, although that amount was 7% lower than the same period in 2023.
- A separate forecast as of March 7 2025 put the company’s Q1 2025 revenue estimate between $11.7 billion and $12.7 billion.
(Source: Coolest-Gadgets)
Intel 3rd Quarter 2025 Financial Results
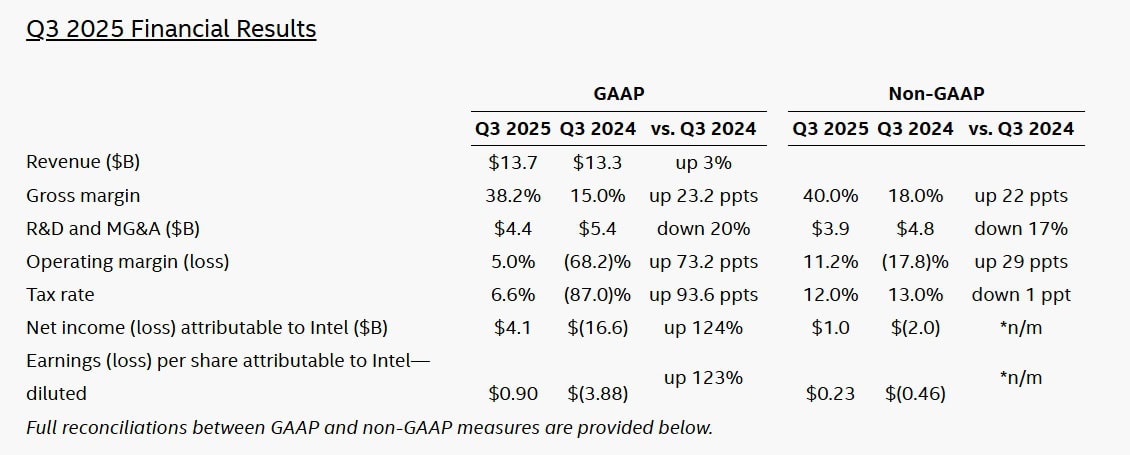
- According to Intel’s quarterly report, the company recorded $13.7 billion in revenue during the third quarter, marking a 3% increase year-over-year.
- Earnings per share (EPS) attributable to Intel stood at $0.90, while the non-GAAP EPS was $0.23, reflecting steady financial performance.
- For the fourth quarter of 2025, Intel expects revenue between $12.8 billion and $13.8 billion, with an anticipated EPS of $(0.14) and non-GAAP EPS of $0.08. The forecast does not include Altera, as Intel finalized the sale of a majority stake in the third quarter.
- The company generated $2.5 billion in cash from operations during the third quarter, supported by stronger product demand and improved efficiency.
- As reported by Intel, an agreement with the U.S. Government and the Trump Administration secured $8.9 billion in funding to strengthen domestic semiconductor manufacturing. Out of this, $5.7 billion was received during the quarter.
- A new collaboration between Intel and NVIDIA was announced to co-develop multiple generations of data center and PC products, combining Intel’s CPU expertise with NVIDIA’s AI and accelerated computing platforms using NVIDIA NVLink technology.
- According to company filings, NVIDIA also invested $5.0 billion in Intel’s common stock, demonstrating confidence in Intel’s long-term strategic vision.
- Similarly, SoftBank Group invested $2.0 billion in Intel’s common stock, reflecting support for expanding semiconductor manufacturing capabilities within the United States.
- Intel introduced the Intel® Core™ Ultra series 3 processors (code-named Panther Lake), marking the first client system-on-chip built on Intel 18A technology.
- The company strengthened its partnership with Microsoft, integrating Windows ML and Intel vPro® manageability with Microsoft Intune, aiming to enhance enterprise management and AI-driven computing experiences.
- Intel also unveiled Intel® Xeon® 6+ (code-named Clearwater Forest), showing major advancements in power efficiency and performance for next-generation servers.
- A new GPU, Crescent Island, optimized for AI inference and enterprise cloud workloads, was also announced, signaling Intel’s growing presence in the AI infrastructure space.
- Fab 52, Intel’s fifth high-volume fabrication facility at the Ocotillo campus in Arizona, became fully operational. It produces advanced Intel 18A wafers, contributing to Intel’s more than $100 billion domestic investment plan.
- Intel reported receiving $5.2 billion following the completion of the Altera transaction and the partial sale of Mobileye, reinforcing its financial flexibility for future investments.
Intel Statistics By Business Unit
- According to Intel’s quarterly financial filings, the Client Computing Group (CCG), which represents the company’s main processor division, recorded revenue of USD 6.2 billion in the second quarter of 2024, showing a 2% rise compared to the same quarter of 2023. This increase was supported by steady demand in the personal computer segment.
- Based on Intel’s report, the Data Center Group (DCG) achieved revenue of USD 5.5 billion during the same quarter, registering a 6% year-over-year increase. The growth was attributed to expanding use of cloud infrastructure and enterprise data processing.
- Industry reports highlighted that Intel Foundry Services (IFS) underwent major restructuring to attract new external customers and investments. Although companies such as Nvidia and Broadcom conducted manufacturing tests, the division posted an operating loss of USD 13.41 billion in 2024, reflecting the cost of transformation and capacity expansion.
- As per company disclosures, Other Businesses, which include units such as Altera and Mobileye Global, generated USD 3.82 billion in 2024, representing a 32% decline from the previous year due to reduced automotive and programmable solutions demand.
- In the financial year 2023, Intel’s Client Computing Group reported annual revenue of USD 29.3 billion, representing an 8% decline from the prior year. In the fourth quarter, the segment earned USD 8.8 billion, showing a 33% decrease, primarily due to weakening PC shipments.
- The Data Center and AI (DCAI) segment produced USD 15.5 billion in revenue during 2023, which was a 20% drop from the previous year. In the fourth quarter, its revenue reached USD 4 billion, marking a 10% fall.
- The Network and Edge (NEX) division recorded USD 8 billion in full-year revenue and USD 1.5 billion in the fourth quarter of 2023, reflecting slower demand for networking products.
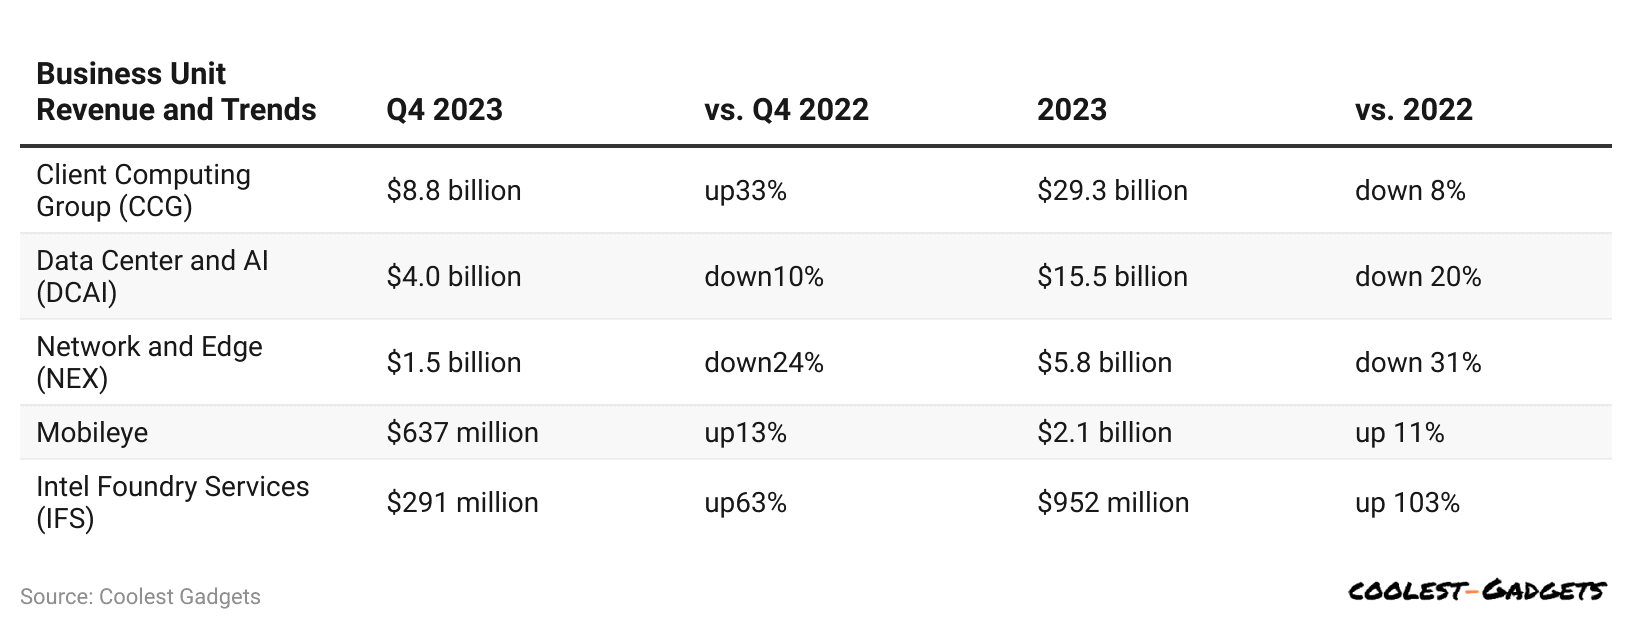
- The Mobileye unit earned USD 2.1 billion in 2023 and USD 637 million in the final quarter, according to Intel’s earnings release, supported by ongoing adoption of driver-assistance technologies despite a mild decline in shipments.
- Lastly, Intel Foundry Services (IFS) posted USD 952 million in total revenue for 2023, with USD 291 million recorded in the fourth quarter, showing moderate activity amid restructuring and capacity realignment.
Top Semiconductor Companies
| Rank | Company | Latest market cap (USD) | Notes |
| 1 | Nvidia | $4.74T | Reached the $5T threshold intraday in late Oct 2025; remains the clear sector leader. |
| 2 | Broadcom | $1.70T | Lifted by custom AI accelerators and networking demand. |
| 3 | TSMC | $1.23T | Foundry leadership supported by advanced nodes. |
| 4 | ASML | $410B | Orders tied to EUV and High-NA systems. |
| 5 | Samsung Electronics | $445B | Memory recovery and HBM capacity expansion cited by markets. |
| 6 | AMD | $416B | Strength from AI GPUs and data center products. |
| 7 | Qualcomm | $186B | Mobile and edge AI positioning sustain valuation. |
| 8 | Intel | $168B | Ongoing foundry transition and server CPU mix. |
| 9 | Applied Materials | $186B | Wafer fab equipment demand stays firm. |
| 10 | Texas Instruments | $149B | Analog mix and capital discipline reflected in cap. |
| 11 | Arm Holdings | $170B | IP model leverages rising on-device AI. |
| 12 | Lam Research | $204B | Memory and advanced logic tools push valuation higher. |
| 13 | Tokyo Electron | $103B | Benefiting from tool upcycles across Asia. |
- Intel placed 8th in March 2024, with a market value of $180.23 billion, while Nvidia led the list with $2.204 trillion.
- Nvidia now stands near $4.74 trillion in market capitalization in November 2025, with multiple reports this year noting brief moves above $5 trillion during intraday trading.
- TSMC has risen to roughly $1.23 trillion in market value in November 2025, reflecting continued leadership at advanced process nodes.
- Broadcom’s valuation has climbed to about $1.68–$1.72 trillion in early November 2025, helped by steady demand for custom accelerators and networking silicon.
- ASML is valued around $410 billion in November 2025 as EUV and High-NA tool orders remain strong.
- Samsung Electronics carries a market value near $445 billion in November 2025, supported by a recovery in memory and HBM capacity expansion.
- AMD’s market capitalisation is close to $416 billion in November 2025 as AI GPUs and data-centre products underpin investor expectations.
- Qualcomm’s market value is roughly $186 billion in November 2025, reflecting licensing and edge-AI handset cycles.
- Intel’s valuation sits near $168 billion in November 2025 amid its foundry transition and changing server CPU mix.
- Applied Materials is valued at around $186 billion in November 2025, consistent with firm wafer-fab equipment spending.
- Texas Instruments holds a market capitalisation of roughly $147 billion in November 2025 as the analogue cycle normalises.
- Arm Holdings shows a valuation near $170 billion in November 2025 as its IP model benefits from on-device AI momentum.
- Lam Research reached approximately $204 billion in November 2025, reflecting stronger demand for etch and deposition tools.
- Tokyo Electron’s market value is close to $100 billion in November 2025, aligned with a broad equipment upcycle across Asia.
- The 2025 valuations show a clear step-up from the March 2024 readings in your chart, with Nvidia more than doubling and Broadcom and TSMC moving into the trillion-dollar tier, while key equipment makers such as ASML, Lam Research, and Tokyo Electron have also expanded their scale alongside AI-driven fab investments.
Intel Employee Statistics
- Intel employs around 121,100 people worldwide, with an average tenure of 7 years in the company.
- Around 27% of Intel’s workforce is composed of women, while 73% are men.
- Among Intel’s executives, 40% are women and 43% are from minority backgrounds.
- The company’s overall workforce includes 48% minority employees, with Asian being the most represented minority group.
- The ethnic composition of Intel includes 52% White, 19% Asian, and 18% Hispanic or Latino employees.
- The average Intel employee earns approximately USD 94,208 per year.
- The majority of Intel employees identify politically with the Democratic Party.
- The most spoken foreign languages among Intel employees are Spanish (37%), Chinese (10%), Mandarin (8.7%), French (8%), Japanese (5.4%), and German (4.4%).
- In terms of education, 60% of Intel employees hold at least a bachelor’s degree, and 29% of them have majored in electrical engineering, which is the most common field of study.
- Intel is largely a male-dominated organization, with men accounting for about 73% of its workforce.
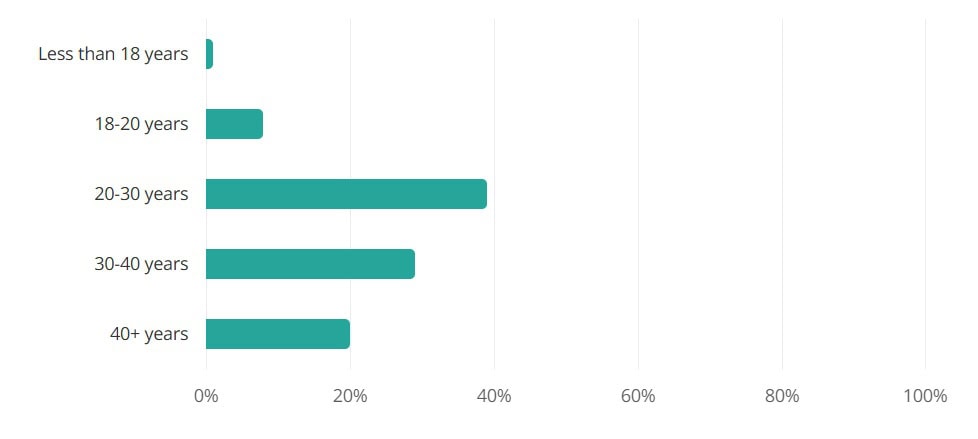
- The age distribution shows that 39% of Intel employees are between 20 and 30 years old, making it the most common age group.
- Only 2% of employees are younger than 18 years, representing the smallest age segment in the company.
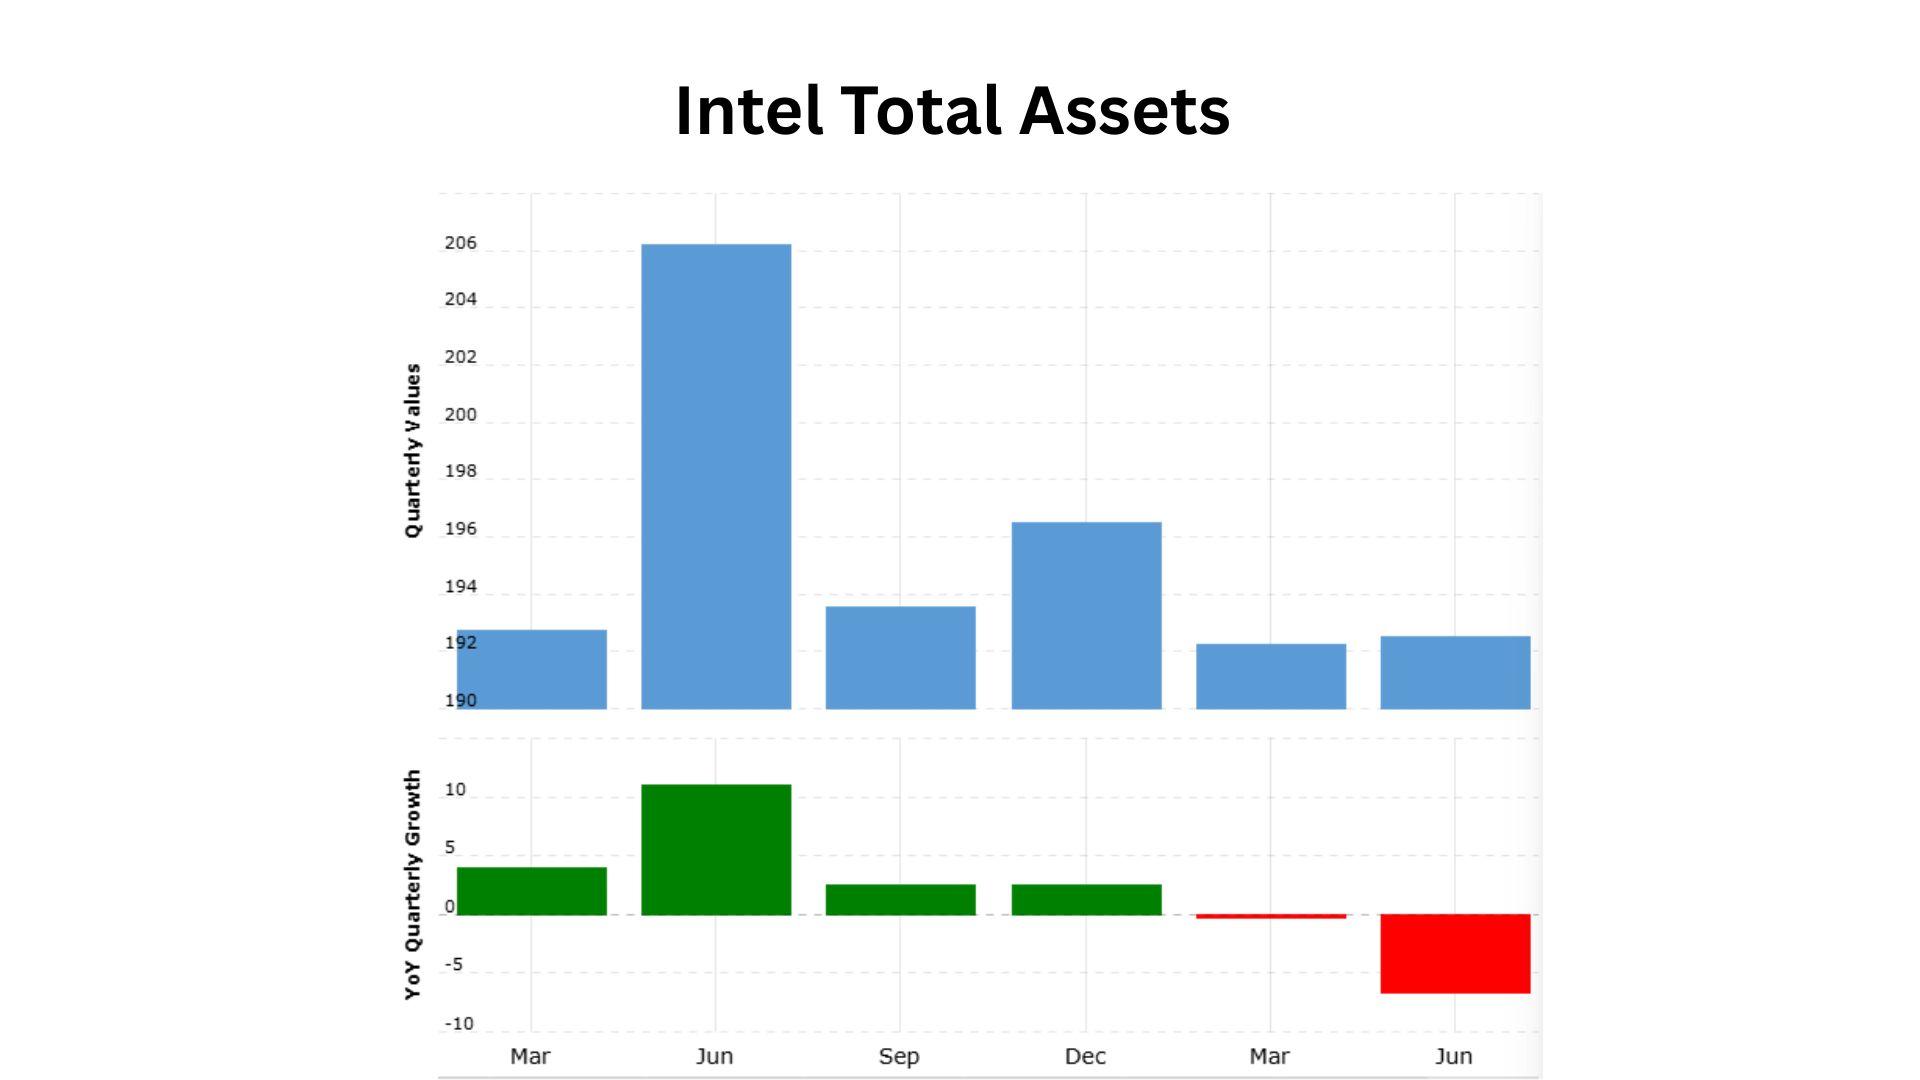
By Total Assets
 (Source: macrotrends.net)
| Date | Total Assets (USD billion) | Growth Rate |
| 06/30/2025 | 192.520 | -6.64% |
| 03/31/2025 | 192.242 | -0.25% |
| 12/31/2025 | 196.485 | +2.56% |
| 09/30/2024 | 193.542 | +2.49% |
| 06/30/2024 | 206.205 | +11.08% |
| 03/31/2024 | 192.733 | +4.01% |
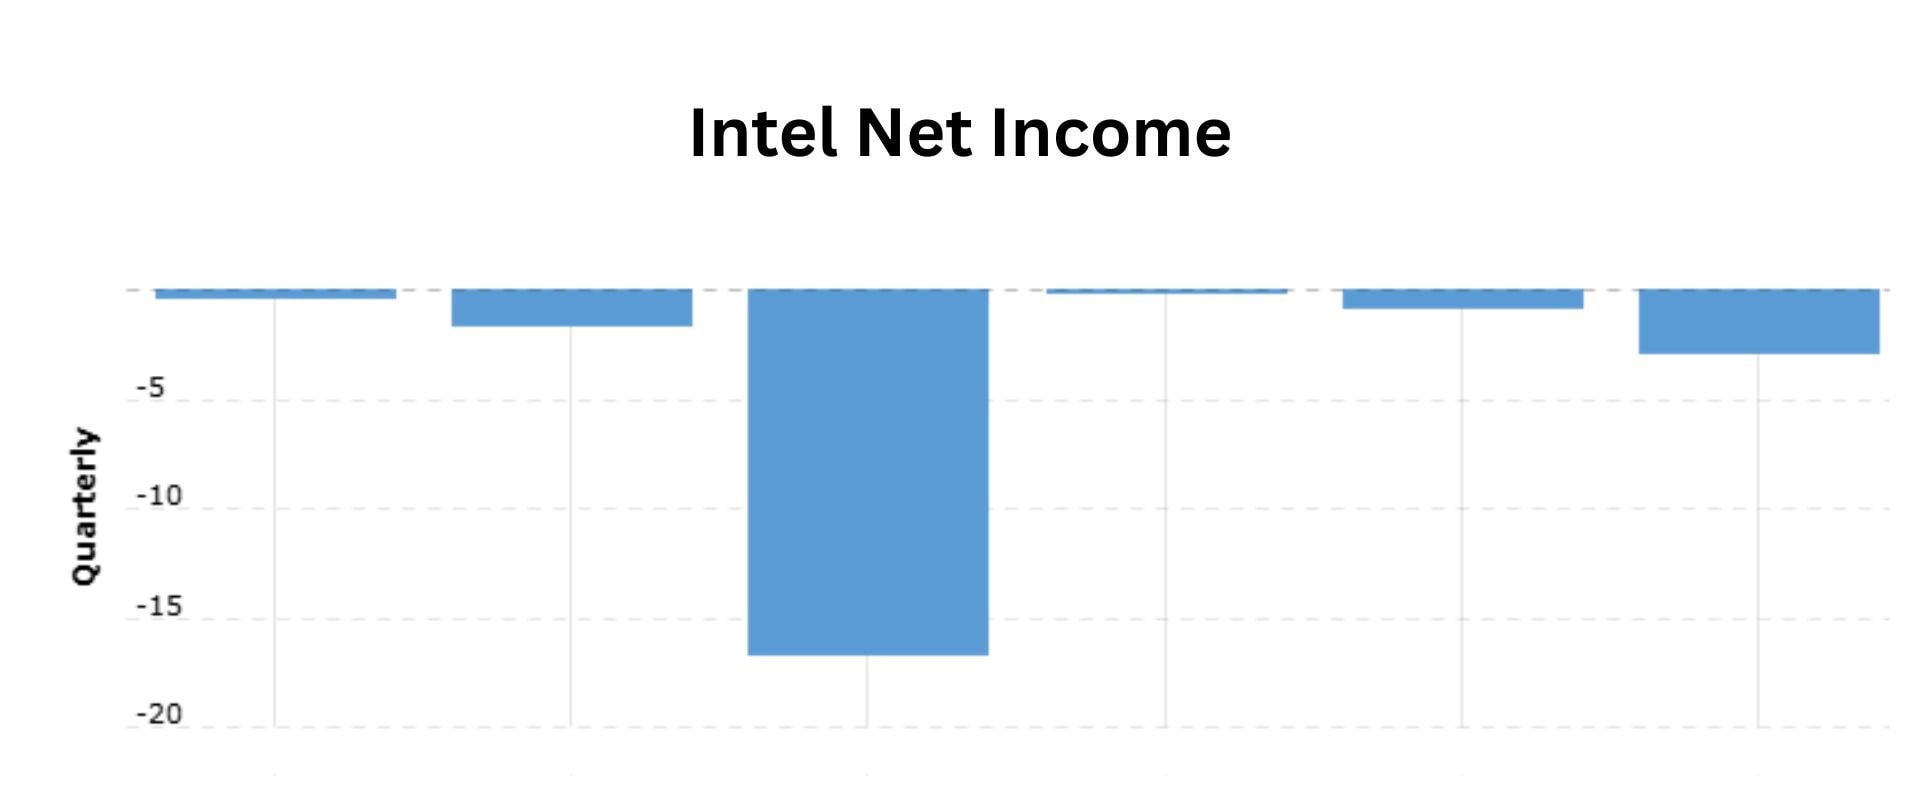
By Net Income
 (Source: macrotrends.net)
- A report published by Macrotrends.net shows that by June 30, 2025, the net income secured by the company was USD 2.918 million.
Furthermore, other quarterly reports are stated in the table below:
| Date | Net Income (USD million) |
| 03/31/2025 | -821 |
| 12/31/2025 | -126 |
| 09/30/2024 | -16,639 |
| 06/30/2024 | -1,610 |
| 03/31/2024 | -381 |
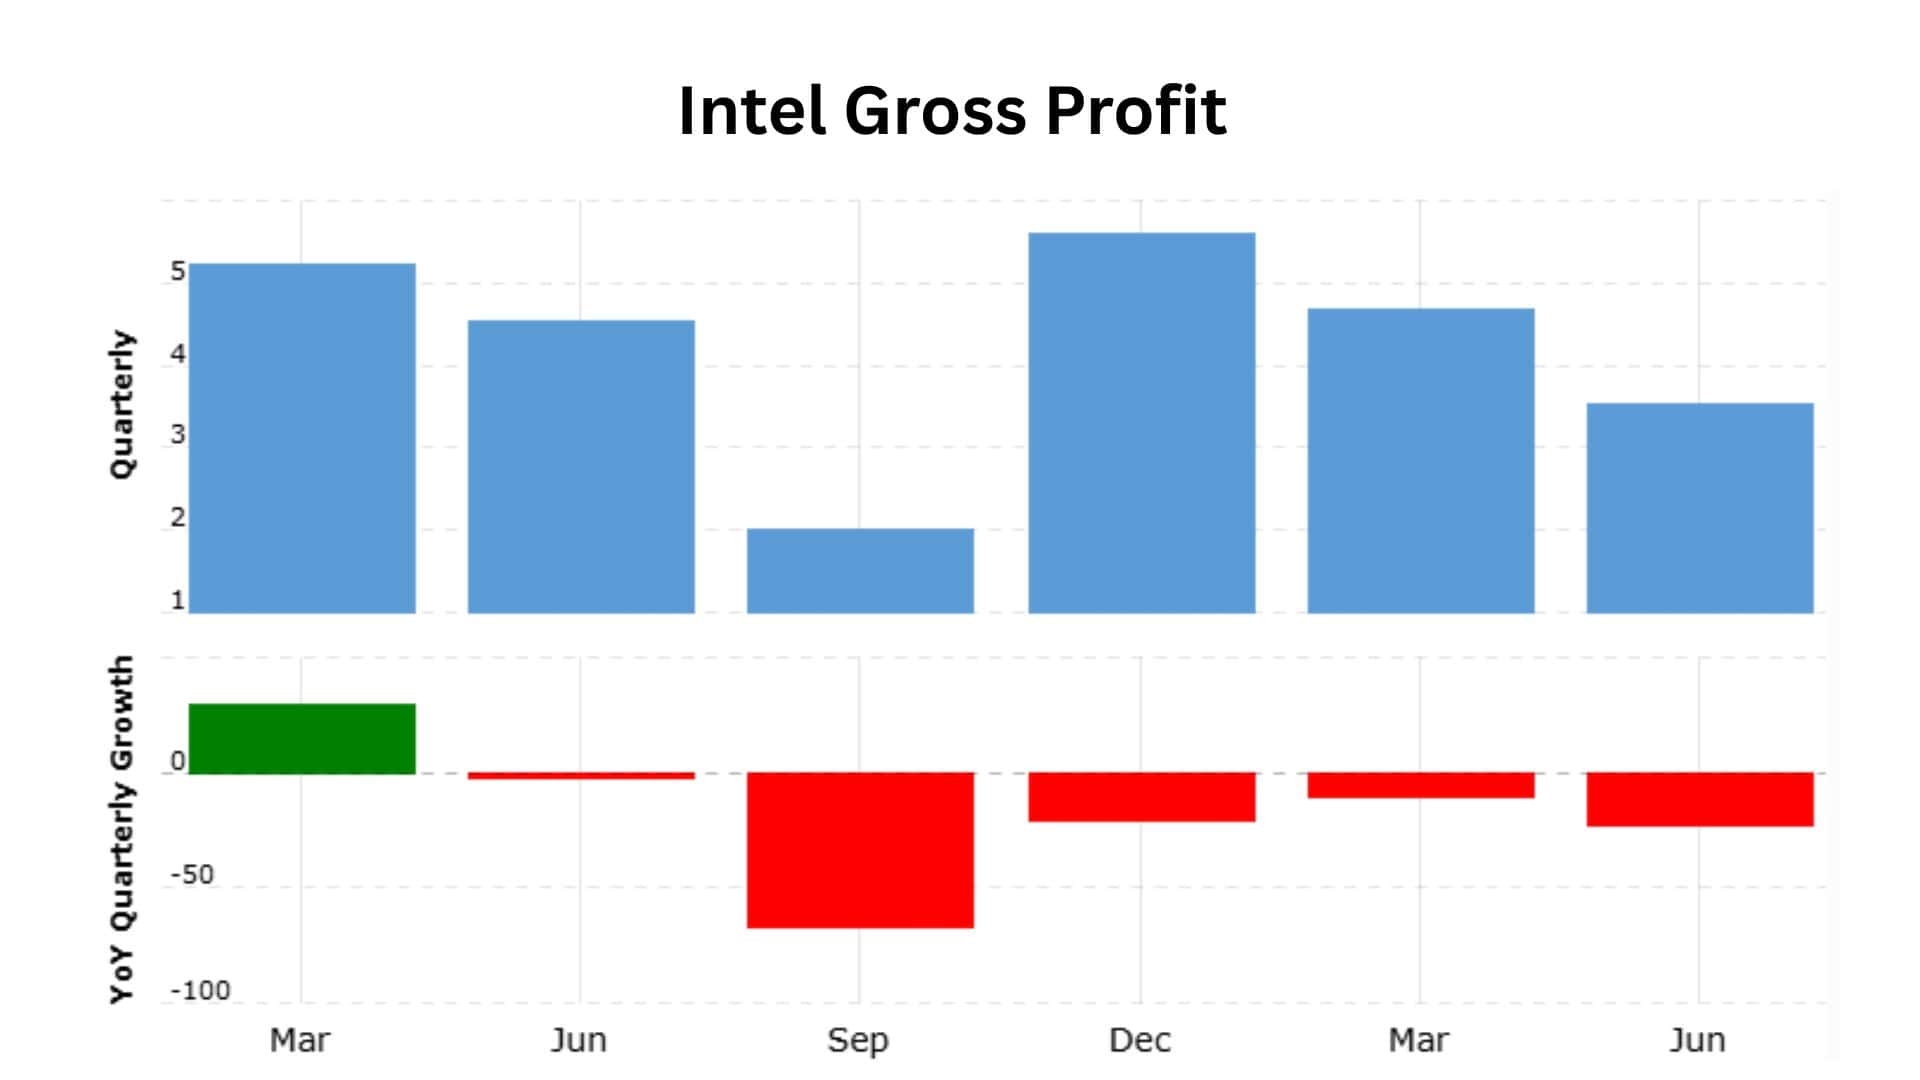
By Gross Profit
 (Source: macrotrends.net)
| Date | Gross Profit (USD billion) | Growth Rate |
| 06/30/2025 | 3.542 | -22.10% |
| 03/31/2025 | 4.672 | -10.45% |
| 12/31/2025 | 5.584 | -20.76% |
| 09/30/2024 | 1.997 | -66.82% |
| 06/30/2024 | 4.547 | -1.96% |
| 03/31/2024 | 5.217 | +30.16% |
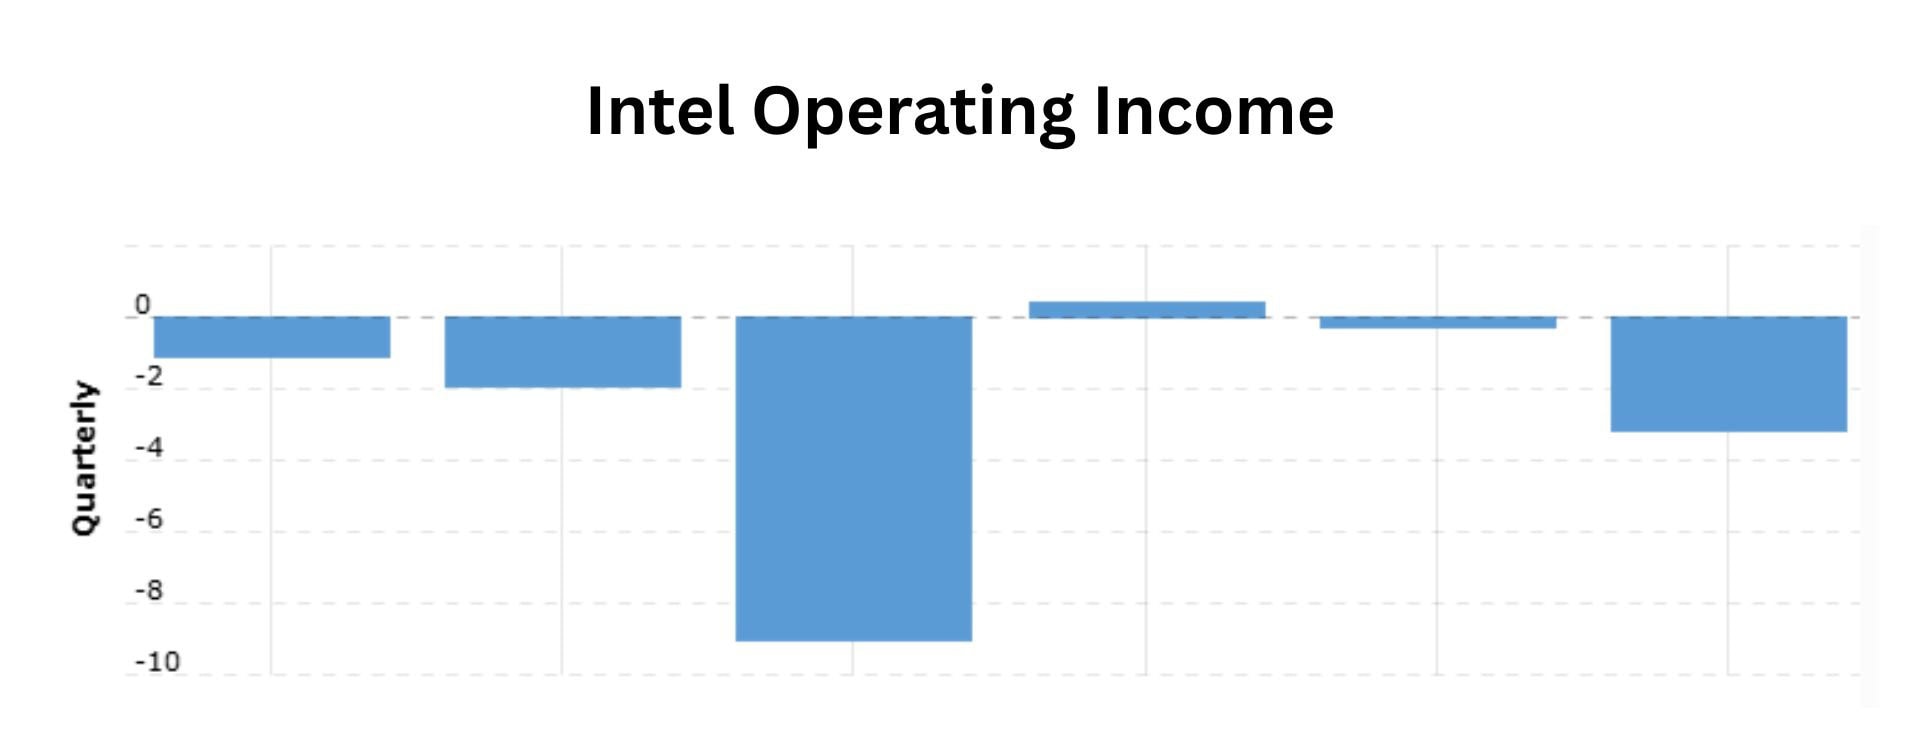
By Operating Income
 (Source: macrotrends.net)
| Date | Operating Income (USD billion) |
| 06/30/2025 | -3.176 |
| 03/31/2025 | -0.301 |
| 12/31/2025 | 0.421 |
| 09/30/2024 | -9.057 |
| 06/30/2024 | -1.964 |
| 03/31/2024 | -1.069 |
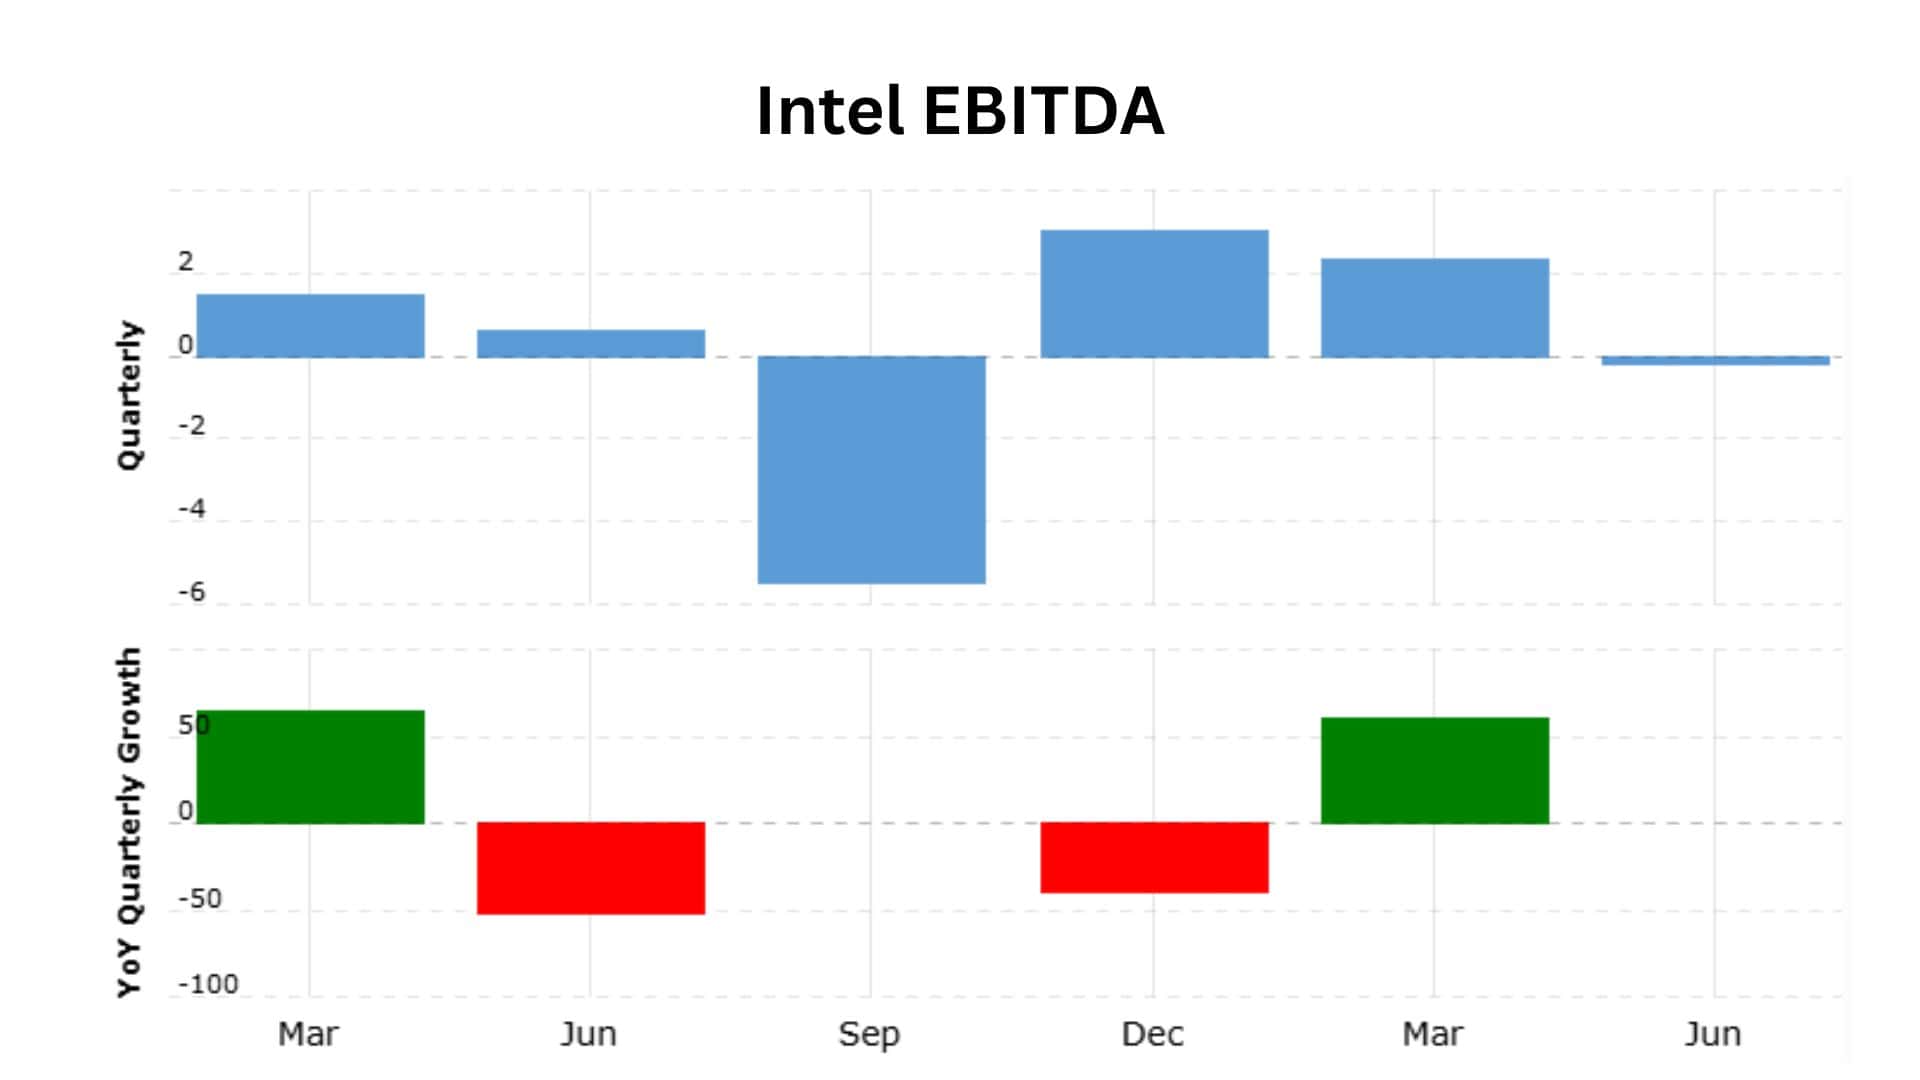
By EBITDA
 (Source: macrotrends.net)
| Date | EBITDA (USD billion) | Growth Rate |
| 06/30/2025 | -0.163 | – |
| 03/31/2025 | 2.373 | +60.12% |
| 12/31/2025 | 3.059 | -40.00% |
| 09/30/2024 | -5.445 | – |
| 06/30/2024 | +0.605 | -51.98% |
| 03/31/2024 | +1.482 | +65.03% |
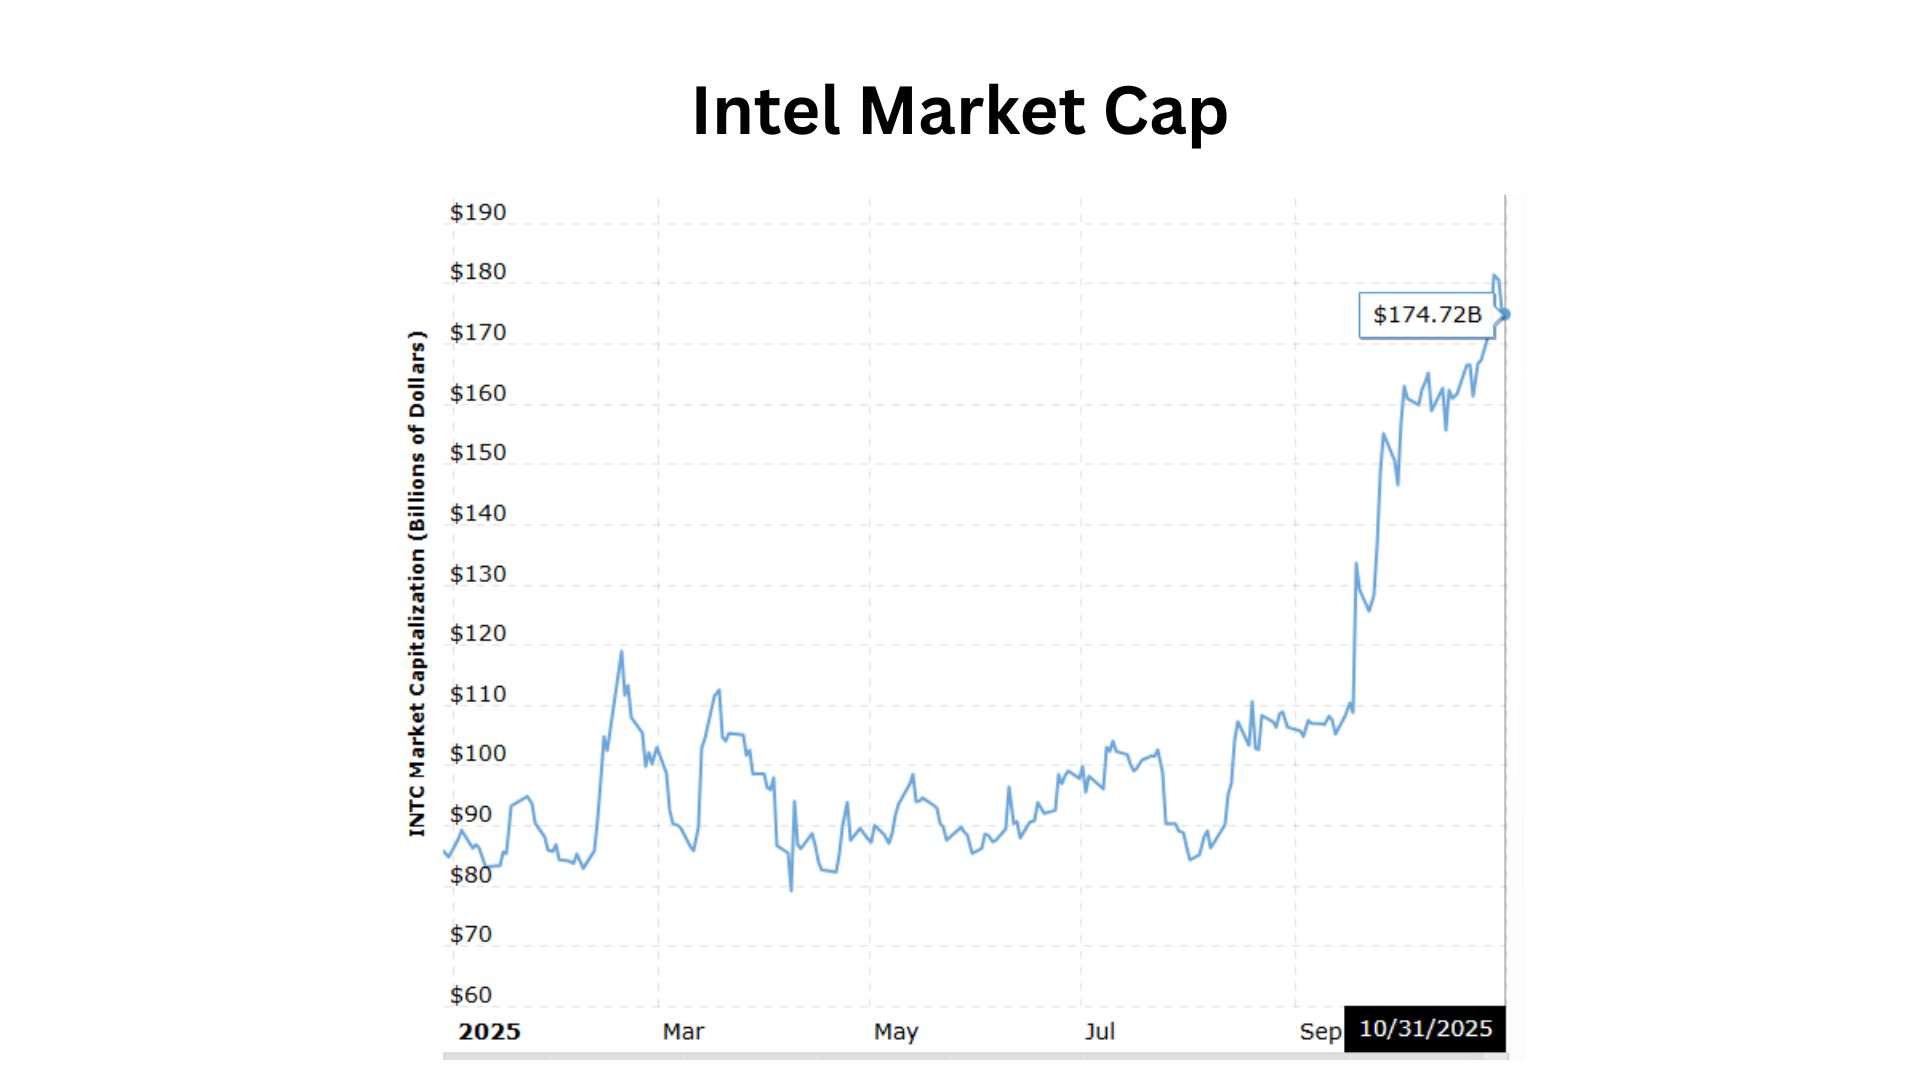
By Market Capitalization
 (Source: macrotrends.net)
- As of October 31, 2025, Intel’s market cap was USD 174.72 billion, an increase from September 30, 2025 (USD 146.58 billion).
Furthermore, other monthly market cap analyses of 2025 are mentioned in the table below:
| Months | Market Cap (USD billion) |
| August 29 | 106.39 |
| July 31 | 86.51 |
| June 30 | 97.87 |
| May 30 | 85.41 |
| April 30 | 87.82 |
| March 31 | 98.63 |
| February 28 | 103.06 |
| January 31 | 84.38 |
Intel’s Product Analysis
| Products | Category | Launch/Ref, date | Cores | Threds | Base Frequency (GHz) | Max Turbo (GHz) | Cache | TDP | Graphics / NPU notes |
| Intel® Core™ i9-14900K | Desktop CPU (14th gen) | Q1 2024 (still listed in 2025 product pages) | 24 (8 P + 16 E) | 32 | P-core base 3.2 / E-core base 2.4 | 6.00 | 36 MB Intel® Smart Cache | 125 W (base) / 253 W (max turbo) | Intel UHD Graphics (integrated) |
| Intel® Core™ Ultra 9 Processor 285K (Arrow Lake-S) | Desktop CPU (Core Ultra / Arrow Lake) | Listed January 6, 2025 (Arrow Lake family) | 24 (8 P + 16 E) | 32 | (varies by SKU-desktop, listed base 3.7 GHz for top SKU) | Up to 5.70 | 36 MB (Smart Cache shown on SKU page) | 125 W (base) / up to 250 W (turbo reported on listings) | Xe-LPG graphics (Xe EU counts listed per SKU), NPU values vary by SKU. |
| Intel® Core™ Ultra (Series 2 – product family) | Mobile & desktop Core Ultra family (2024–2025 marketing) | Series 2 / 2024–2025 product family page | Varies by SKU (e.g., 8P+16E on top SKUs) | Varies | Varies by SKU | Varies (up to approximately 5.7 GHz on top SKUs) | Example top SKUs: ~36 MB Smart Cache | Typical TDP ranges shown per SKU (mobile to desktop) | Family emphasises onboard AI features (NPU/accelerators) and integrated Xe graphics. |
| Intel® Xeon® (Scalable family – 4th/5th Gen coverage) | Server/datacenter CPUs | Product/support pages (2024–2025 coverage) | Up to many dozens of cores, depending on SKU (examples: 128 cores across dual-socket configs) | Hyperthreading/varies by SKU | Varies by SKU | Varies by SKU | Large LLC per SKU (varies) | TDP varies widely (targeted server TDPs up to several hundred W per socket) | Platform supports large memory, multi-socket, and advanced server features (PCIe lanes, etc.). |
Intel’s Employee Analysis
- In December 2024, Intel had 108,900 employees, which was 12.74% fewer than a year earlier.
- The company had 124,800 workers in 2023 (-5.38% from last year), 131,900 in 2022 (+8.92%), and 121,100 in 2021 (+9.49%).
- Before that, Intel employed 110,600 people in 2020 (- 0.18%), and 110,800 in 2019 (+3.17%).
Intel’s Website Traffic Statistics
(Reference: similarweb.com)
- As of September 2025, the total number of visits to intel.com was almost 14.5 million, a 8.05% decrease from August.
- The website’s bounce rate was 54.77% in the same period.
- Meanwhile, the average number of pages per visit was 3.21, and the average visit duration was 3 minutes and 40 seconds.
- Globally, Intel’s website ranked #3,878, in the United States (#2,954), and in its category, it ranked #12.
By Country
 (Reference: similarweb.com)
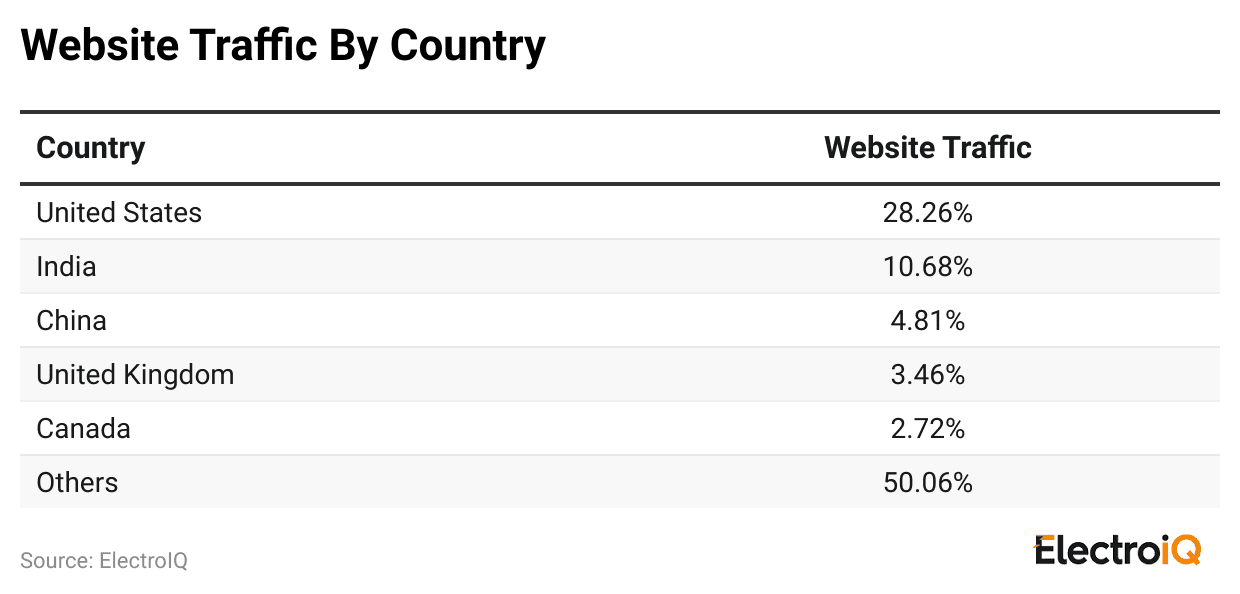
- The United States of America accounted for the highest traffic share on intel.com, at 28.26%, in September 2025, a decrease of 10.84% from the previous month.
- The following are the top five countries by website traffic share: India: 10.68% (-5.25%), China: 4.81% (-1.696%), United Kingdom: 3.46% (-12.11%), and Canada: 2.72% (-14.56%)
- The rest of the countries captured a share of 50.06% Intel’s web traffic.
By User Demographics
 (Reference: similarweb.com)
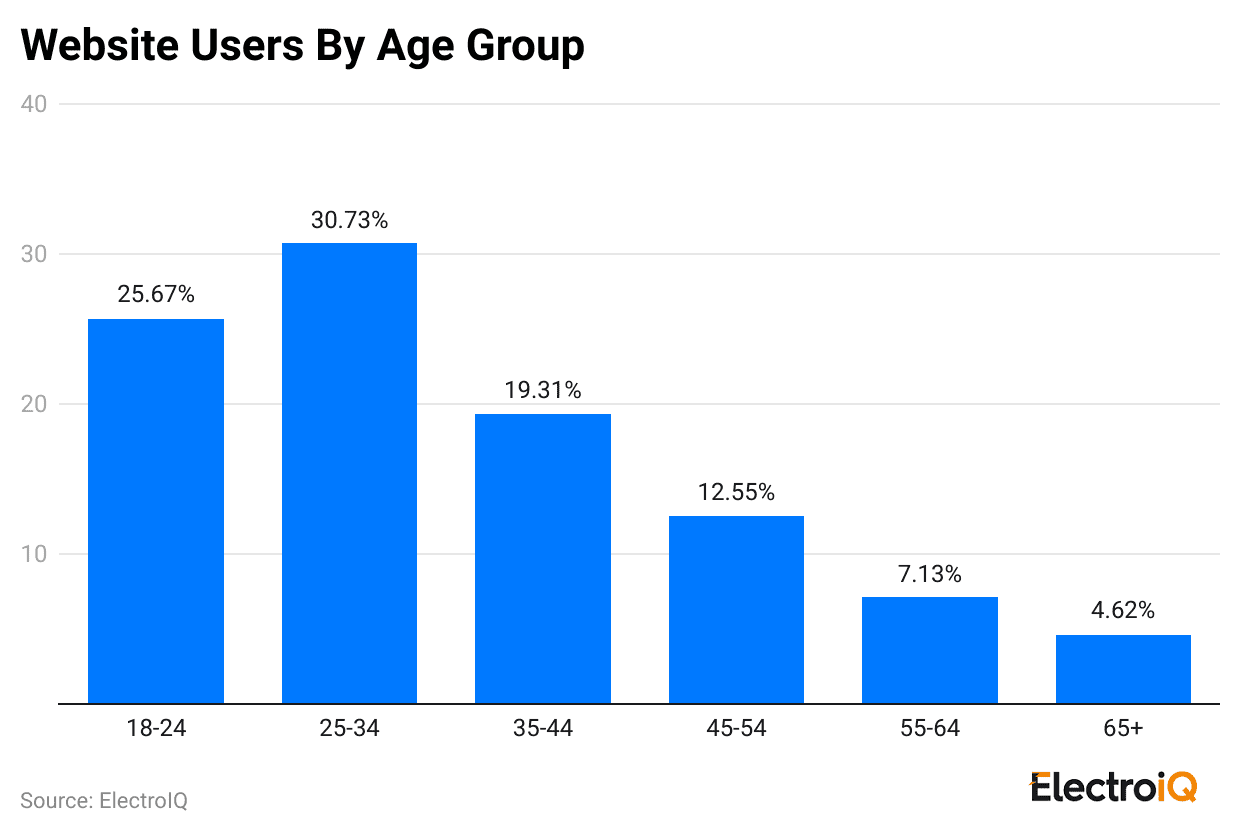
- In the same period, the total number of Intel’s website users aged 25 to 34 years accounted for the highest share, at 30.73%, followed by those aged 18 to 24 years at 25.67%.
- Furthermore, the age distribution of other users is as follows: 35 to 44 years (19.31%), 45 to 54 years (12.55%), 55 to 64 years (7.13%), and 65 years+ (4.62%)
- Based on gender, approximately 53.84% and 16% of Intel’s users were identified as male and female, respectively.
By Marketing Channels Distribution
 (Reference: similarweb.com)
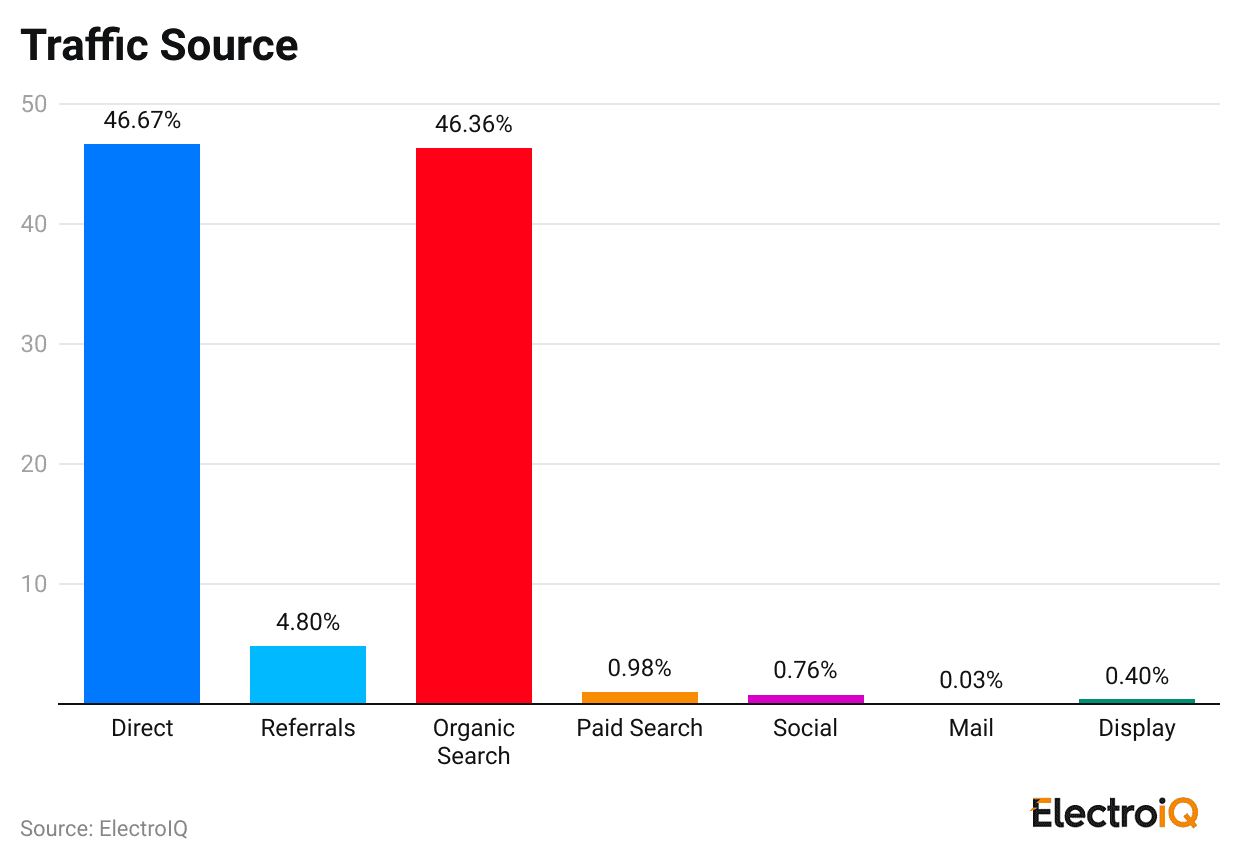
- As of September 2025, the top traffic sources for Intel’s website were direct search with a traffic share of 46.67%, followed by organic search (46.36%).
- Moreover, other marketing channel distributions are followed by referrals (4.8%), paid search (0.98%), social media (0.76%), direct mail (0.03%), and display advertising (0.4%).
By Social Media
 (Reference: similarweb.com)
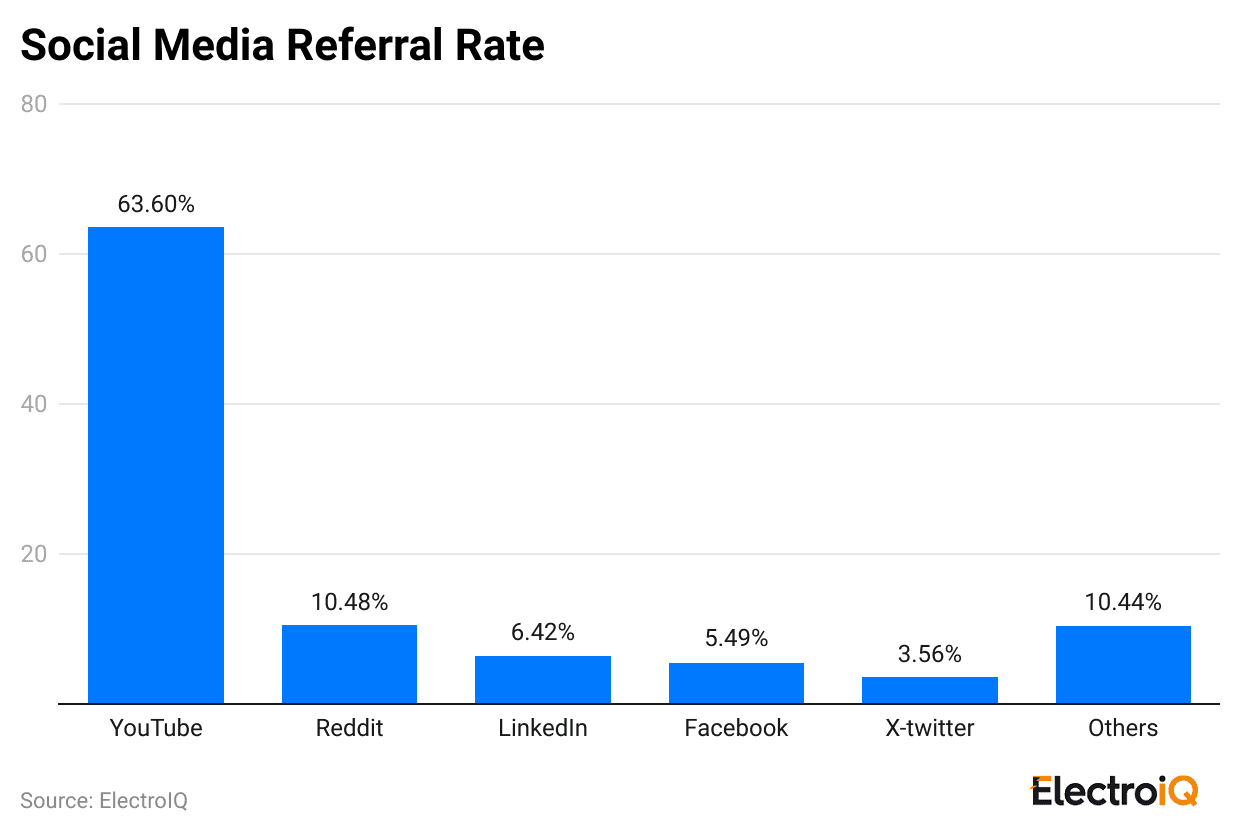
- At the same time, the top traffic sources for Intel’s website were direct search, with a traffic share of 46.67%, followed by Reddit, with a share of 10.48%.
- Other social media traffic sources include LinkedIn (6.42%), Facebook (5.49%), X-twitter (3.56%), and others (10.44%).
Conclusion
Intel remains a major force in computing. Using decades of engineering know-how, it builds faster, more energy-saving chips for data centers, laptops, and smart gadgets. The company is investing in AI, cloud tools, and advanced chip factories to better serve evolving customer needs and alleviate supply chain issues.
As computing moves toward mixed designs and greener solutions, Intel’s broad product line and factory investments help it stay flexible. By teaming up with partners and pushing for responsible manufacturing, Intel aims to continue being useful to businesses, developers, and everyday people as technology evolves.
FAQ.
Intel produces processors (CPUs), graphics chips (GPUs), AI hardware, networking solutions, and data centre technologies.
Intel is renowned for its Core, Xeon, and Pentium processors, which power computers and business systems worldwide.
Intel’s main competitors include AMD, NVIDIA, Qualcomm, and Apple in the global semiconductor and computing markets.
Intel’s factories are located in the United States, Ireland, and Israel, and are expanding across Europe and Asia.
Intel is putting money into AI, new chip designs, quantum technology, and 3D architecture to stay ahead in the digital world.

Maitrayee Dey has a background in Electrical Engineering and has worked in various technical roles before transitioning to writing. Specializing in technology and Artificial Intelligence, she has served as an Academic Research Analyst and Freelance Writer, particularly focusing on education and healthcare in Australia. Maitrayee's lifelong passions for writing and painting led her to pursue a full-time writing career. She is also the creator of a cooking YouTube channel, where she shares her culinary adventures. At Smartphone Thoughts, Maitrayee brings her expertise in technology to provide in-depth smartphone reviews and app-related statistics, making complex topics easy to understand for all readers.


