Google Statistics By Revenue, Apps, Usage and Facts (2025)
Updated · Dec 02, 2025

Table of Contents
- Introduction
- Editor’s Choice
- About Google
- General Google Statistics
- Historical Analysis of Google
- Unknown Facts About Google
- Google’s Revenue Analyses
- Operating Income of Google
- Google’s Annual Revenue From Digital Content and Hardware
- Google Revenue Statistics by Segments
- Leading Google Search Queries
- Mobile Market Share of The Google Search Engine
- Desktop Search Market Share Of Google In Selected Countries
- Update Frequency Of Apps On Google Play Store Statistics
- Share of Free And Paid Android Apps On Google Play Store
- Google Ranking Statistics
- Google’s Search Engine Market Statistics
- Google’s Search User Behaviour Statistics
- Google’s Global Market Share Statistics
- Top 10 Most Visited Websites In 2025
- Google’s Website Traffic And Visitor Statistics
- Google Apps Statistics
- People Using Google Statistics
- Google Usage Statistics By Region
- Google Searches Statistics
- Types Of Google Searches
- Audio Google Searches Statistics
- Visual Google Searches Statistics
- Google AI Statistics
- Top 5 Most Valuable Global Brands
- Current Sustainability Initiatives At Google
- Conclusion
Introduction
Google Statistics: Google LLC is a major American technology company operating worldwide today. It focuses on search, online advertising, email, cloud computing, software, quantum research, artificial intelligence, e-commerce, and consumer electronics. Often described as extremely powerful, it belongs to Alphabet Inc., widely viewed as a leading Big Tech group. From Google Search and Gmail to Android and YouTube, its products are used by billions of people every day.
As a core part of Alphabet Inc., Google continues to shape how we find information, communicate, and work online. This article on Google Statistics includes several current analyses drawn from different insights, which will effectively guide understanding of the topic.
Editor’s Choice
- A Statista report shows that in the third quarter of 2025, Google’s total revenue was USD 102.21 billion.
- Google’s operating income in the third quarter of 2025 was around USD 37.12 billion.
- As of 2024, Google’s revenue from the annual apps, media, and hardware segment totalled USD 40,340 million.
- The advertising segment accounted for the highest revenue share on Google at 75%.
- In 2025, Google is the most searched term globally with an index value of 100, followed by YouTube (93) and You (86).
- In January 2025, 93.89% of all mobile search engine use worldwide was attributed to Google.
- The top five countries’ desktop search share on Google is accounted for by India (93.99%), Brazil (89.11%), Italy (88.54%), Spain (86.41%), and Hong Kong (86.19%).
- Google’s search system uses more than 200 signals to determine where to rank a page.
- As of October 2025, Google’s search engine market share was 90.04%, slightly down from September, with 90.38%.
- About 23% of users choose one of Google’s autocomplete suggestions.
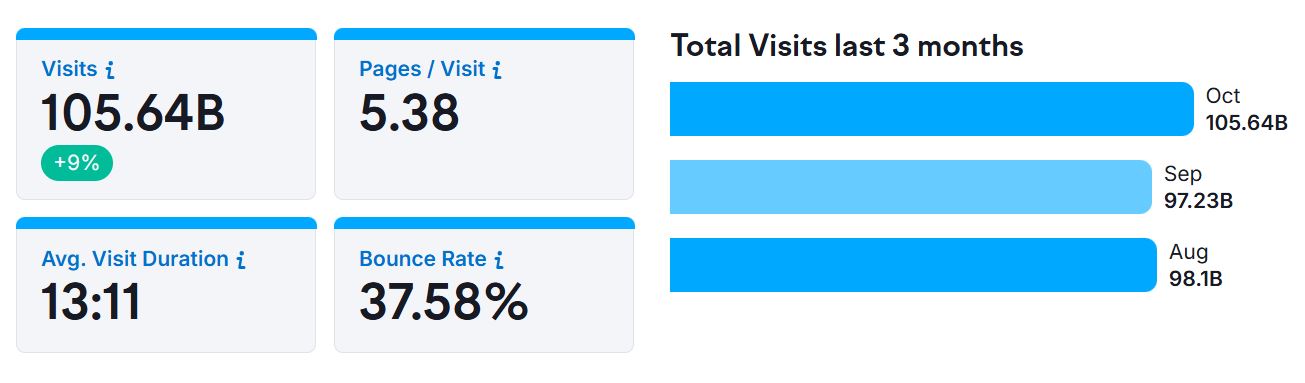
- In October, Google.com recorded about 105.64 billion visits, an increase of 8.65% compared with September.
- As of June 2024, the total number of applications available on the Google Play Store was 1.68 million.
- A report published by Exploding Topics in 2025 states that Google handles about 16.4 billion searches per day, or 189,815 searches per second.
- As of October 2025, the United States accounted for the largest share of web traffic on Google.com, at 24.52% (up by 3.34%).
- In 2025, Google’s activity is estimated to reach about 189,815 searches every second.
- According to the blog. Google and the Gemini app logged more than 650 million monthly active users in Q3 2025, with query volume three times that of the previous quarter.
About Google
| Metrics | Details |
| Company Name | Google LLC (formerly Google Inc.) |
| Parent company | Alphabet Inc. |
| Establishment Year | September 4, 1998, in Menlo Park, California, United States. |
| Headquarters | Located at the Googleplex, Mountain View, California, U.S. |
| Founders | Larry Page Sergey Brin |
| Key people | Sundar Pichai (Chief Executive Officer) Ruth Porat (President and Chief Investment Officer) Anat Ashkenazi (Chief Financial Officer) Thomas Kurian (CEO of Google Cloud) |
| Main Products | Google Search Android Nest Pixel Google Workspace Fitbit Waze YouTube Gemini, etc |
| Subsidiaries | Adscape Cameyo Charleston Road Registry Endoxon FeedBurner ImageAmerica Kaltix Nest Labs reCAPTCHA X Development YouTube ZipDash |
| Area served | Global Service |
| ASN | 15169 |
| Website | about. google |
General Google Statistics
- According to semrush.com, every minute, about 9.5 million searches happen on Google.
- In the U.S., over 60% of searches are on phones, and AI Overviews show for 13.14% of queries.
- Google holds 89.66% of the global search market.
- Its Shopping Graph lists over 35 billion products, and Google Lens handles 12 billion searches monthly.
- According to Digital Silk, as of October 14, 2025, about 49% of shoppers use Google to find a new product.
- When people search for something near them, 28% of those Google searches end in a purchase.
- Additionally, around 50% of users click a result within the first 9 seconds.
- Just 9% of people scroll all the way down to the end of Google’s first search results page.
(Reference: digitalsilk.com)
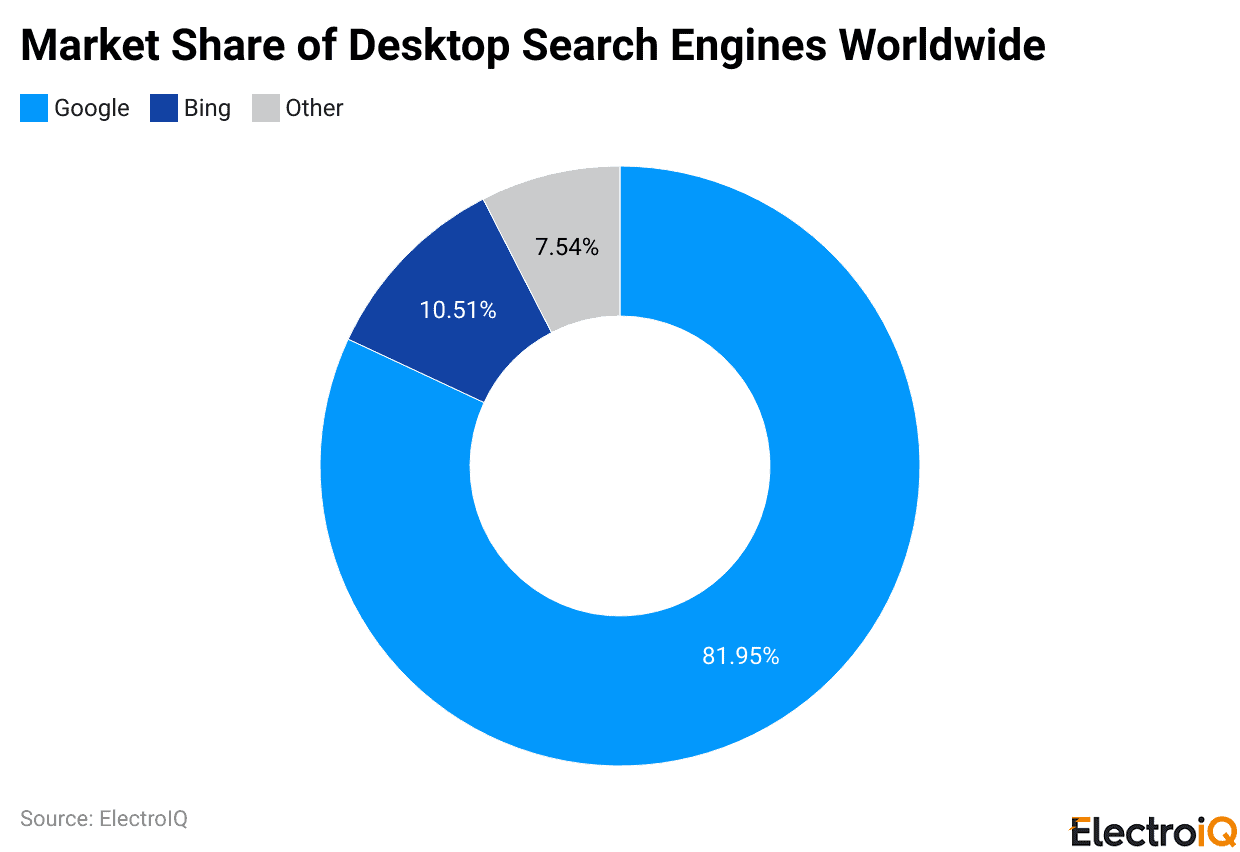
- In 2025, Google clearly dominates, holding about 81.95% of the market.
- Meanwhile, Bing ranks second with around 10.51%, while all other search engines together account for only about 7.54%.
- On Google, the United States accounted for 19.44% of traffic, and the rest of the world accounted for 80.56%.
Historical Analysis of Google
- According to Wikipedia, in September 2025, U.S. federal judge Amit Mehta ruled that Google could keep Chrome and the Android operating system and did not have to sell them.
- In July, the U.S. Department of Defence announced a USD 200 million contract for military AI that went to Google, Anthropic, OpenAI, and xAI.
- That March, Google agreed to buy Wiz, a New York cybersecurity start-up, in a USD 32 billion deal.
- In November 2024, Google announced it would open a new AI hub in Saudi Arabia to support the country’s economic growth and Vision 2030.
- In another September decision, the Court of Justice of the European Union in Luxembourg found that Google had an illegal monopoly in shopping search and imposed a fine of Euro 2.4 billion.
- In early May 2023, Google announced plans to build 2 additional data centres in Ohio.
- That March, as ChatGPT spread, Google launched Bard, now called Gemini, as a generative AI chatbot.
- In December 2022, Google released OSV-Scanner, a Go tool that finds security issues in open-source software by leveraging a vulnerability database to combat supply-chain attacks.
- In May, Google acquired Raxium, a California-based microLED display start-up.
- In September 2021, the Australian government said it wanted to curb Google’s ability to sell targeted ads, arguing its monopoly harmed publishers, advertisers, and consumers.
- In another March report, Google was said to have paid USD 20 million for Ubisoft ports on Google Stadia.
- In January, the Australian government proposed laws requiring Google and Facebook to pay media companies for using their content.
Unknown Facts About Google
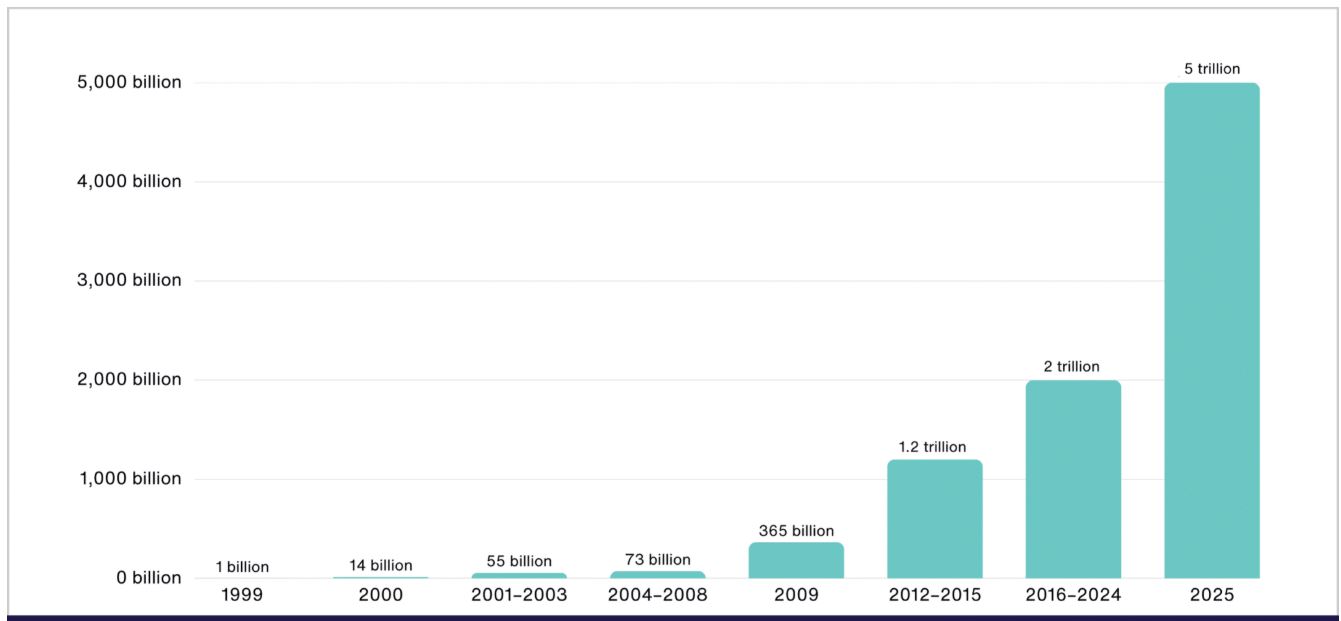
- Google was first named “Backrub,” and its earliest data centre was in Larry Page’s dorm.
- In 1999, indexing 50 million pages took a month; by 2012, it took under a minute.
- Each search travels about 1,500 miles, touches around 1,000 computers, and comes back in 0.2 seconds.
- Google handles 40,000+ searches per second (about 2 million per minute), with 16% to 20% of them being entirely new.
- Its simple homepage loads quickly for an index of 100+ GB.
- Results use 200+ ranking signals, real-time autocomplete, mobile-friendly prioritisation, the Knowledge Graph, translation in 100+ languages, and algorithms such as Panda, Penguin, and Hummingbird.
- The 1998 Burning Man doodle was the first. The “I’m Feeling Lucky” button skips to the top result and costs about USD 110 million in lost ad revenue each year.
Google’s Revenue Analyses
(Reference: statista.com)
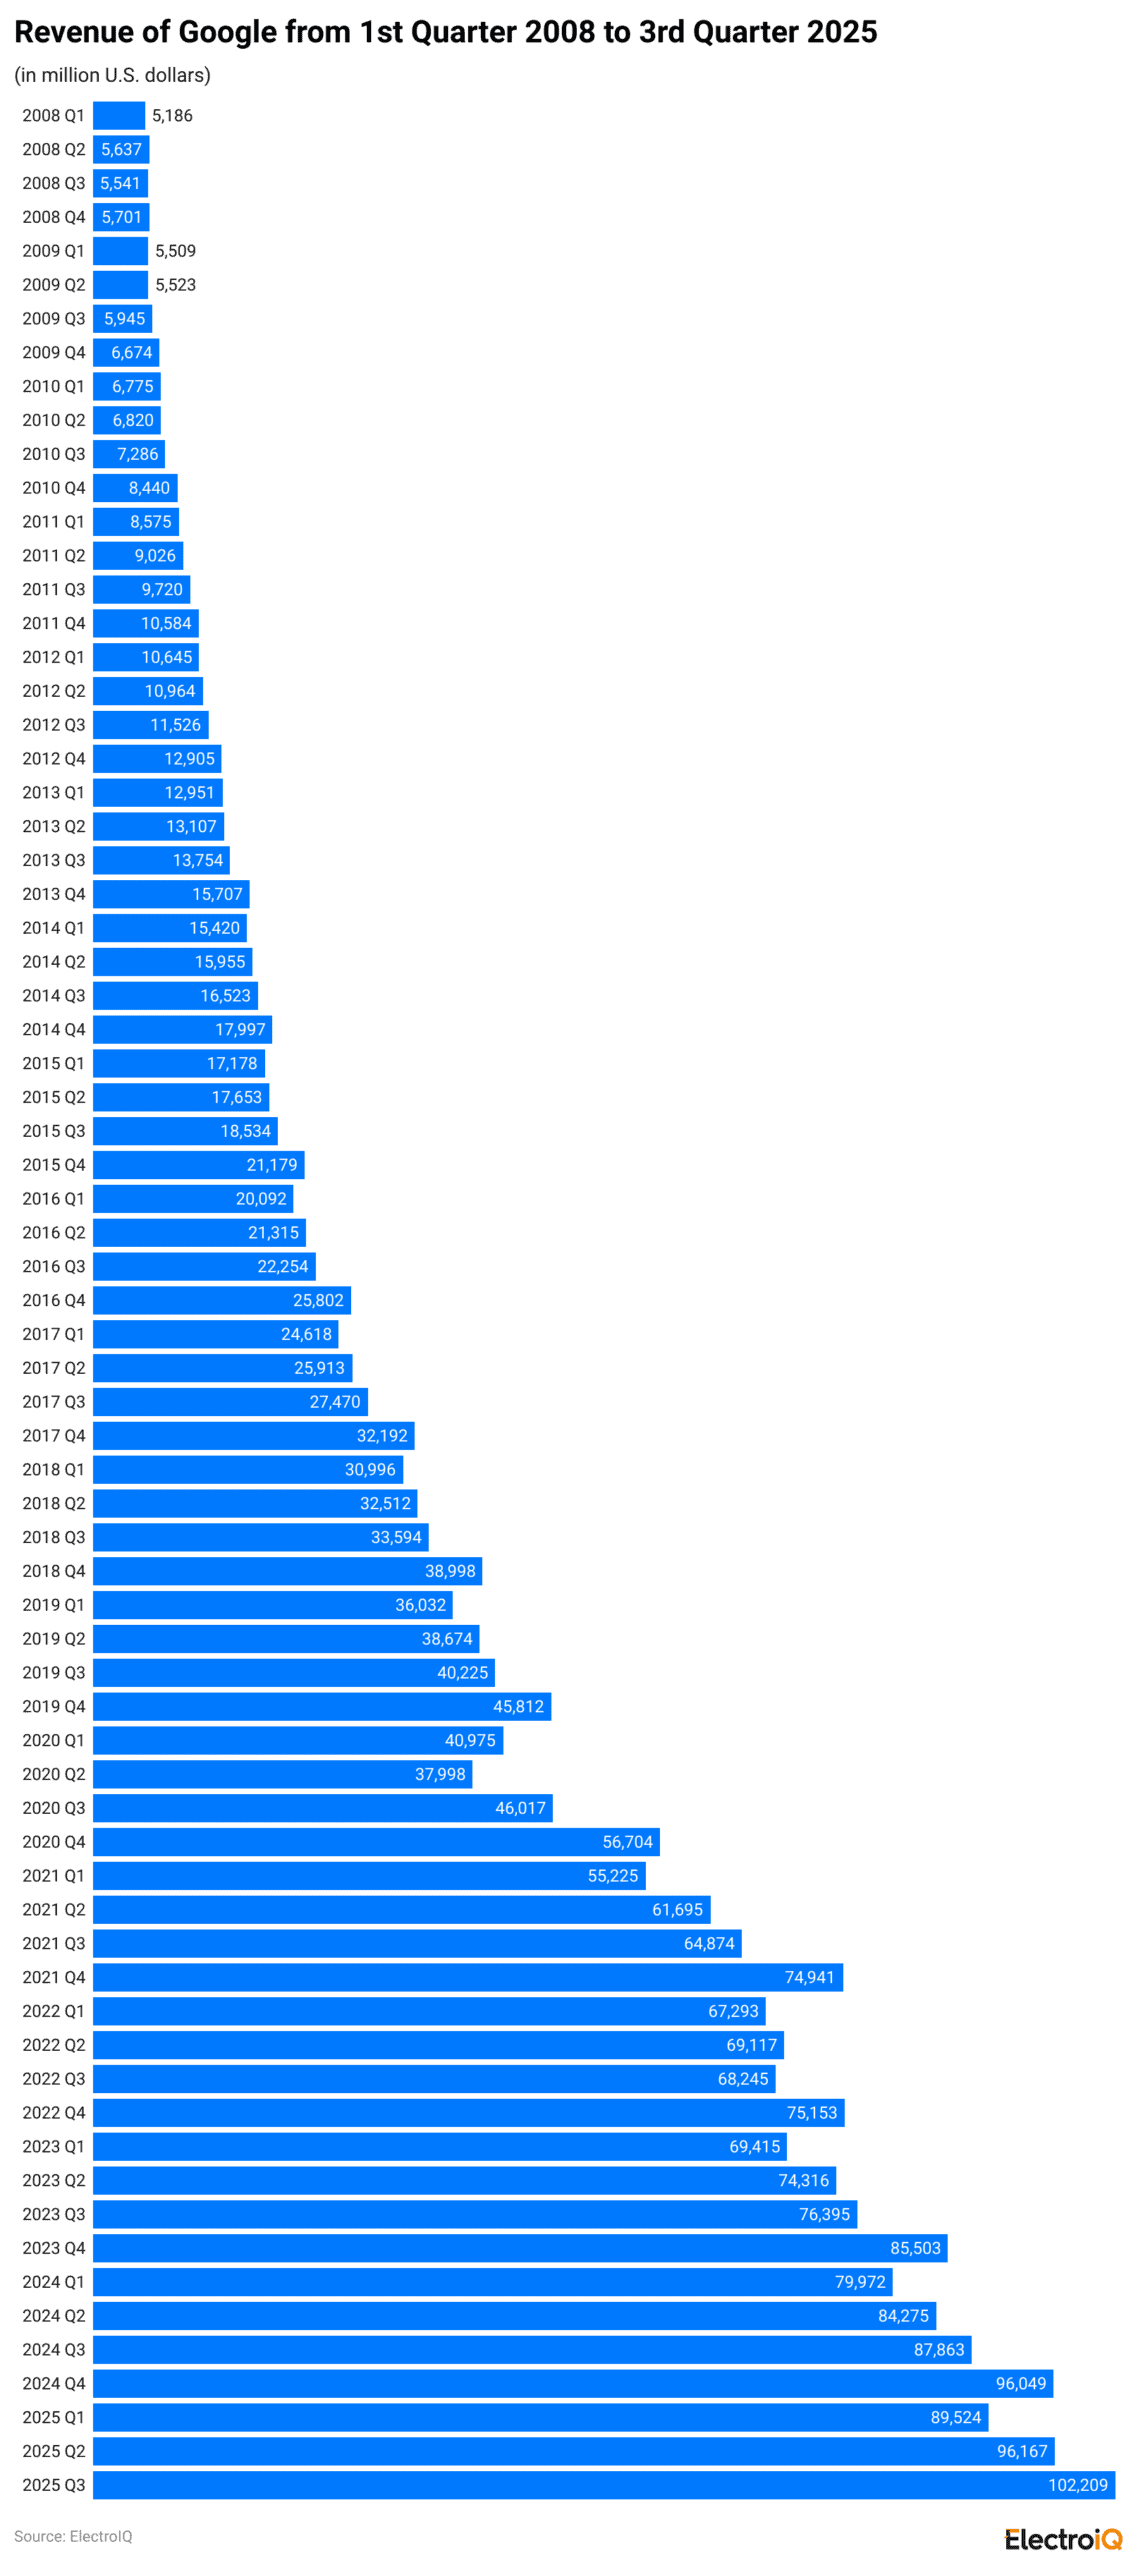
- A Statista report shows that in the third quarter of 2025, Google’s total revenue was USD 102.21 billion.
- Besides, the other 2025 quarterly analyses were Q2 (USD 96,167 million) and Q1 (USD 89,524 million).
Quarterly revenue in the previous years is stated in the table below:
|
Year
|
Q1 | Q2 | Q3 | Q4 |
| Revenue (USD million) | ||||
| 2024 | 79,972 | 84,377 | 87,863 | 96,049 |
| 2023 | 69,415 | 74,316 | 76,397 | 85,503 |
| 2022 | 67,293 | 69,117 | 68,245 | 75,153 |
| 2021 | 55,225 | 61,695 | 64,874 | 74,941 |
| 2020 | 40,975 | 37,998 | 46,017 | 56,704 |
Operating Income of Google
 (Reference: statista.com)
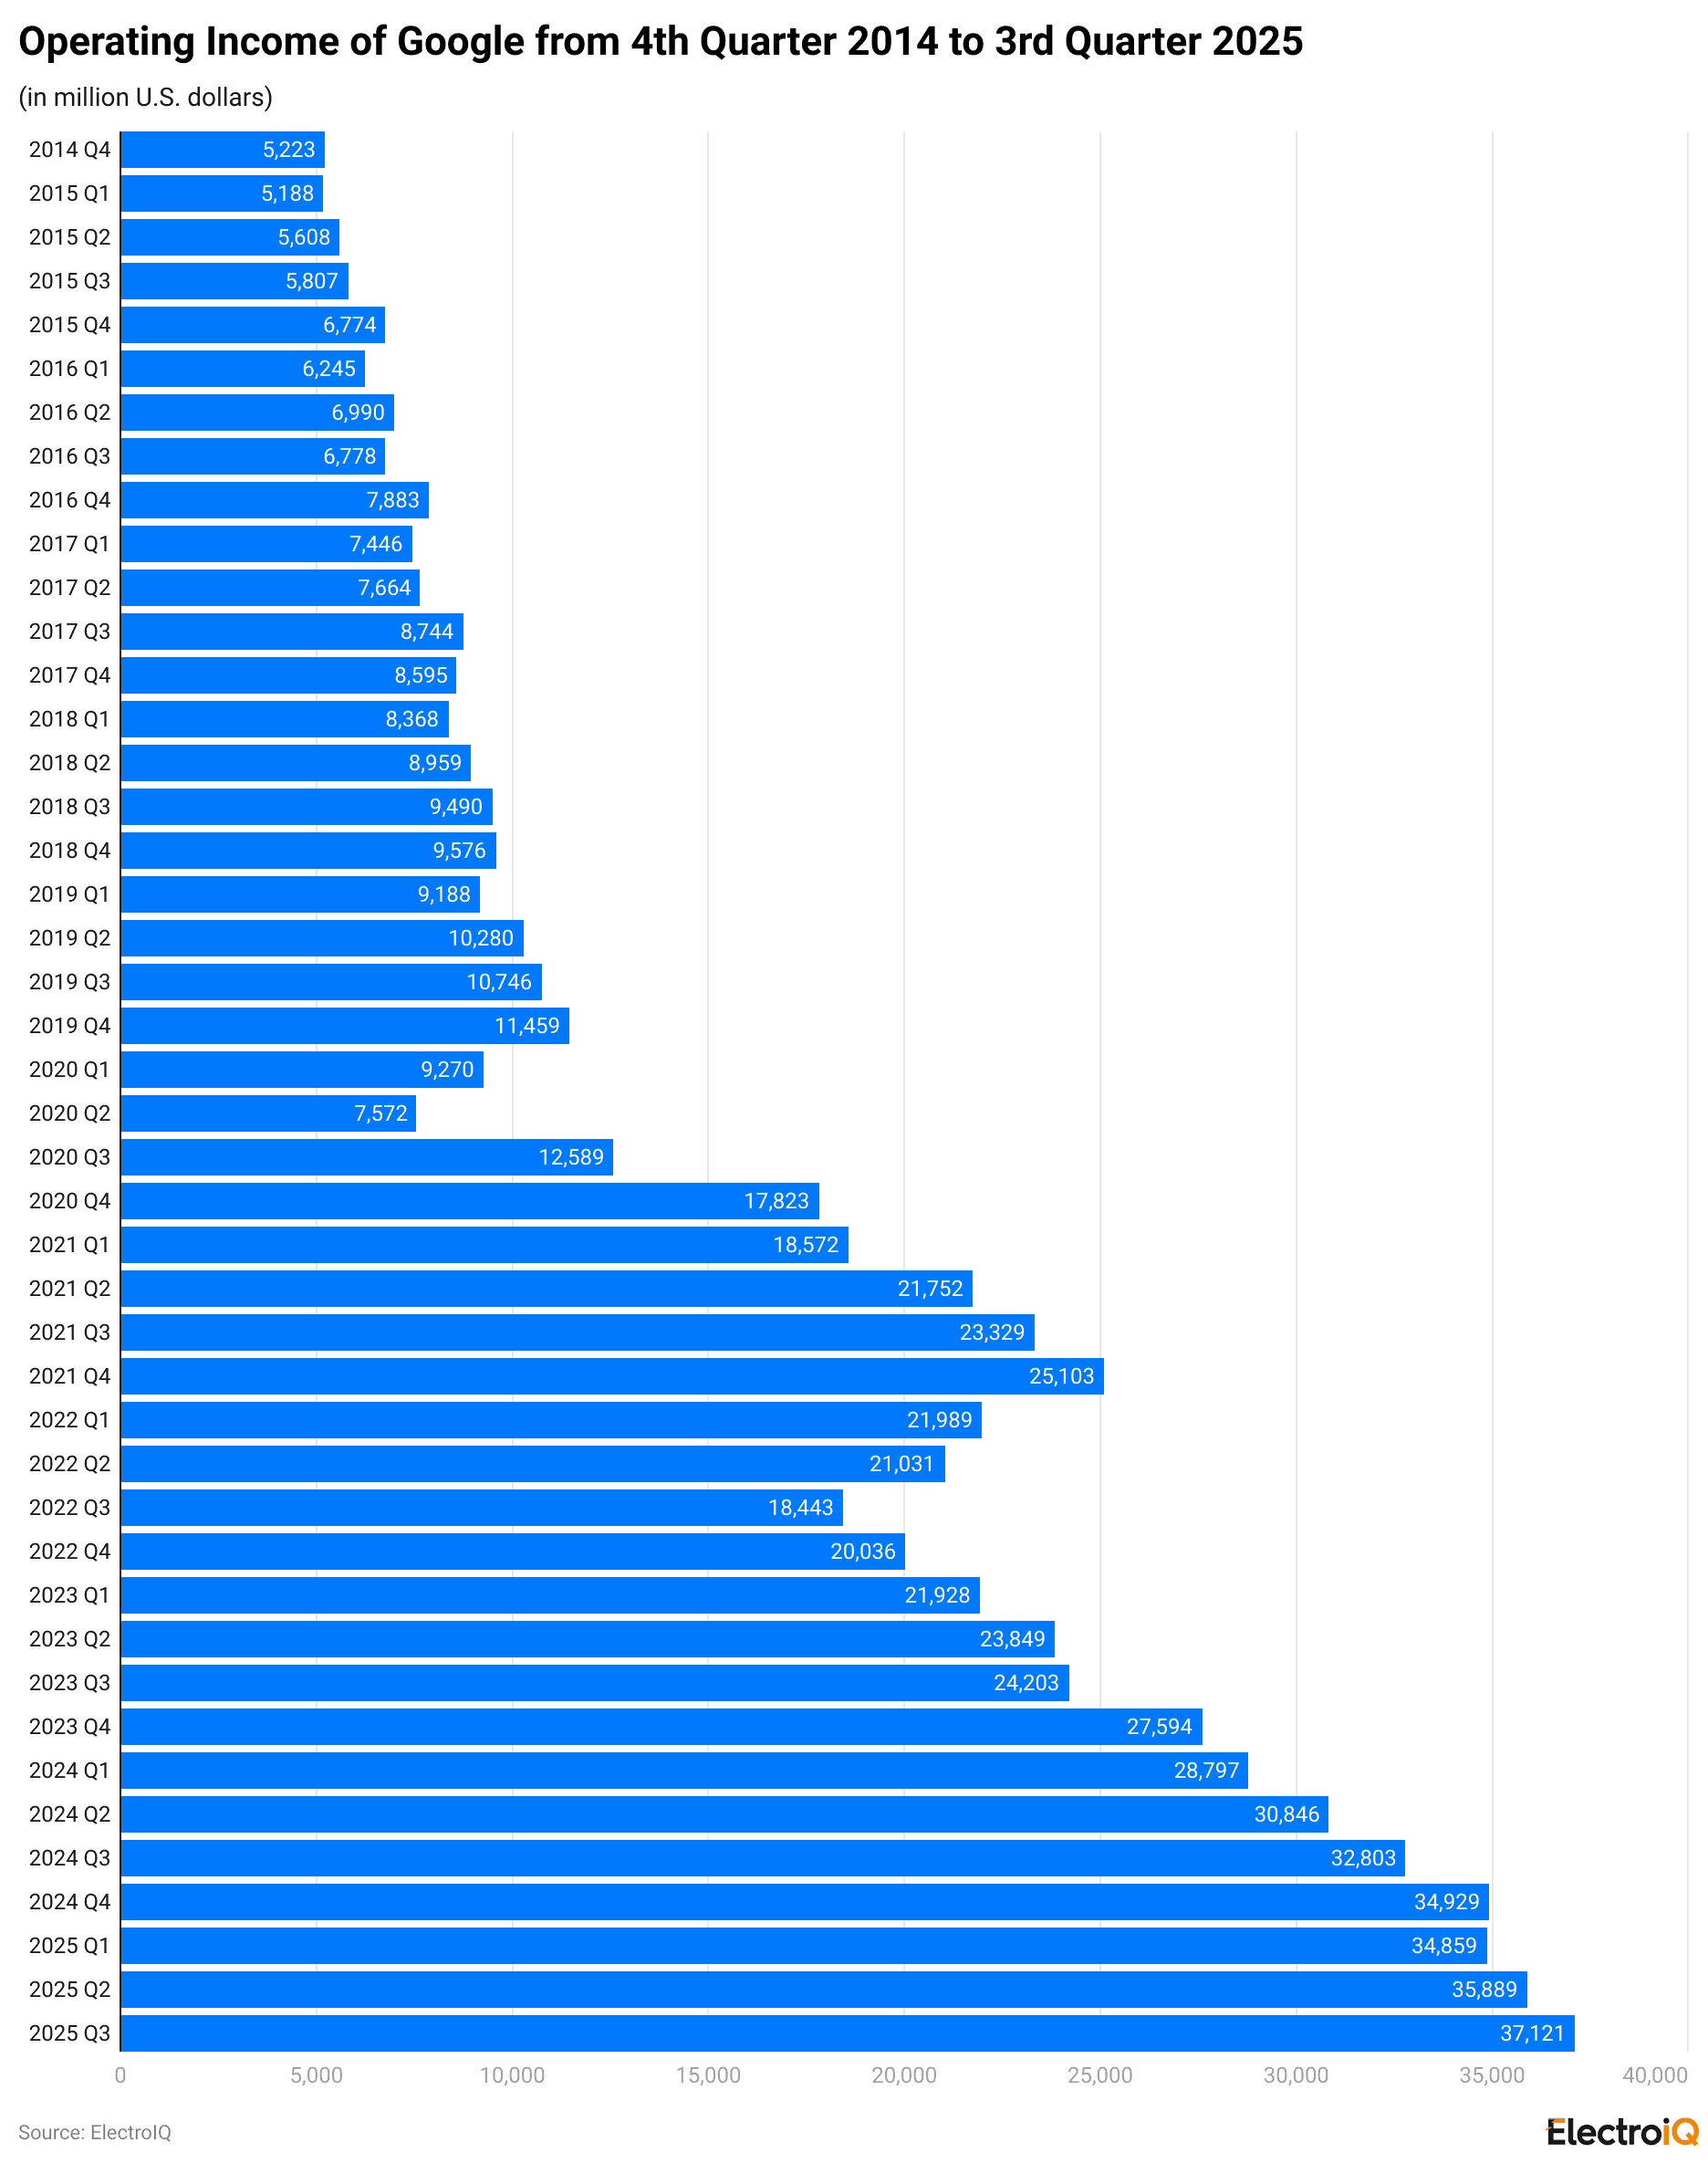
- Google’s operating income in the third quarter of 2025 was around USD 37.12 billion.
- Moreover, in the first and second quarters of the year, the operating income was USD 35,889 million and USD 34,859 million, respectively.
Quarterly revenue in the previous years is stated in the table below:
|
Year
|
Q1 | Q2 | Q3 | Q4 |
| Operating Income (USD million) | ||||
| 2024 | 28,797 | 30,846 | 32,803 | 34,929 |
| 2023 | 21,928 | 23,849 | 24,203 | 27,594 |
| 2022 | 21,989 | 21,031 | 18,443 | 20,036 |
| 2021 | 18,572 | 21,752 | 23,329 | 25,103 |
| 2020 | 9,270 | 7,572 | 12,589 | 17,823 |
Google’s Annual Revenue From Digital Content and Hardware
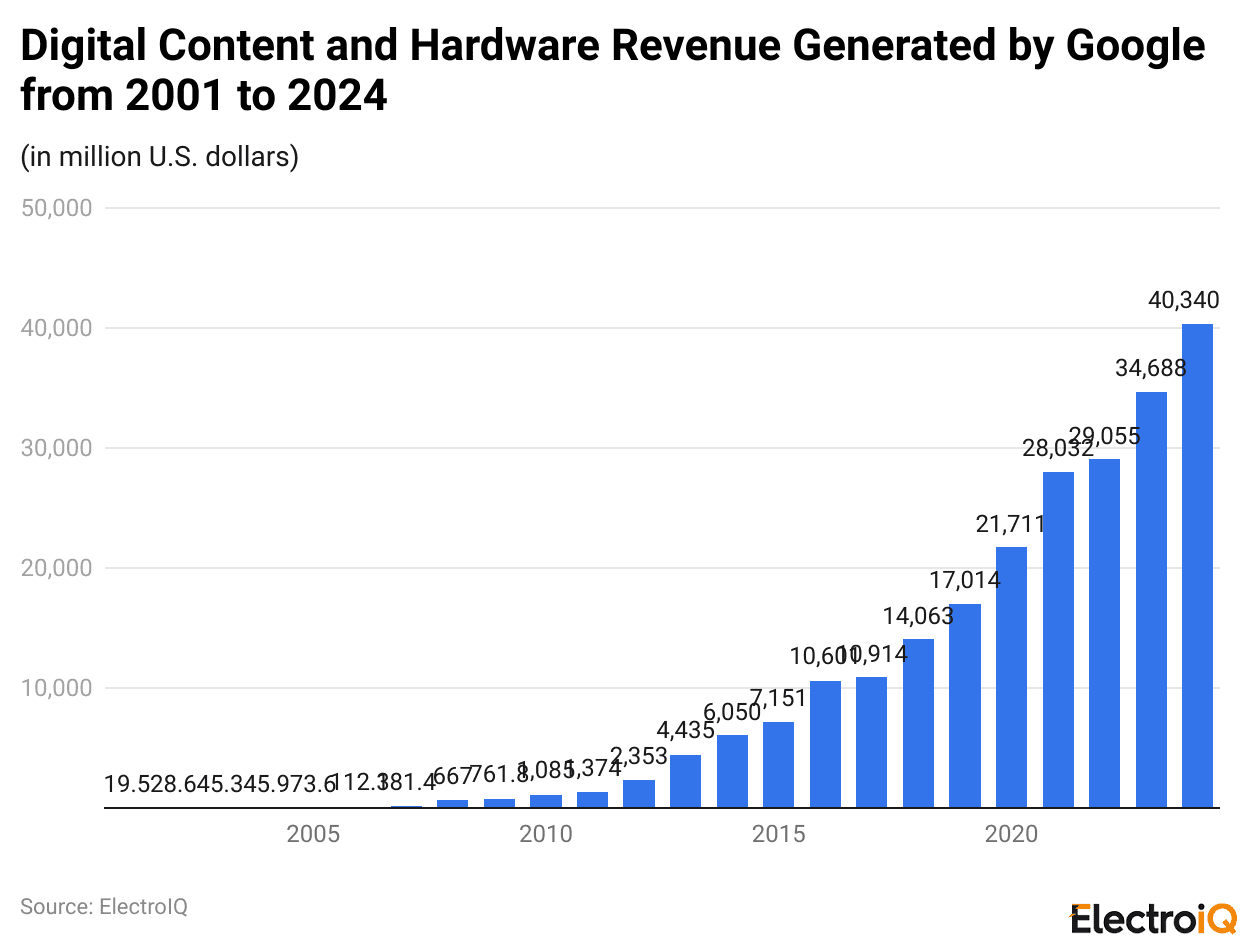
(Reference: statista.com)
- As of 2024, Google’s revenue from the annual apps, media, and hardware segment totalled USD 40,340 million.
- Besides, revenue generated in the previous years was 2023 (USD 34,688 million), 2022 (USD 29,055 million), 2021 (USD 28,032 million), and 2020 (USD 21,711 million).
Google Revenue Statistics by Segments
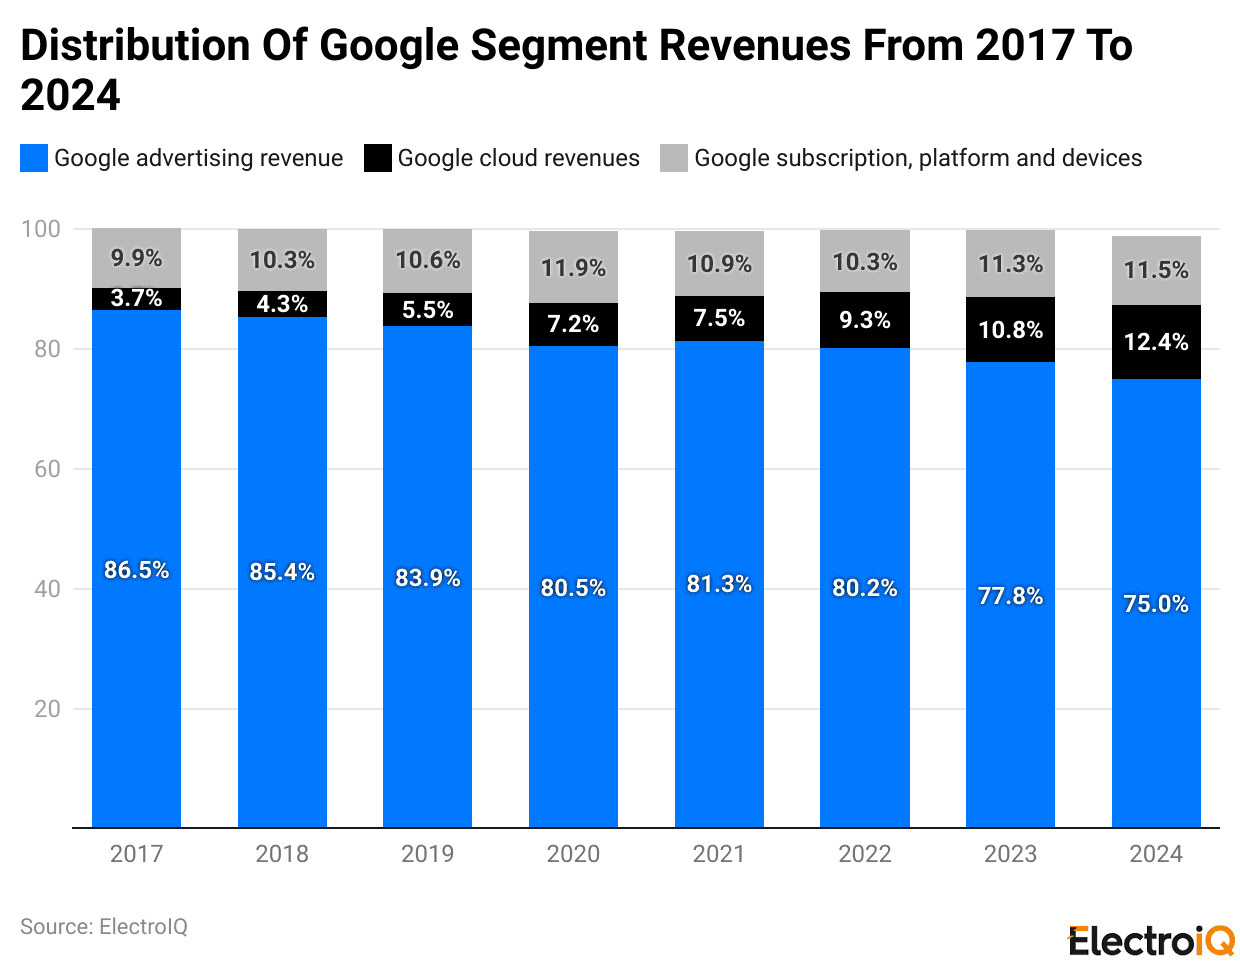
(Reference: statista.com)
- As of 2024, the advertising segment accounted for the highest revenue share on Google at 75%.
- Meanwhile, Google Cloud captured 12.4% of revenue, and Google Subscriptions, Platforms, and Devices accounted for 11.5%.
Furthermore, other segmental revenue shares in the previous years are mentioned below:
| Year | Google Advertising | Google Cloud | Google Subscription, Platform, and Devices |
| 2023 | 77.8% | 10.8% | 11.3% |
| 2022 | 80.2% | 9.3% | 10.3% |
| 2021 | 81.3% | 7.5% | 10.9% |
| 2020 | 80.5% | 7.25 | 11.9% |
Leading Google Search Queries
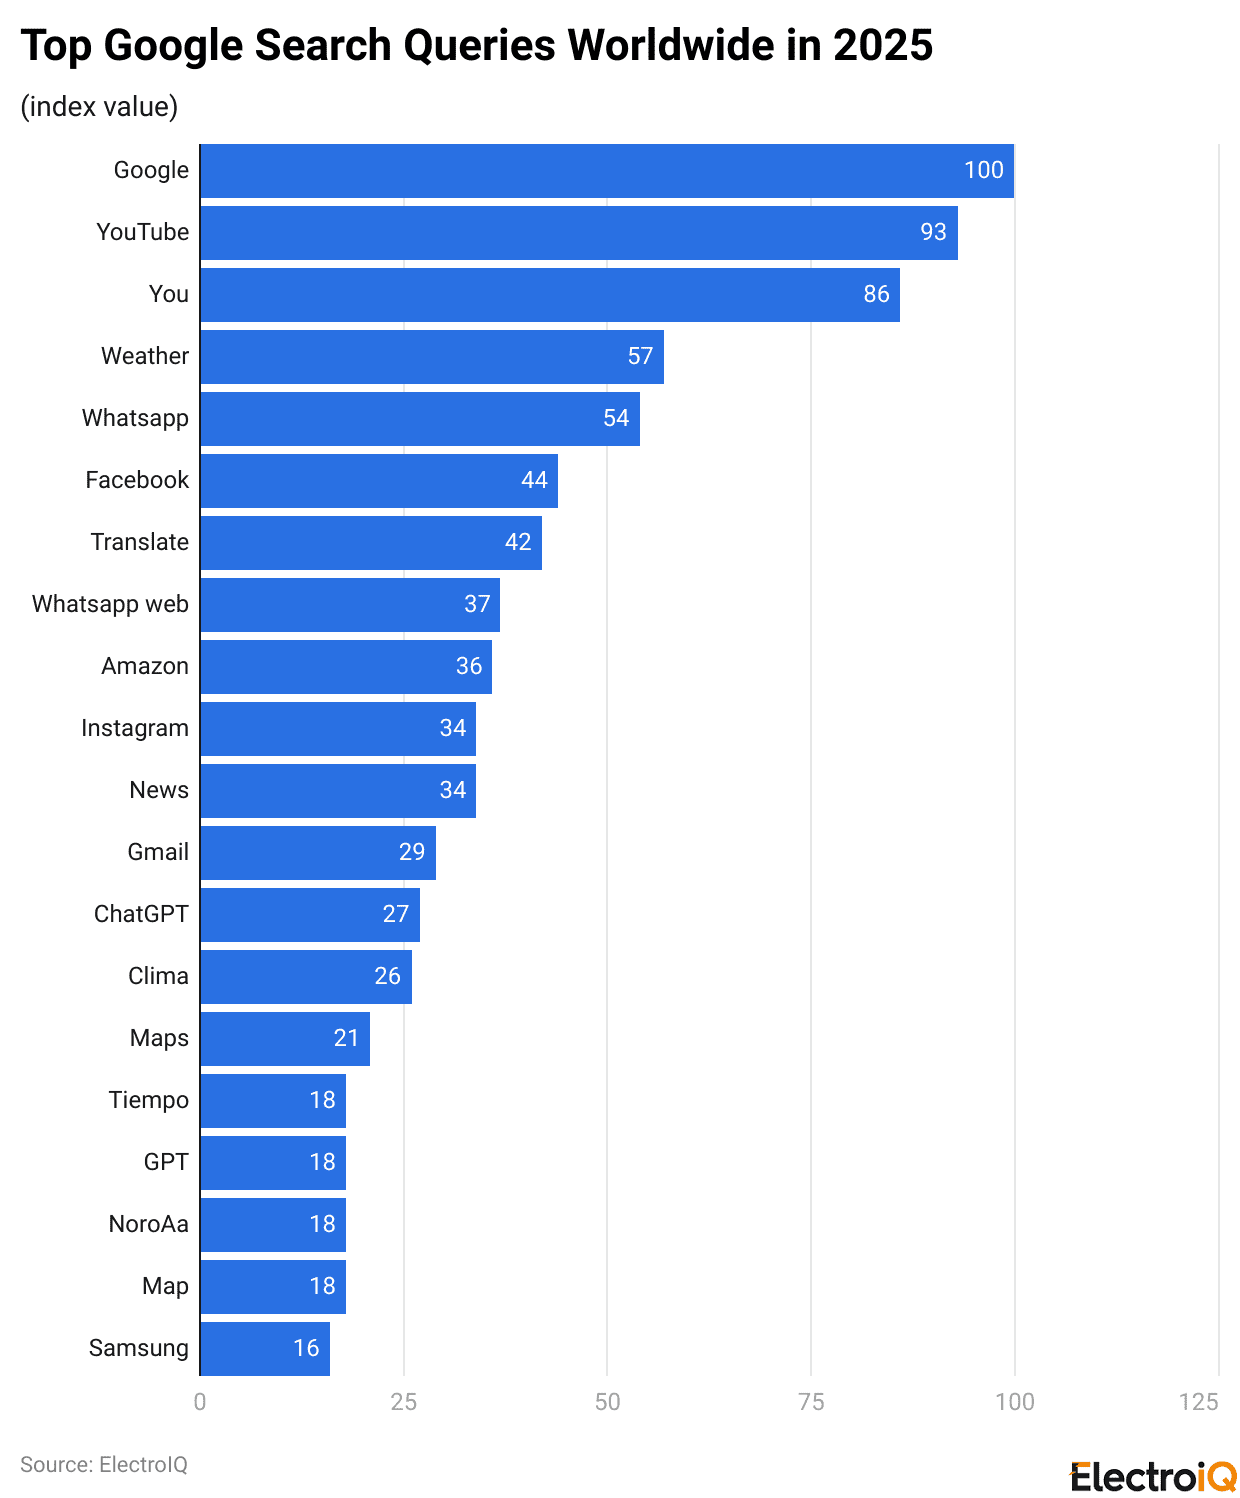
(Reference: statista.com)
- In 2025, Google is the most searched term globally with an index value of 100, followed by YouTube (93) and You (86).
- Furthermore, other search queries with index values are followed as Weather (57), WhatsApp (54), Facebook (44), Translate (42), WhatsApp web (37), Amazon (36), Instagram (34), News (34), Gmail (29), ChatGPT (27), Clima (26), Maps (21), Tiempo (18), GPT (18), Map (18), and Samsung (16).
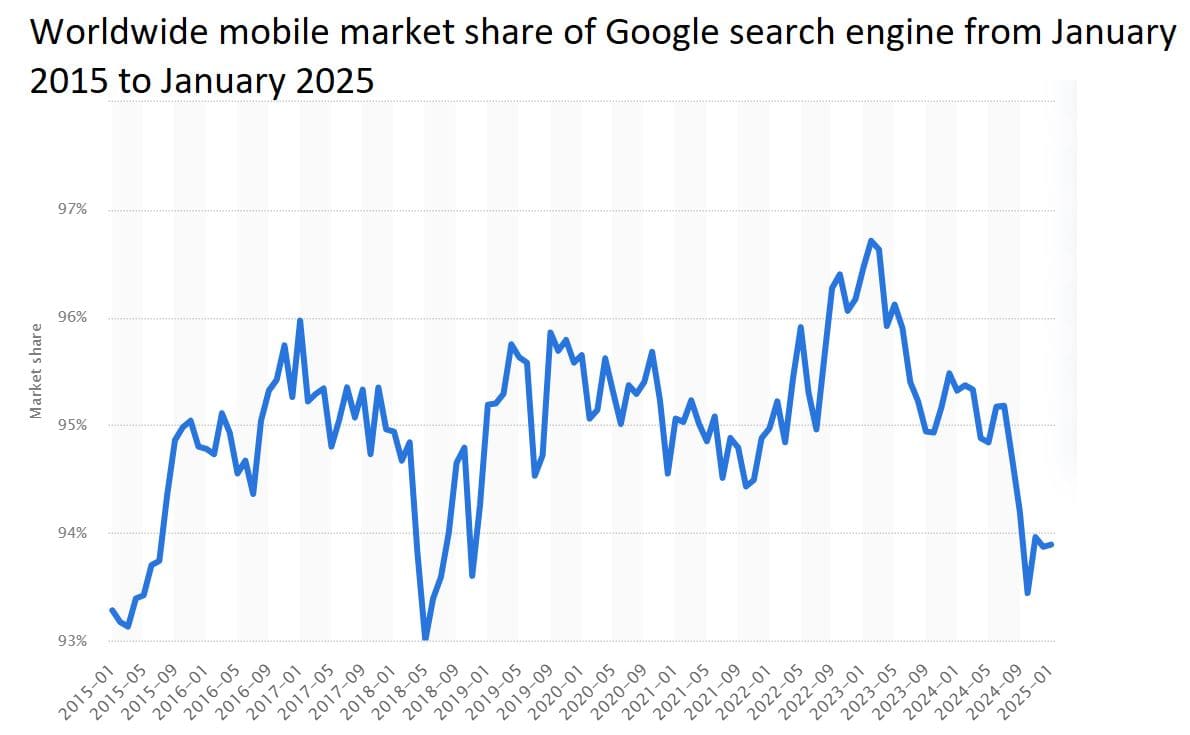
(Source: statista.com)
- In January 2025, 93.89% of all mobile search engine use worldwide was attributed to Google.
Furthermore, in 2024, the monthly global market share of the Google search engine is stated in the table below:
| Months | Market Share |
| December | 93.87% |
| November | 93.96% |
| October | 93.44% |
| September | 94.20% |
| August | 94.70% |
| July | 95.18% |
| June | 95.17% |
| May | 94.84% |
| April | 94.88% |
| March | 95.33% |
| February | 95.37% |
| January | 95.32% |

(Reference: statista.com)
- The top five countries’ desktop search share on Google is accounted for by India (93.99%), Brazil (89.11%), Italy (88.54%), Spain (86.41%), and Hong Kong (86.19%).
- Besides, other countries’ shares are followed as Australia (86.17%), Canada (83.66%), the United Kingdom (82.35%), France (80.95%), Germany (80.63%), the United States (75.78%), Japan (71.67%), South Korea (71.4%), Russia (41.67%) and China (8.78%).
Update Frequency Of Apps On Google Play Store Statistics
(Reference: statista.com)
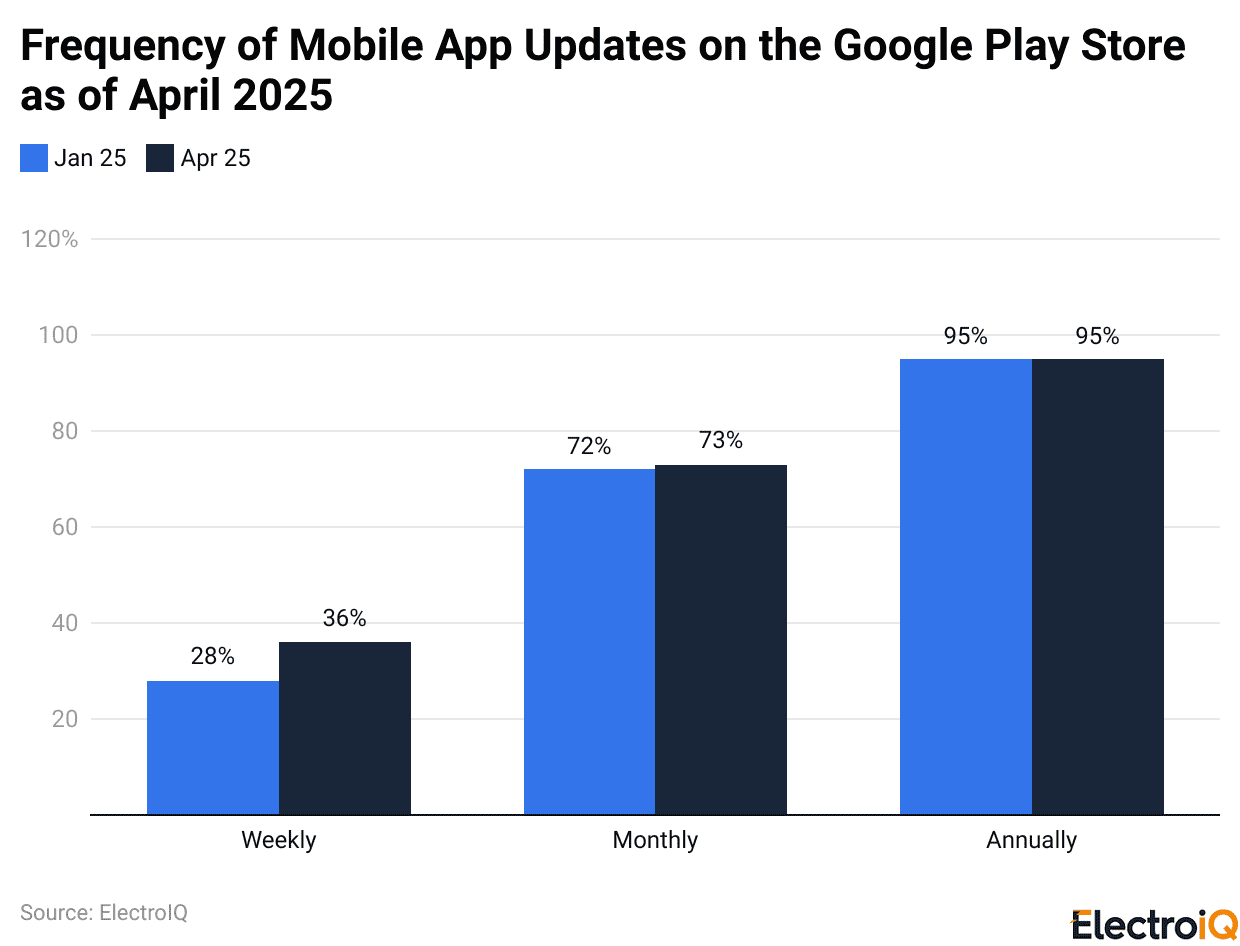
- Most apps on the Google Play Store were updated at least once a year, with 95% of apps updated annually in both January and April 2025.
- As of 2025, monthly updates include 72% of apps updated in January and 73% in April.
- Weekly updates were fewer, rising from 28% of apps in January to 36% in April.
(Reference: statista.com)
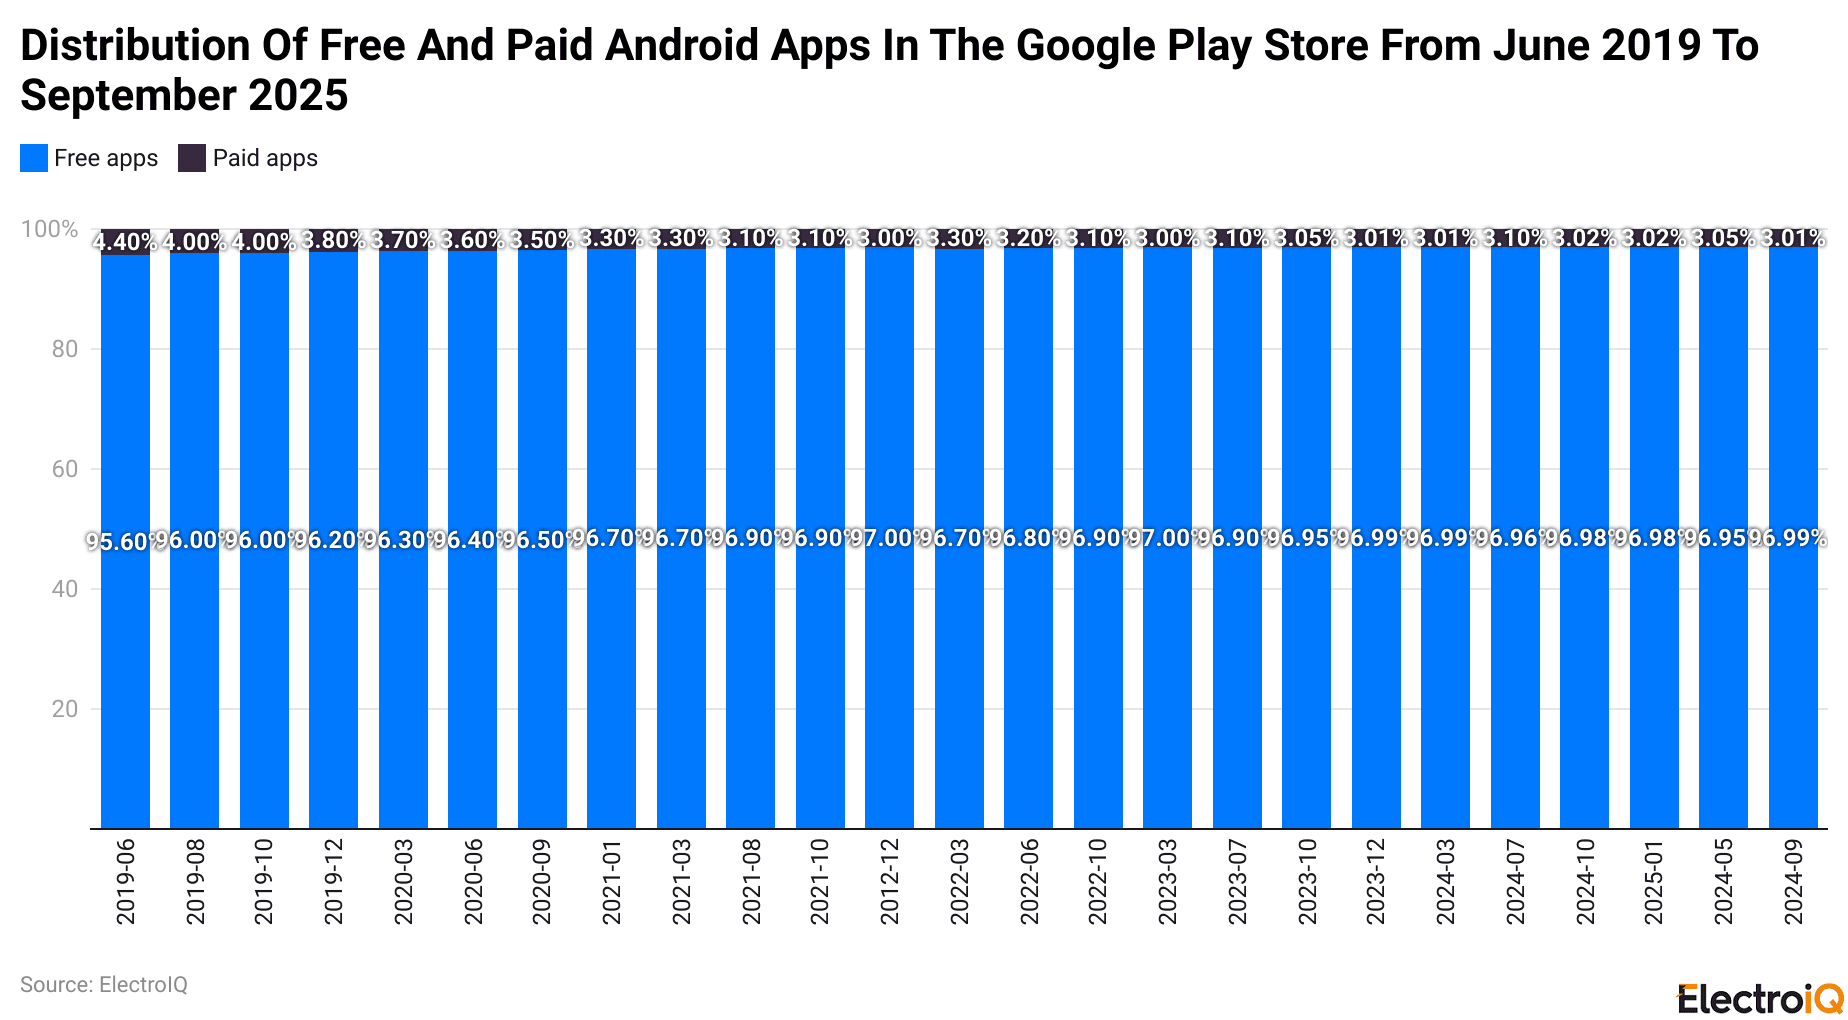
- In September 2025, approximately 96.99% of Android apps on Google Play were free, while only 3.01% were paid.
Moreover, other quarterly Apps shared on the Google Play Store are mentioned below:
| Date | Free apps | Paid apps |
| May, 2025 | 96.95% | 3.05% |
| January, 2025 | 96.98% | 3.02% |
| October, 2024 | 96.98% | 3.02% |
| July, 2024 | 96.96% | 3.04% |
| March, 2024 | 96.99% | 3.01% |
| December, 2023 | 96.90% | 3.10% |
Google Ranking Statistics
- Google’s search system uses more than 200 signals to determine where to rank a page.
- The three strongest ones are high-quality content, good page experience, and solid links.
- About 50% of users choose a result within 9 seconds, and only 9% scroll to the bottom of page 1, while just 0.44% reach page 2.
- Around 65% of searches lead to a click on an organic result, yet 59% of visitors see only one page.
- The top result gets 27.6% of clicks, about 60% of the top 10 pages are three years old or more, and only 5.7% reach the top 10 within one year.
Google ranking performance of pages is stated below:
| Rank Category | Share of Pages |
| Rank in the top 10 | 5.7% |
| Rank in the top 11 to 100 | 19.5% |
| Not in the top 100 | 74.8% |
- On average, page-one organic Google results contain 1,447 words.
- Around 43.7% of Ahrefs’ top pages had reciprocal links.
- Ahrefs estimates with 99.58% certainty that featured snippets come from top-10 pages.
- About 87.6% of results show little or no AI, and only 3% are fully AI.
- AI overviews appear for 8.71% of keywords, while 96.55% of content gets no Google traffic.
Google’s Search Engine Market Statistics
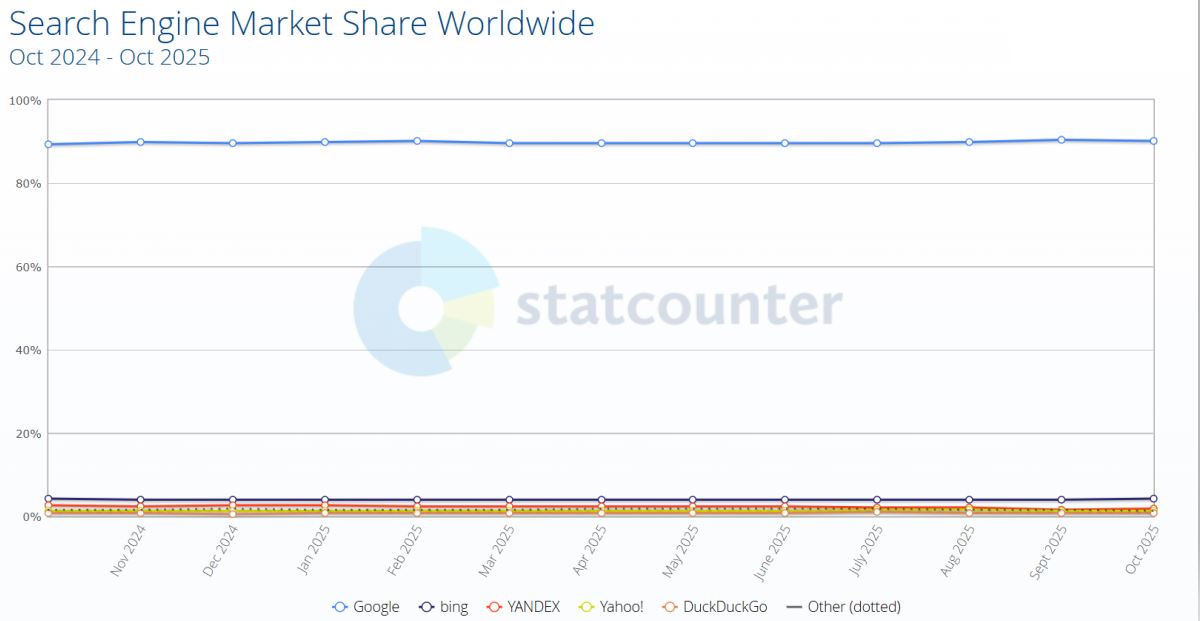
(Source: statcounter.com)
- As of October 2025, Google’s search engine market share was 90.04%, slightly down from September, with 90.38%.
Additionally, other monthly market shares of Google’s search engines in 2025 are mentioned below:
| Months | Market Share |
| August | 89.89% |
| July | 89.54% |
| June | 89.54% |
| May | 89.57% |
| April | 89.65% |
| March | 89.71% |
| February | 90.15% |
| January | 89.78% |
By Geographic Analysis (October 2025)
| Region/Country | Market Share |
| Asia | 91.39% |
| North America | 85.68% |
| South America | 92.50% |
| Europe | 88.85% |
| Oceania | 91.03% |
| Africa | 96.50% |
| United States of America | 85.10% |
| United Kingdom | 92.47% |
| India | 97.41% |
| Canada | 87.65% |
| Germany | 84.55% |
Google’s Search User Behaviour Statistics
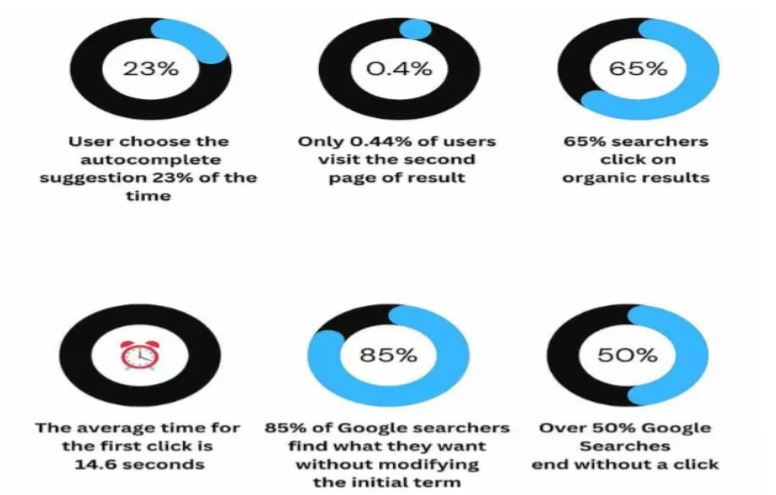
(Source: market.us)
- About 23% of users choose one of Google’s autocomplete suggestions.
- Meanwhile, only 0.44% of them visit the second page of the results.
- Around 65% of searchers click on organic (non-paid) results.
- On average, it takes 14.6 seconds for someone to make their first click.
- Approximately 85% of Google searches return results without changing the original search term, and 50% of Google searches end without any clicks.
| Year | Market Share | Change Rate |
| 2025 | 89.57% | -2.07% |
| 2024 | 91.47% | -1.43% |
| 2023 | 92.90% | +1.09% |
| 2022 | 91.90% | +0.04% |
| 2021 | 91.86% | -0.70% |
| 2020 | 92.51% | -0.38% |
Top 10 Most Visited Websites In 2025
| Website | Visits | Pages / Visit | Bounce Rate |
| google.com | 105,639,948,420 | 5.38 | 37.58% |
| youtube.com | 48,855,932,719 | 8.74 | 30.81% |
| facebook.com | 9,667,903,834 | 7.37 | 47.48% |
| chatgpt.com | 6,014,424,297 | 3.98 | 40.75% |
| instagram.com | 5,792,098,446 | 8.69 | 50.72% |
| reddit.com | 5,156,718,021 | 3.46 | 59.81% |
| wikipedia.org | 4,859,209,722 | 3.22 | 58.71% |
| pornhub.com | 4,037,812,283 | 7.55 | 22.92% |
| x.com | 3,907,153,654 | 8.52 | 47.38% |
| yahoo.com | 3,243,568,828 | 3.92 | 49.85% |
Google’s Website Traffic And Visitor Statistics
(Source: semrush.com)
- In October, Google.com recorded about 105.64 billion visits, an increase of 8.65% compared with September.
- On average, each visit included around 5.38 page views and lasted about 13 minutes and 11 seconds.
- On Google.com, almost 72.89% of visits come from mobile devices, while 27.11% come from desktop computers.
The website’s visitors’ distribution (October 2025) based on different countries is stated below:
| Country | All Devices (Billion) |
Visitor’s Share | Desktop | Mobile |
| United States | 23.83 | 22.56% | 29.13% | 70.87% |
| Japan | 6.34 | 6% | 16.79% | 83.21% |
| India | 5.68 | 5.38% | 24.40% | 75.60% |
| Brazil | 5.56 | 5.26% | 23.98% | 76.02% |
| United Kingdom | 4.06 | 3.84% | 27.30% | 72.70% |
Monthly Visits of Google Domain Statistics by Country (July 2025):
| Domain Names | Unique Monthly Visits |
| google.com (USA) | 5.8 billion |
| google.co.uk (UK) | 28.7 million |
| google.co.in (India) | 38.2 million |
| google.de (Germany) | 28.7 million |
| google.co.kr (Republic of Korea) | 15.3 million |
| google.com.br (Brazil) | 41.3 million |
| google.co.jp (Japan) | 24.1 million |
| google.ca (Canada) | 15.2 million |
| google.ru (Russia) | 10.7 million |
| google.com.mx (Mexico) | 14.4 million |
| google.co.id (Indonesia) | 95.5 million |
| google.com.hk (Hong Kong) | 16.2 million |
| google.com.pk (Pakistan) | 2.6 million |
| google.com.ng (Nigeria) | 911,400 |
| google.cn (China) | 2.2 million |
Google Apps Statistics
(Reference: statista.com)
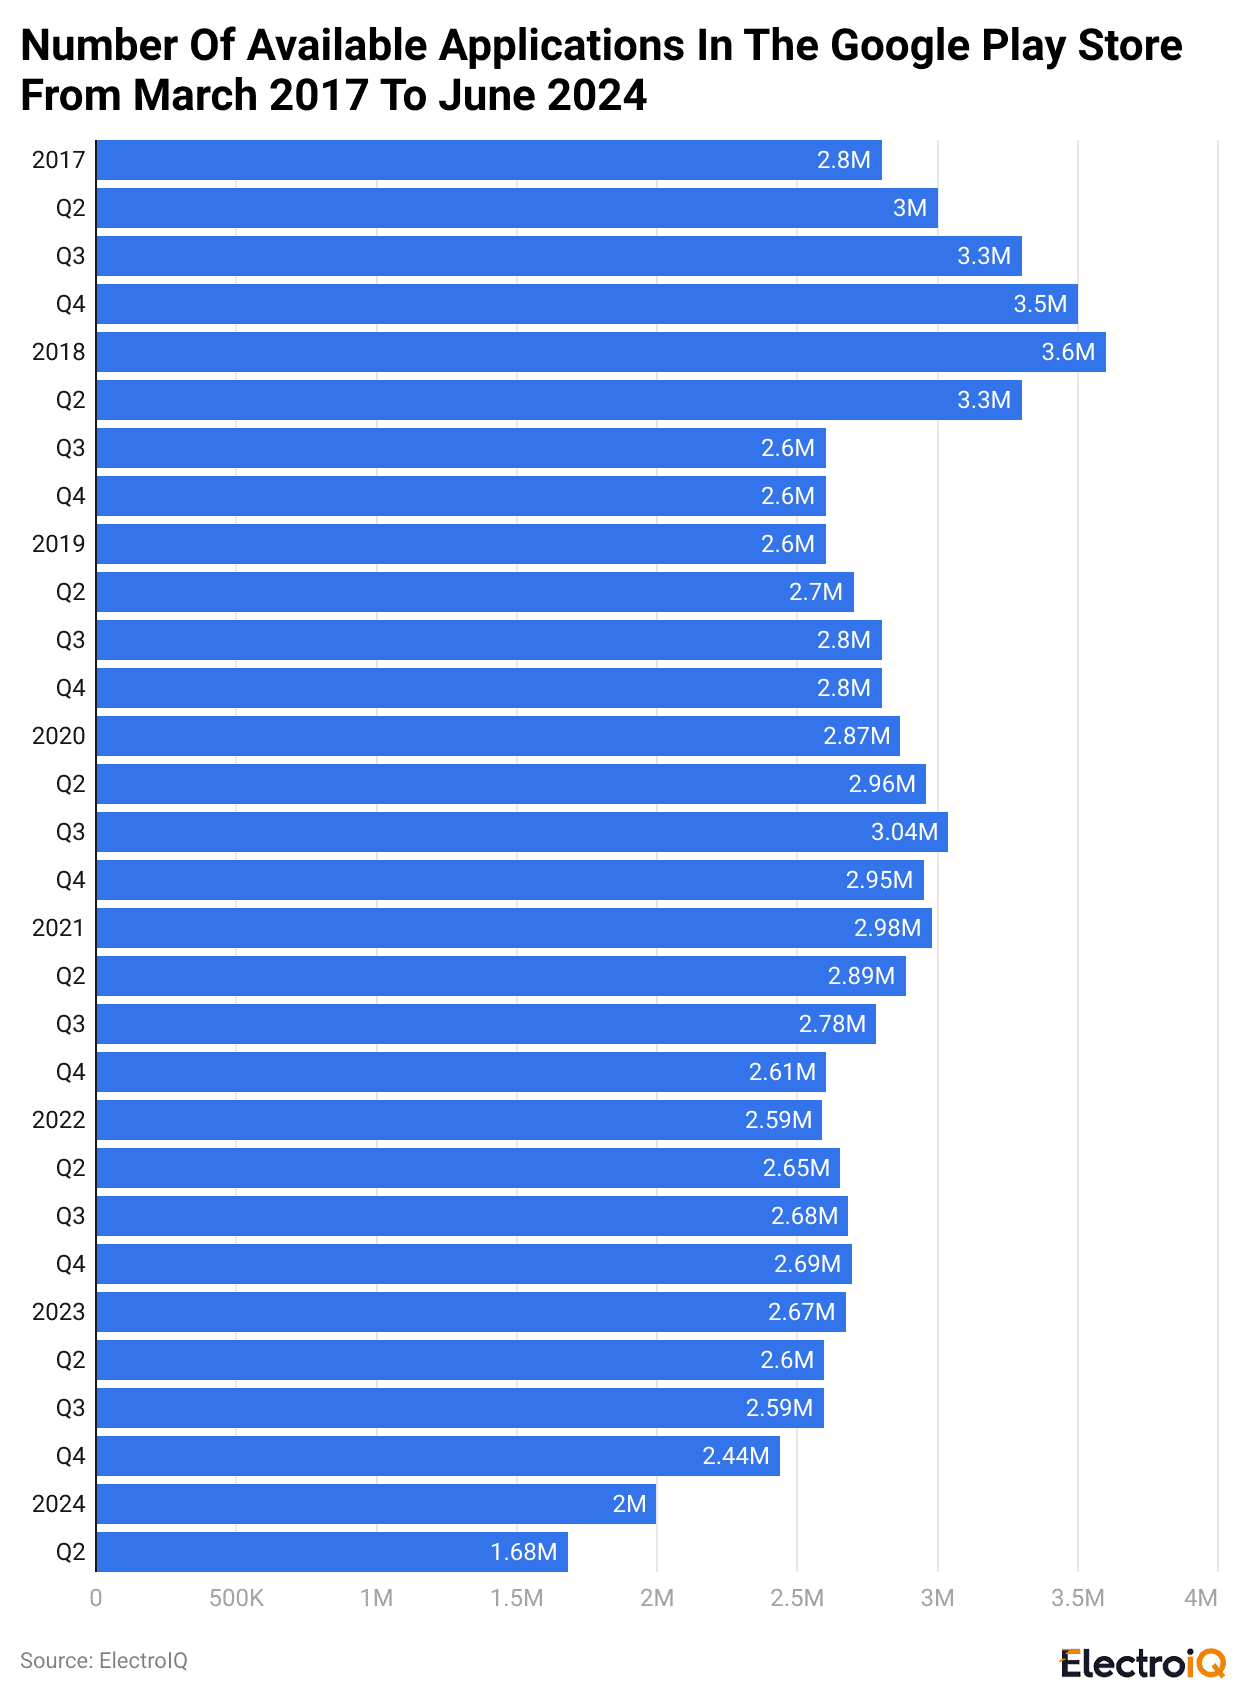
- As of June 2024, the total number of applications available on the Google Play Store was 1.68 million.
- According to the ListLink report, by 2025, there will be more than 3.9 million apps available on the Google Play Store.
- On the Google Play Store, around 3,200 new apps are launched every day, totalling roughly 96,000 each month.
- Over time, more than 2.6 million apps have been removed from the store, often because of poor performance, policy violations, or low quality.
- About 70 official Google apps exist, from niche tools like Arts & Culture to Gmail, Maps, YouTube, and Chrome.
People Using Google Statistics
- A report published by Exploding Topics in 2025 states that Google handles about 16.4 billion searches per day, or 189,815 searches per second.
- In Nigeria, Google captures 98.69% of all search traffic, while the United States generates 20.98% of Google visits.
- Globally, Google holds an 89.57% search market share, and its U.S. site receives 101.3 billion visits from 5.8 billion unique visitors in a typical month period overall.
- As of 2025, the total number of Google searches is about 4.2 billion per day, 29.4 billion per week, 126 billion per month, and 1,533 billion per year.
Google Usage Statistics By Region
(Source: similarweb.com)
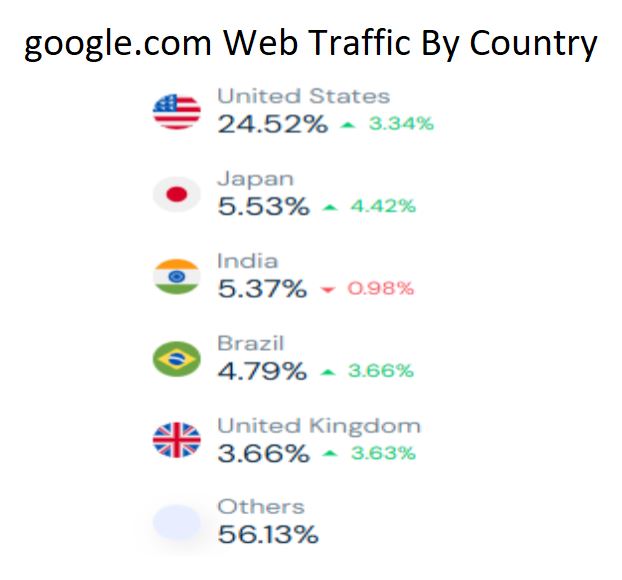
- As of October 2025, the United States accounted for the largest share of web traffic on Google.com, at 24.52% (up by 3.34%).
- Furthermore, other countries’ traffic shares follow Japan: 5.53% (+4.42%), India: 5.37% (-0.98%), Brazil: 4.79% (+3.66%), and the United Kingdom: 3.66% (+3.63%).
- Additionally, the traffic share of other countries amounted to 56.13%.
By Demographics
(Reference: similarweb.com)
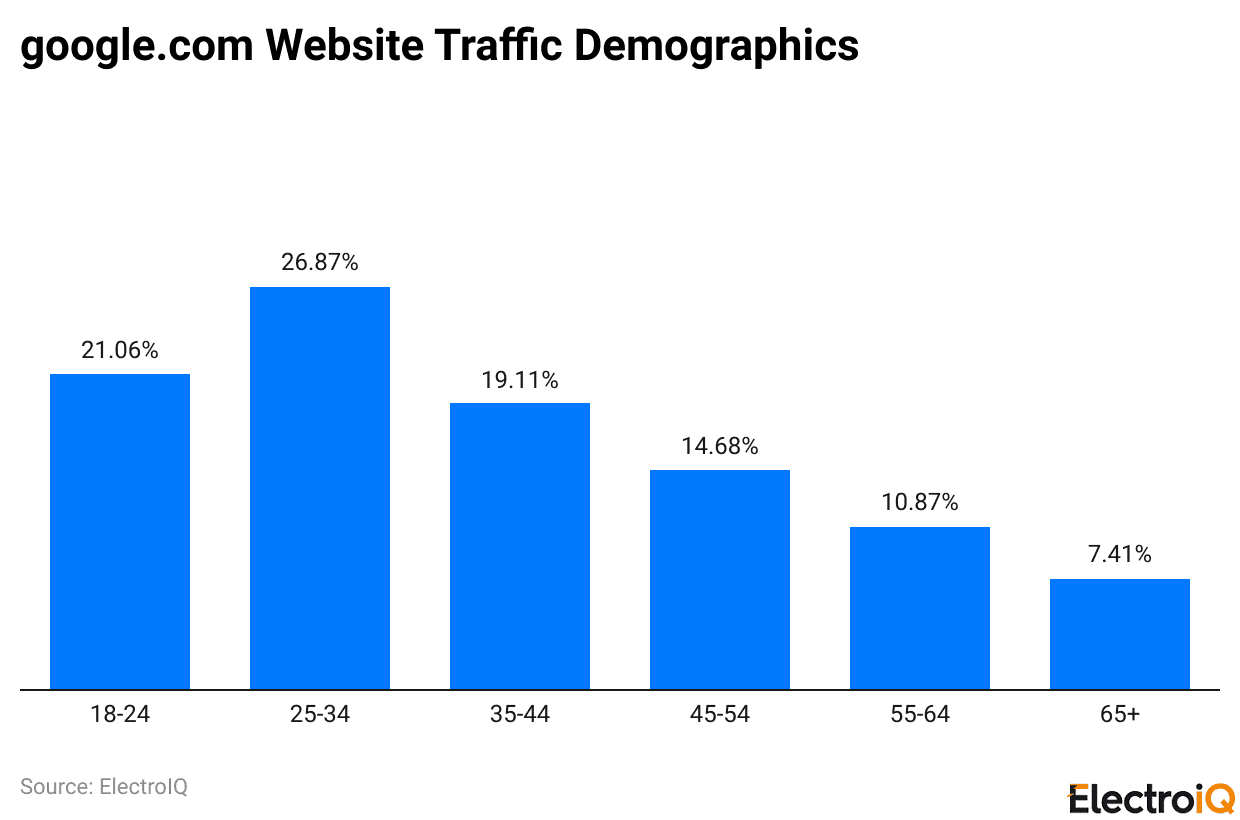
- In October 2025, the largest user share of 26.87% in Google.com was accounted for by the age group from 25 to 34 years.
- Other users’ shares are distributed by age group as follows: 121.06% (18 to 24 years), 19.11% (35 to 44 years), 14.68% (45 to 54 years), 10.87% (55 to 64 years), and 7.41% (65 years and above).
- The male and female user shares of the website accounted for 57.02% and 42.98%, respectively.
Google Searches Statistics
(Source: demandsage.com)
- In 2025, Google’s activity is estimated to reach about 189,815 searches every second.
- Besides, it adds up to roughly 11.4 million searches per minute and 684 million per hour.
- Over a full day, this amounts to approximately 16.4 billion searches, leading to about 492 billion searches per month and 5.9 trillion Google searches worldwide every year.
Types Of Google Searches
- A survey by Exploding Topics, around 44.19% of Google searches are for brands.
- When searches were grouped by intent, most were informational, accounting for 52.65% of all queries.
- Navigational searches, where users try to reach a specific site, accounted for 32.15%.
- Meanwhile, commercial searches related to product or service research accounted for 14.51%, and only 0.69% of queries were transactional.
Audio Google Searches Statistics
- According to Mage Comp, about 50% of Google searches were conducted via voice in 2024.
- Google logs over 1 billion monthly voice queries on Assistant devices.
- Daily, 41% of adults and 55% of millennials use voice search.
- Around 58% use it to find local businesses, and 40% of adults for products.
- Roughly 65% are question searches, and 60% of voice queries now come from mobile devices.
Visual Google Searches Statistics
- Since 2022, Google Lens has handled 1 billion visual searches each month.
- Google Image Search processes over 3.5 billion searches daily.
- Visual search tools achieve 95% accuracy, helping 62% of shoppers buy items they see.
- About 57% prefer visual search, with 30% of 2023 shopping using it.
- Google Lens drives 40% of visual searches and also appears on Instagram and Pinterest.
Google AI Statistics
- According to the blog.google, Gemini app logged more than 650 million monthly active users in Q3 2025, with query volume three times that of the previous quarter.
- AI Overviews reach 2 billion monthly users and appear for approximately 13% to 13.14% of searches, including 13.14% of U.S. desktop queries in March 2025.
- Moreover, 13 million developers build with Google generative AI models such as Gemini and Veo.
- Over 70% of Google Cloud customers now use at least one AI product.
- Gemini processes 7 billion tokens per minute via API and over 1.3 quadrillion tokens per month across Google, over 20 times higher than a year earlier.
- As mentioned on constellationr.com, Google Cloud Q3 2025 revenue hit USD 15.2B, up 34%, implying an annual run rate of around USD 61 billion and a USD 155 billion backlog, strongly driven by AI.
- Gemini-powered AI Mode in Search serves 75 million daily active users across 40 languages.
- As reported by Reuters, Google One, which bundles premium AI features, reached 150 million subscribers by May 2025, up from 100 million in 2024.
- Ironwood, Google’s 7th-generation TPU for inference, scales to 9,216 chips, delivering about 42.5 exaflops of compute per pod.
Top 5 Most Valuable Global Brands
- According to Brand Finance’s 2025 Global 500 study, Apple leads the ranking with a value of USD 574.5 billion, an 11% increase from 2024.
- Microsoft follows at USD 461.1 billion, up 35%, and Google is next at USD 413.0 billion, rising 24%.
- Amazon holds fourth place at USD 356.4 billion, up 15%.
- The only non-tech brand in the top five is Walmart, valued at USD 137.2 billion, up an impressive 42%.
Current Sustainability Initiatives At Google
- From 2010 to 2024, Google signed over 170 clean energy contracts totalling more than 22 gigawatts.
- In 2024, it alone added over 8 gigawatts of new deals, about twice the contracts of the year before.
- That year, electricity use rose 27%, mainly from AI, yet data-centre energy emissions fell 12% through efficiency and cleaner power.
- Google still targets net-zero emissions across its operations and value chain by 2030 and aims for 24/7 carbon-free energy on every grid it uses.
- The total greenhouse-gas emissions, however, reached about 11.5 million metric tons in 2024, an 11% increase.
- By 2030, the company plans to replenish 120% of the freshwater used in offices and data centres.
- By the end of 2024, it had run 112 water-stewardship projects and replenished 4.5 billion gallons, lifting replenishment from 18% in 2023 to 64% in 2024.
- Google plans to cut food waste per employee by half and send none to landfills by 2025.
- It wants to stay on track for its 2030 net-zero and 24/7 carbon-free energy “moonshot,” including long-term renewable deals such as a 15-year PPA for 1.5 terawatt-hours of solar power in Ohio and over USD 800 million in projects with Intersect Power to place data centres next to clean-energy plants.
- Google also says its AI tools could help other organisations reduce emissions by up to 1 gigaton of CO2 equivalent per year by 2030.
Conclusion
In conclusion, Google is no longer just a search engine; it has become a major technology company that many people use every day. Its apps and services help us find information, stay in touch, learn new things, do our work, and enjoy entertainment. At the same time, Google is often questioned about how it handles user data, how much control it has over the market, and how it uses AI. The way Google manages these issues will shape its future role in the digital world.
FAQ.
Google also offers email (Gmail), maps, cloud storage (Google Drive), mobile software (Android), online videos (YouTube), and many other services.
Yes, Google produces hardware such as Pixel phones, Pixel Watch, Nest smart-home devices, Chromebooks, and other consumer gadgets.
This is a free web browser from Google used to access and explore websites.
This is a cloud storage service for saving, sharing, and accessing files across devices.
This is an online tool for creating, editing, and sharing documents with others easily.
Google mainly earns money from online advertising, cloud services, hardware devices, app sales, and other product offerings.

Maitrayee Dey has a background in Electrical Engineering and has worked in various technical roles before transitioning to writing. Specializing in technology and Artificial Intelligence, she has served as an Academic Research Analyst and Freelance Writer, particularly focusing on education and healthcare in Australia. Maitrayee's lifelong passions for writing and painting led her to pursue a full-time writing career. She is also the creator of a cooking YouTube channel, where she shares her culinary adventures. At Smartphone Thoughts, Maitrayee brings her expertise in technology to provide in-depth smartphone reviews and app-related statistics, making complex topics easy to understand for all readers.


